 |
| About Bioline | All Journals | Testimonials | Membership | News |
|
||||||
|
||||||
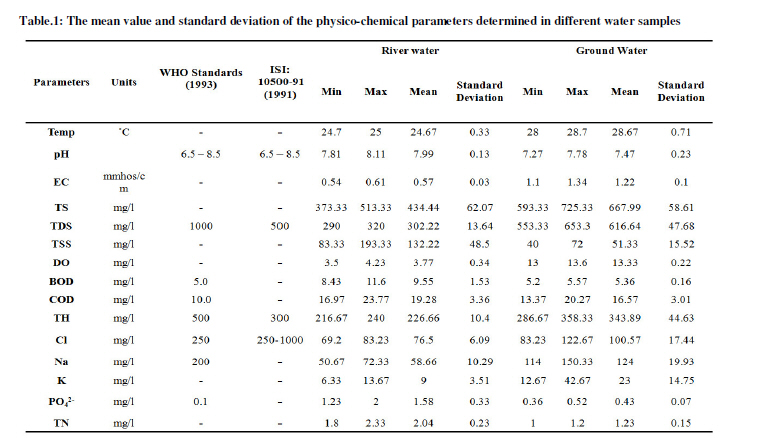
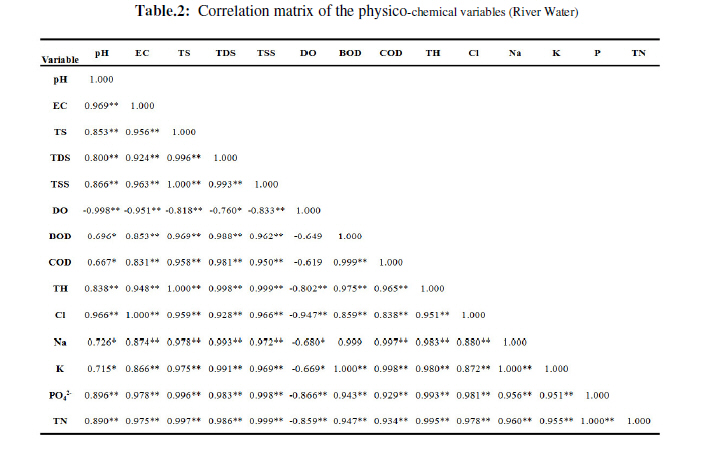
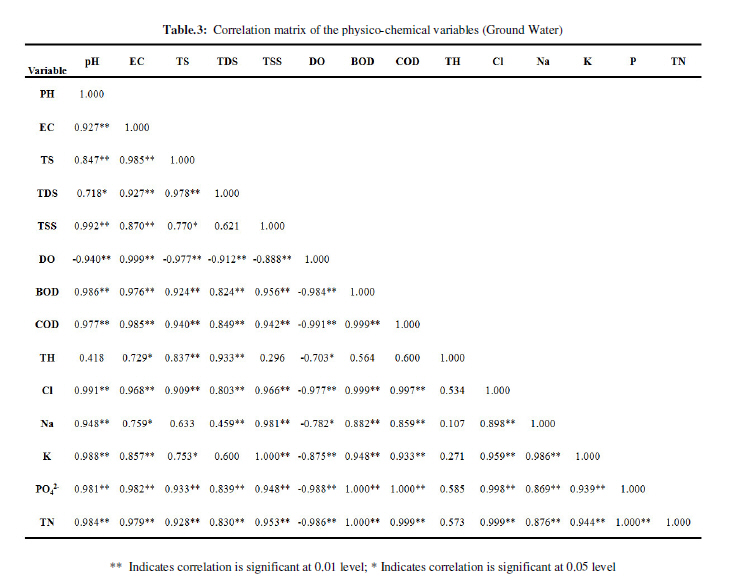
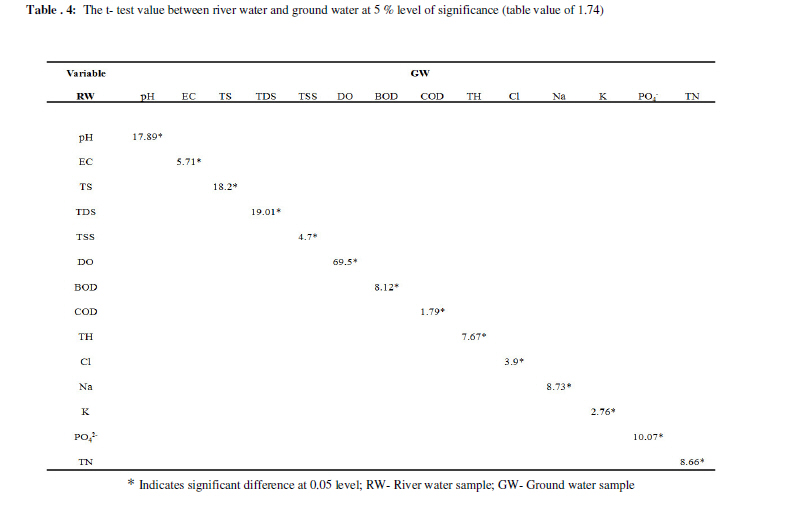
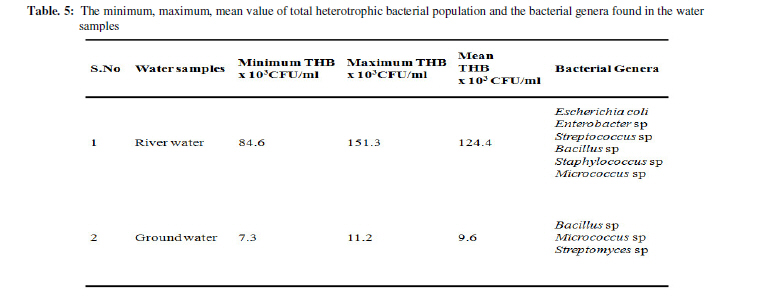
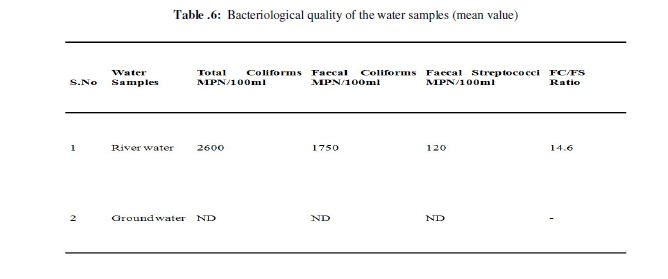
Physico-Chemical and Bacteriological Characteristics of Noyyal River and Ground Water Quality of Perur, India 1Usharani, K; 2Umarani, K.; 3Ayyasamy, P.M.; 4Shanthi, K., 5Lakshmanaperumalsamy, P.*1,3,4,5Division of Environmental Microbiology, Department of Environmental Sciences, Bharathiar University, Coimbatore – 46, TN, India Code Number: ja10023 ABSTRACT The study was conducted to findout the physico-chemical and bacteriological characteristics of Noyyal River and ground water quality of Perur, India. The river water and ground water (bore well and open well) samples were collected in and around Perur and analyzed for various physico-chemical and bacteriological parameters. The study indicated that the mean value of studied parameters, except phosphate, biological oxygen demand (BOD), chemical oxygen demand (COD) of the river water and ground water samples were within the permissible limit. The parameters include total suspended solids (TSS-132.2 mgl-1), BOD (9.55 mgl-1), COD (19.28 mgl-1), phosphate (PO42--1.58 mgl-1) and total nitrogen (TN-2.04 mgl-1) of the river water sample were found higher when compared to the ground water samples. The bacteriological study showed that the total heterotrphic bacteria (THB -124.4 x 10³ CFU/ml), Total Coliforms (TC-2600 MPN/10ml), Faecal Coliforms (FC-1750 MPN/10ml), Faecal Streptococci (FS-120 MPN/10ml) and FC/FS ratio (14.6) in the river water samples were found to be greater than the standard WHO limits. The generic distribution in the samples revealed that the presence of Escherichia coli, Staphylococcus, Enterobacter, Streptococci, Bacillus and Micrococcus were predominant in river water samples. The river water was found to be unfit for human consumption due to the exceeding level of Coliforms. The quality of ground water around Noyyal River was found to be safe and utilizable for cultivation purposes. If the quality management is properly maintained, the river water could be utilized for a wide range of application viz, irrigation, drinking etc. @ JASEM Water is the elixir of life, a precious gift of nature to mankind and millions of other species living on the earth. It is fast becoming a scare commodity in most part of the world. Water resources comprising of surface water (river and lakes), ground water, and marine and coastal waters support all living things including human beings. Though water is available in the universe in huge quantity in the order of 1400 x 106 km3, only 3% of the waters in the universe are fresh water. Among the fresh waters, only about 5% of them or 0.15% of the total world waters are readily available for beneficial use. The total water resource available in India is 1850 km3, which is roughly 4% of the world's fresh water resources (EPA-PWD, 2001). Tamil Nadu accounts for 4 % of the land area and 6 % of the population, but only 3 % of the water resources of the country. Most of Tamil Nadu is located in the rain shadow region of the Western Ghats and hence receives limited rainfall from the southwest monsoon (TNDR, 2005). The State gets relatively more rainfall during northeast monsoon, especially, in the coastal regions. The normal rainfalls in South-West and North-East monsoon are around 322 mm and 470 mm respectively, which are lower than the National normal rainfall of 1250 mm. Similarly, the per capita water availability of the State is 800 cubic meters which is lower than the National average of 2300 cubic meters (EA, 2003 and 2004). The Noyyal River is a tributary of the River Cauvery and originates from the Vellingiri Hills of the Western Ghats in the Coimbatore district of Tamil Nadu, South India. The Coimbatore district gets maximum rainfall from South-West monsoon followed by the North-East monsoon and is very close to Western Ghats. It is located 410 meters above sea level with moderate climate and average annual rainfall of 61.22 cms. The river has moderate to good flow for a short period during the North–East and South–West monsoons and flows over a distance of 180 km in an area of 3510 km2.It passes through seven taluks (Coimbatore, Tirupur, Avinashi, Palladam, Karur, Erode and Dharapuram) in four districts (Coimbatore, Erode, Karur, and Trichy). The boundary of this river is in north latitude of 10.54' – 11.19' and North Eastern longitude of 76.39' – 77.5’. The river supplies water to several Tanks located in and around Coimbatore district in approximately 1600 acres (Palanivel and Rajaguru, 1999). Cultivated land in the basin amounts to 1,800 km² while the population density is 120 people per km² in the countryside and 1000 people per km² in the cities. The area is known for its scanty rainfall and the development of the Noyyal River Tanks System to hold any overflow from the rains plus the water of the North-East and South-West monsoon season was ecologically important. The South-West monsoon starts from June-August; a humid condition in September followed by a rain in October to November by the North-East monsoon. The River Noyyal gets showers for only 3 to 4 months. The common crops cultivated are rice, millet, sugarcane, cotton and groundnut which require more water than other crops like turmeric, gingelly (Sesamum indicum) and bean which are also cultivated in specific regions. The river flows in a periodic manner and it receives water during North-East rainfall from September to November and it remains dry during rest. The 173 km long tributary of the Kaveri River filled 32 tanks. These interconnecting tanks held the water flowing from the Noyyal. The river supplies water to several tanks located in and around Coimbatore. The area of land irrigated by the river in Coimbatore district is approximately 1600 acres (Palanivel and Rajaguru, 1999). As it pased throught towns and cities, sewage from several sources are discharged into it. Percolation of the wastes through the soil results in the contamination of the ground water sources. Study area and its Location: The study area of Perur town panchayat is located in Coimbatore district of Tamil Nadu (S. India), with human population of nearly 7,937 (2001 census) spread over an area of about 6.4 km2 on the banks of river Noyyal, 22 km from the place of its origin in the Vellingiri hills. From Perur it passes through seven taluks and covering four districts before it mixes with the river Cauvery. The study area of the river was the starting place where the discharge of domestic sewage and washing of vehicles, bathing of animals, human activities, releasing of municipal wastes are the main sources of pollutants in the Noyyal River. Hence the study has been carried out to analyze the physicochemical and bacteriological parameters of the Noyyal river water and ground water of the nearby irrigated land in Perur, also to assess the impact of percolation of river water flow on the ground water, irrigation and drinking water sources. MATERIALS AND METHODS Sample collection: Surface water samples from the Noyyal River and the ground water samples from the wells of the nearby-irrigated lands of the river were collected from different sampling sites. The ground water samples were taken from the open and bore wells of the irrigated lands at a depth of 120-150 m height from the ground level. The river water samples (9) and ground water samples (9) were collected in clean sterile plastic containers from three different sites at monthly intervals during the rainy season of the study period from September to November 2007. The samples were transported to the laboratory within 3 hrs for analysis of physico-chemical parameters and bacteriological quality. Physico-chemical parameters: The temperature, pH and electrical conductivity of the water were determined in situ with a portable thermometer, pH meter (Jenway, U.K) and conductivity meter (Jenway, U.K). The physico-chemical parameters, such as total solids (TS), total suspended solids (TSS), total dissolved solids (TDS), total hardness . (TH), dissolved oxygen (DO), BOD, COD, chloride, phosphate, sodium, potassium, total nitrogen, were analyzed. The collection, preservation and analysis of various parameters of water samples from different sampling locations were carried out, by following the standard methods (APHA, 1995; Saxena, 1994; Manivasakam, 1987). Triplicates of each analysis were performed and mean values were used for calculation. The results were compared with the World Health Organization (WHO) and Indian drinking water standards. Table 1 summarizes the measured parameters and their units, permissible limits, and the mean and standard deviations found in different water samples. Statistical analysis was carried out using Statistical Package for Social Sciences (SPSS 10.0). The correlation coefficient values among the parameters for both river and ground water are presented in Tables 2 and 3. The ttest was performed to find out the significant difference between the parameters of river and ground water samples as given in Table 4. Bacteriological quality: Standard techniques were followed for collection and bacteriological analysis of water samples (APHA, 1985). The water samples were analysed for total heterotrophic bacteria (THB), total coliforms (TC) and faecal coliforms (FC). Pour plate technique was employed to enumerate bacteria and the total heterotrophic bacteria were determined using nutrient agar medium. The most probable number (MPN) method was employed for the total and faecal coliforms. Presumptive coliform test was done using multiple 5-tubes MPN dilution technique using MacConkey broth. Fecal streptococci (FS) MPN counts were made using sodium-azide broth in the presumptive test followed by streaking a heavy inoculum into MacConkey agar plates. MPN of fecal coliform and faecal streptococci were estimated following standard methods for the examination of water and wastewater (APHA, 1998). Morphologically different colonies were isolated and identified by using Bergy's Manual of Determinative Bacteriology (Buchanan and Gibbons, 1974). Table 5 summarizes the measured parameters of THB with minimum, maximum and mean values; and the bacterial genera found in different water samples. The mean value of the measured parameters of TC, FC, FS and their FC/FS ratio of water samples are represented in Table 6. RESULTS AND DISCUSSION Physico-chemical characteristics of water samples: The results as presented in Table 1 shows that the river water from three different locations were moderately alkaline (pH 7.81–8.11) and within the permissible limit (pH 6.5-8.5) of drinking water standards of WHO, 1993. The temperature range was similar and there was no difference between stations. When compared to ground water (open well and bore-well waters), the river water showed a minor variation and this was due to the discharge of sewage and domestic wastes which also brings about thermal changes in natural waters. Impinging solar radiation and the atmospheric temperature brings interesting spatial and temporal changes in natural waters. The rise in temperature of water accelerates chemical reactions, reduces solubility of gases, amplifies taste and odour and elevates metabolic activity of organisms. The EC of three locations of the Noyyal River samples were similar to EC value of the Cauvery river water reported by Edwin Chandrasekaran (1999). The EC value was found within the permissible limit. The average value of dissolved oxygen (DO) in river water was ranged from 4.2 mg/l to 3.5 mg/l which are acceptable when compared to the tolerance limits 3 mg/l or higher as prescribed by the ISI: 2296-(1982) for Inland surface water subject to pollution. Aggarwal et al. (2000) reported that in Varuna river water, the DO was observed to be decreased in point source and increased in upstream. This reverse trend was due to eutrophication and increase in the bacterial population, which results in a heavy-BOD which inturn, reduces the DO. The maximum BOD and COD values were 11.6 mg/l and 23.7 mg/l,, respectively in river water. There was a significant degree of self-purification as the river water flows. The mean BOD (9.5 mg/l) and COD (19.2mg/l) of the Noyyal river water were high when compared to ground water samples; it was found one and half times greater than the permissible limit (5mg/l-BOD; 10mg/l–COD). The presence of large quantities of organic materials resulted in high BOD at some points and it may be due to confluence of domestic sewage and solid waste etc. The BOD values of 1mg/l due to naturally occurring organic decaying leaves and animal wastes and BOD values in excess of 10 mg/l indicated the presence of sewage pollution. Low BOD was mainly due to higher algal productivity, along with increased solubility of oxygen at low temperatures, while maximum resulted from the rapid utilization of oxygen at higher temperatures (Chetana and Somashekhar 1997). Direct discharge of untreated domestic waste into the river was responsible for the high organic pollution, and led to very high BOD and COD values in the upstream sites, which were gradually reduced in the downstream sites. The BOD values of the ground water of the irrigated lands of the studied area are found to be almost similar to the permissible limit of WHO and are fit for irrigation purposes. The average phosphate concentration of river and ground water samples was found to be above the permissible limit (0.1 mg/l – PO44 2-). Maximum level of phosphate (1.58 mg/l) was found in the river water where it receives maximum sewage, domestic wastes and human activities. Use of detergent may increase the phosphate concentration to great extent. The anthropogenic additions of phosphorus to the river have a considerable effect on the quality of the water. Such phosphorus is derived mainly from domestic sewage and the runoff from agricultural areas. The quantity of phosphorus in the domestic sewage and land drainage have increased considerably in recent years due to the increased use of synthetic detergents which contain approximately by weight, the inorganic condensed phosphates. The river is used for the washing purposes and the detergents would enhance the load of this element. A higher amount of phosphate represent high pollution loads and causes eutrophication of the aquatic body. The total dissolved solids (TDS) of the different sites of river and ground water samples were found within the permissible limit (1000mg/l) of WHO standards. Due to the nature of flow, run-off river water occurred during heavy rainy seasons certain variation may occurred, but this variation did not affected the irrigation system of ground water and soils. Palanivel and Rajaguru, (1999) reported that TSS and TDS of the Noyyal River in Tiruppur exceeded the tolerance limit in all the sampling point, the addition of these parameters make the Noyyal River dirty and affected the aquatic life in Tiruppur area. The average TS, TDS, TSS, total hardness (TH), Cl -, Na+, K+ and total nitrogen content of river water and ground water were found within the permissible limit. The nitrogen content in irrigation water is generally considered beneficial, barring the nitrite form of nitrogen. It also contained that discharge of ammonium nitrogen and subsequent oxidation that could reduce the DO level in rivers (Sawyer and Mc Carty, 1988, Baruh et al., 1993). Although the samples of river and ground waters contained the Na+ and K+ within the permissible level, among these, the maximum Na+ and K+ was noticed in ground water of irrigated lands which are beneficial for irrigation purposes. The study indicated that the temperature, pH, EC, BOD, COD, chloride, phosphate, sodium, potassium and total nitrogen were found to increase with the increase of sewage as in point source when compared to the upstream and downstream sites. The parameters include TSS, BOD, COD, PO4-and TN were found to be maximum in river water but the parameters such as pH, EC, TS, TDS, DO, TH, Cl -, Na+and K+ were found to be maximum in ground water. The phosphate level in river water exceeds the permissible limit of WHO drinking water standards and this may due to the discharge of sewage, domestic wastes and human activities. The presence of phosphate accelerated the activities of some of the microorganism, the DO level was depleted. A decrease in dissolved oxygen (DO) in river water was due to increased values of other parameters as mentioned above. The transparency also decreased due to the addition of variety of pollutants and quantity of suspended matter. In order to find out the relationship amongst physicochemical parameters of the water samples, correlation coefficients were worked out and a large number of significant correlations were obtained. The statistical analysis (Tables 2 and 3) showed the correlation matrix of the 14 physico-chemical variables. It is clear from the results that the DO was negatively correlated with all the variables and was not significantly correlated with any of the studied parameters. All the variables except DO were positively and significantly correlated (at 0.05 level) with all the studied parameters. The test of significant difference between river water and ground water was found to be significant at 5 % level with table value of 1.74 (Table 4). There was a significant difference found between the variables of river and ground water. Sunitha et al., 2005 identified that the EC finds higher level correlation significance with many of the water quality parameters, like TDS, chlorides, total alkalinity, sulphates, total hardness and magnesium. Mahajan et al., (2005) identified that all the parameters are more or less correlated with others in the correlation and regression study of the physiochemical parameters of ground water. Kalyanaraman (2005) identified that the water quality of ground water can be predicted with sufficient accuracy just by the measurement of EC alone. This provides a means for easier and faster monitoring of water quality in a location. Achuthan Nair et al., 2005 concluded that the correlation study and correlation coefficient values can help in selecting treatments to minimize contaminants in groundwater. Bacteriological quality of water samples: The quality of river water was deteriorated by the presence of bacterial population. The mean THB population (124.4 x 10³ CFU / ml) was found higher in the river water sample when compared to ground water (Table 5). Table 6 shows the mean value of the bacteriological counts such as total coliforms (2600 MPN/100ml), faecal coliforms (1750 MPN/100ml) and faecal streptococci (120 MPN/100ml) in the river water. From the table it was evident that the river water is highly contaminated, and also denotes the potential public health hazards. The maximum permissible value of total coliforms in drinking water is 1 per 100ml (ICMR, 1975) and 10 per 100ml (WHO, 1993). E. coli can be used as bio-indicators of aquatic ecosystem dynamics and determination of their occurrence may help to assess the water quality. Presence of coliforms organisms in water regarded as evidence of faecal contamination as their origin in the intestinal tract of human and other warm blooded animals. This clearly indicates that the bacterial contamination in the river water is chiefly caused by human excreta and domestic sewage, which is objectionable for drinking purposes. The bacterial genera such as Escherichia coli, Staphylococcu sp, Enterobacter sp, Streptococci sp, Bacillus sp and Micrococcus sp were predominant in river water samples and may be due to domestic solid waste and sewage from various human activities. The bacterial population was found to be higher density in the river water when compared to the irrigated ground water. Hence the data show that the river water is considered to be unfit for drinking purposes. Escherichia coli and other faecal coliforms were not detectable in the ground water samples and are found to be suitable for drinking as well as irrigation purposes. Conclusion: The rise of the inflow of waste is clearly due to the rapid growth of residential and commercial activities in the study area. Due to the discharge of sewage, domestic wastes and human activities the phosphate load in river water exceeds the permissible limit of WHO drinking water standards. Although the sewage mixes with the river system, the river water could be used for irrigation but this is unsuitable for drinking purposes due to the presence of faecal coliforms, E. coli, other bacterial population and higher concentration of phosphate, BOD and COD. The bacteriological counts in the river water make the water unfit for human consumption. The groundwater around the Noyyal River was found to be suitable for irrigation purposes. The presence of phosphate, BOD and COD levels clearly indicated that the river water and ground water are getting contaminated with salt that may affect soil conditioning. Suitable measures have to be taken to minimize the load of salts in the soil, so that the fertility could be maintained and better yield may be obtained. It is concluded that the river is polluted as it is used as a sewer disposal site, but is also undergoing selfpurification and has potential for significant improvement in water quality if discharges are ameliorated. Regular monitoring of river and taking suitable remedial measures like collection of domestic sewage and setting up the common treatment plant; before discharge of sewage into river system, it should be treated. This will control pollution and prevent the depletion of the quality of river waters. Acknowledgement: The author Ms. K. Usharani is thankful to DES, Bharathiar University and TNSCST for providing necessary facilities. REFERENCES
The following images related to this document are available:Photo images[ja10023t5.jpg] [ja10023t1.jpg] [ja10023t2.jpg] [ja10023t3.jpg] [ja10023t4.jpg] [ja10023t6.jpg] |
| |||||||||
