 |
| About Bioline | All Journals | Testimonials | Membership | News |
|
||||||
|
||||||
Journal of Applied Sciences and Environmental Management, Vol. 14, No. 2, June, 2010, pp. 37-41 Characterization of Formation Water Constituents and the Effect of Fresh Water Dilution from Land Rig Location of the Niger Delta, Nigeria 1Joel, O.F.; 2Amajouyi, C.A.; 3Nwokoye, C.U.
1Department of Petroleum and Gas Engineering, Faculty of Engineering,
University of Port Harcourt, PMB 5323, Nigeria 2, 3Pollution Control and Environmental Management Limited, Port Harcourt, Nigeria
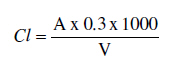
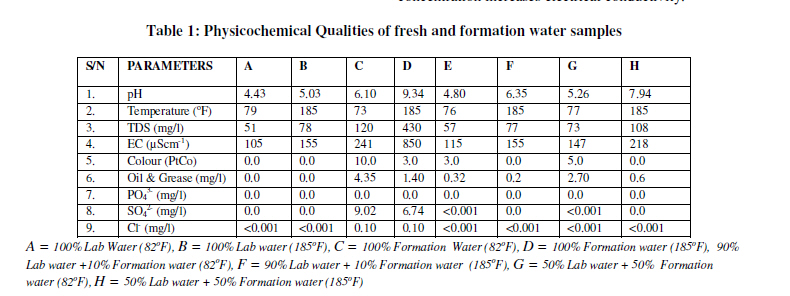
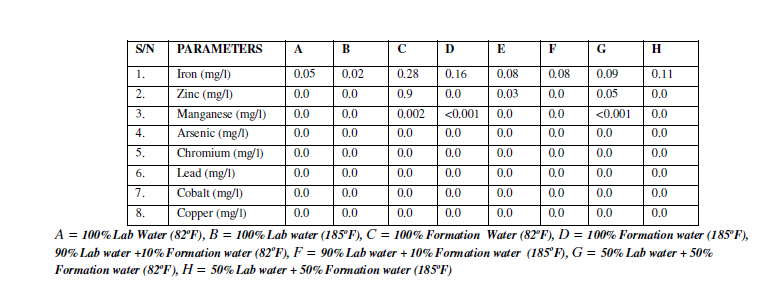
Code Number: ja10024 ABSTRACT The research work examined the constituents of formation water and fresh water dilution effects from a land location in the Niger Delta Area of Nigeria. Some selected physicochemical and microbiological analyses were determined at ambient temperature (82oF) and formation temperature (185oF). Analysis of the mixture of the formation water and fresh water were carried out at various ratios of (90/10 and 50/50) % respectively. Test results indicated that dilution effect of the fresh water on the formation sample resulted in reduction in concentrations of most of the parameters both at the ambient and formation temperatures. However, some physicochemical parameters like (pH, TDS and Electrical conductivity) showed higher concentration values at formation temperature than ambient temperature. While the pH values for the 90/10 ratio at both ambient and formation temperatures gave 4.80 and 6.35 respectively, the values for the 50/50 ratio at both ambient and formation temperatures were 5.26 and 7.94 respectively. The oil & grease values for 90/10 ratio at both ambient and formation temperature were 0.32(mg/l) and 0.2(mg/l) respectively. While the 50/50 ratio at both ambient and formation temperatures were 2.70(mg/l) and 0.6(mg/l) respectively. The iron concentration for the 90/10 and 50/50 ratios at both ambient and formation temperatures were 0.08, 0.08 (mg/l) and 0.09, 0.11 (mg/l) respectively. There was no incompatibility in terms of precipitation observed with the different mixtures at both temperatures. In order to safely dispose formation water in compliance with environmental regulations, dilution with uncontaminated fresh water is recommended. @ JASEMIn subsurface formations, naturally occurring rocks are generally permeated with fluids such as water, oil, or gas (or some combination of these fluids). It is believed that the rock in most oil-bearing formations was completely saturated with water prior to the invasion and trapping of petroleum (Amyx et al. 1960). The less dense hydrocarbons migrated to trap locations, displacing some of the water from the formation in becoming hydrocarbon reservoirs. Thus, reservoir rocks normally contain both petroleum hydrocarbons (liquid and gas) and water. Sources of this water may include flow from above or below the hydrocarbon zone, flow from within the hydrocarbon zone, or flow from injected fluids and additives resulting from production these fluids are brought to the surface. The composition of this produced fluid is dependent on whether crude oil or natural gas is being produced and generally includes a mixture of either liquid or gaseous hydrocarbons, produced water, dissolved or suspended solids, produced solids such as sand or silt, and injected fluids and additives that may have been placed in the formation as a result of exploration and production activities. Produced water is not a single commodity. The physical and chemical properties of produced water vary considerably depending on the geographic location of the field, the geological formation with which the produced water has been in contact for thousands of years, and the type of hydrocarbon product being produced. Produced water properties and volume can even vary throughout the lifetime of a reservoir. If water-flooding operations are conducted, these properties and volumes may vary even more dramatically as additional water is injected into the formation. Knowledge of the constituents of specific produced waters is needed for regulatory compliance and for selecting management/disposal options such as secondary recovery and disposal. Oil and grease are the constituents of produced water that receive the most attention in both onshore and offshore operations, while salt content (expressed as salinity, conductivity, or TDS) is a primary constituent of concern in onshore operations. In addition, produced water contains many organic and inorganic compounds. These vary greatly from location to location and even over time in the same well. The organic and inorganic components of produced water discharged from offshore wells can be in a variety of physical states including solution, suspension, emulsion, adsorbed particles, and particulates (Tibbetts et al., 1992). In addition to its natural components, produced waters from oil production may also contain groundwater or seawater (generally called “source” water) injected to maintain reservoir pressure, as well as miscellaneous solids and bacteria. Most produced waters are more saline than seawater (Cline 1998). They may also include chemical additives used in drilling and producing operations and in the oil/water separation process. In produced water, these chemicals can affect the oil/water partition coefficient, toxicity, bioavailability, and biodegradability (Brendehaug et al., 1992). With increased development of sub-sea oil fields in the North Sea and the Gulf of Mexico, many of these additives will be required in larger amounts, to assure flow assurance in sub-sea pipelines (Georgie et al., 2001). These chemicals, either individually or collectively, when present in high concentrations, can present a threat to aquatic life when they are discharged or to crops when the water is used for irrigation. Produced water can have different potential impacts depending on where it is discharged. For example, discharges to small streams are likely to have a larger environmental impact than discharges made to the open ocean by virtue of the dilution that takes place following discharge. Numerous variables determine the actual impacts of produced water discharge. The main contributors to acute toxicity short-term effects of produced water have been found to be the aromatic and phenol fractions of the dissolved hydrocarbons (Frost et al. 1998; Glickman, 1998). In addition, sometimes, particularly with deep offshore operations, existing separation equipment cannot remove all of the oil and grease to meet regulatory limits. In these cases, chemicals are used, but some of these chemicals can have toxic effects. The impacts of produced water and produced water constituents in the short term depend largely on concentration at the discharge point. They also depend on the discharge location. Deep-water discharges, for example, where there is rapid dilution, may limit the potential for detrimental biological effects and for bioaccumulation of produced water constituents. The objective of this project therefore is to evaluate the constituents of the formation water, as well as to determine the effect of fresh water dilution. MATERIALS AND METHODS Sampling: All the collected samples were preserved in accordance with guidelines and International Standards. All other QA/QC procedures relevant to sample collection, custody and analyses were strictly adhered to (APHA 1995; ASTM, 1979). Physico-chemical analysis: ph/temperature (apha 460), conductivity (apha 145), and tds (apha 208d): These chemical properties were determined electrometrically with a multi-parameter data logger (Hanna model HI991300). Chloride (APHA 2520A): These were determined titrimetrically. About 25ml of the sample was measured in a beaker and a drop of potassium chromate indicator added. The solution was titrated with AgNO3 solution until the appearance of brick red colour as the end point. The amount of chlorine (mg/l) was obtained as
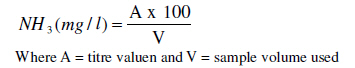
V Where A = volume of AgNO3 titrated and V = volume of sample Ammonia (APHA 4500C): About 50ml of the sample was measured into distillation flask. 0.4g of magnesium oxide was added and distilled into a beaker containing 10ml of 2% boric acid and combined indicator. This was titrated back with 0.1M HCl and the titre and the value was recorded.
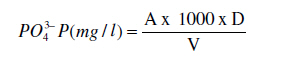
V Where A = titre valuen and V = sample volume used Phosphate Determination (APHA 425C): About 1 drop of phenolphthalein indicator was added to 100 ml 0f the sample. 4ml of the molybdate reagent was added and mixed thoroughly. About 0.5ml stannous chloride was added, making sure that all reagents were maintained between 20-30oC. After 10 minutes, the absorbance was measured @ 690nm with 10mm cell curvet.
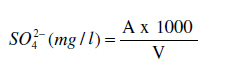
Where A = reading from curve, D = dilution factor. Sulphate Determination (APHA 427C): About 20ml Buffer solution A was added to 100ml of the sample and the contents mixed. While stirring, a spoonful of barium chloride crystals was added and timing was started immediately. After 1min stirring at constant speed, the solution was poured into 10mm cell and measured within 5mins at 425nm.
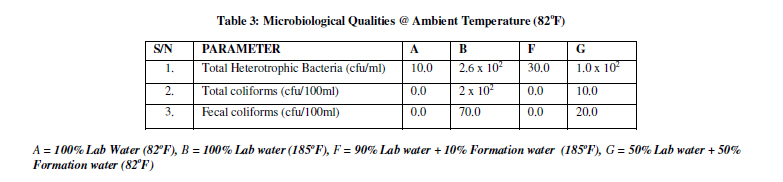
Heavy Metals Determination (AAS): Samples were pretreated with 2ml conc. HNO3 per litre of sample. The equipment was conditioned by auto-zeroing it with distilled water and with conc. HNO3. The pre-treated sample was analysed for heavy metals using the appropriate hollow cathode element of each metal of interest at the appropriate wavelength, lamp current, band-pass, and background correction. Oil and Grease Determination (ASTM D 3921): About 100ml acidified sample (pH 2) was measured into a graduated glass bottle. 4ml of an organic solvent was added to the sample and the bottle vigorously shook for 2mins. The contents of the bottle were emptied into a separating funnel and shook vigorously. The stopper of the funnel was intermittently opened to release pressure build up. The contents of the funnel were allowed to settle. The bottom layer of the solution was transferred into a clean beaker using glass funnel previously stuffed with cotton wool and 1g anhydrous sodium sulphate at the aperture of the glass funnel to absorb water. MICROBIOLOGICAL QUALITY: Total Heterotrophic Bacteria (APHA 9215B): About 1ml of the water samples was aseptically transferred, using a sterilized dropper, into a sterile test tube containing 9ml of the diluent. This gave 10-1dilution. Subsequently, four fold (10-4) serial dilutions were prepared from the 10-1 dilution. Inoculation and Enumeration of Water Samples: 0.1ml aliquot of 10-4 dilution was aseptically removed with a sterile pipette and spread plated with flame sterilized glass spreader on well dried agar plates. This was incubated at 28 ± 2oC for 24hrs. The colonies counted were expressed as colony forming unit per ml. Total Coliforms (APHA 9216C): About 100ml of the water samples was filtered through membrane filter with the aid of vacuum pump. The filter membrane was placed in the m-HPC agar plate. This was then incubated using an incubator pre-set to 35 ± 5oC for 24hrs. Observation was made for colony development on the filter membrane. The colonies were then counted as colony forming unit per 100ml. Fecal Coliforms (APHA 9216D): About 100ml of the water samples was filtered through membrane filter with the aid of vacuum pump. The filter membrane was placed in MacConkey agar plate. This was then incubated using an incubator pre-set to 44.5 ± 2oC for 24hrs. Observation was made for colony development on the filter membrane. The colonies were then counted as colony forming unit per 100ml. RESULT AND DISCUSSION Test results of physico-chemical parameters indicated (Table 1) that while most of the parameters showed lower or no values with the fresh water sample, the values were higher and significant with formation sample. Fresh water at (82oF) had TDS of 51mg/l and 120mg/l for formation water respectively. This could be attributed to suspended and dissolved solids inherent in the formation sample. The electrical conductivity at (82oF) for fresh water 105(µScm-1) and 241(µScm-1)for formation sample. This is a reflection of the concentrations of the TDS in the samples. Higher concentration increases electrical conductivity. Oil and grease and SO42-were negative in the fresh water sample at ambient temperature but have values of 4.35mg/l and 9.02mg/l respectively with the formation sample. This could be attributed to contamination with oil and sulphate from the formation fluids. Increase in temperature also increased the concentration of most of the parameters. While the TDS was 51mg/l at (82oF) for fresh water, it was 78mg/l at185oF . This trend was also seen with the formation water sample result, 120mg/l and 430mg/l respectively at 82oF and 185oF. This could be as a result of increase in concentration of the suspended and dissolved solids due to evaporation at higher temperatures. The electrical conductivity followed the same trend as well. Table 2 indicated that the concentration of most of the heavy metals were negligible in both the fresh and formation samples. However, the iron concentration for both the lab water sample and the formation water samples reduced from 0.05mg/l to 0.02mg/l and 0.28mg/l to 0.16mg/l at the ambient and formation temperature respectively. This could be attributed to oxidation processes of the iron metals at elevated temperatures. All the parameters analyzed in both the physicochemical and heavy metal parameters at ambient temperature except for pH and nitrate were lower in the fresh water than the formation water (Table 1 and 2). This is in line with previous work of Frost et al., 1998, who showed that numerous variables determine the actual impacts of produced water discharge which include the physical and chemical properties of the constituents, temperature, and content of dissolved organic material, humic acids, and presence of other organic contaminants. Test results indicated(Table 3) that microbiological parameters tested were negligible in the fresh water sample but higher in the formation sample. Total Heterotrophic bacteria was 10(cfu/ml) in the fresh water sample but 2.6 x 10² cfu/ml) in the formation sample. The Total coliforms and Fecal coliform wer 0 (cfu/100ml) respectively in the fresh water sample but 2 x 10² and 70 cfu/100mls in the formation sample. This could be attributed to contamination of the produced water sample with pollutants and microbes. As indicated in Table 1, 2 & 3, the dilution of the formation water with the fresh water sample resulted in reduction of concentrations of all the parameters at ambient and formation temperatures. This also validates previous study on this by Frost et al., 1998 and Brendehaug, 1992 who revealed that deep water discharges where there is rapid dilution may limit the potential for detrimental biological effects and for bioaccumulation of produced water constituents. Several studies have indicated that the acute toxicity of produced water to marine organisms is generally low, except possibly in the mixing zone, due to rapid dilution and biodegradation of the aromatic and phenol fractions. Actual impacts will depend on the biological effect of the produced water at the concentrations that exist over the exposure times found in the environment (Cline, 1998). Conclusion: Knowledge of the constituents of produced waters is needed for regulatory compliance and for selecting management/disposal options. The physical and chemical properties of produced water vary considerably depending on the geographical location of the field. Dilution effect due to fresh water is seen to result to reduction of concentrations of parameters that might be of environmental concerns. Therefore, in order to safely dispose formation water in compliance with environmental regulations, dilution with uncontaminated fresh water may be a way forward. REFERENCE
Copyright 2010- Journal of Applied Sciences and Environmental Management The following images related to this document are available:Photo images[ja10024t3.jpg] [ja10024t2.jpg] [ja10024t1.jpg] |
| |||||||||
