 |
| About Bioline | All Journals | Testimonials | Membership | News |
|
||||||
|
||||||
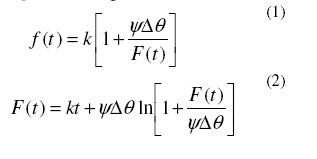
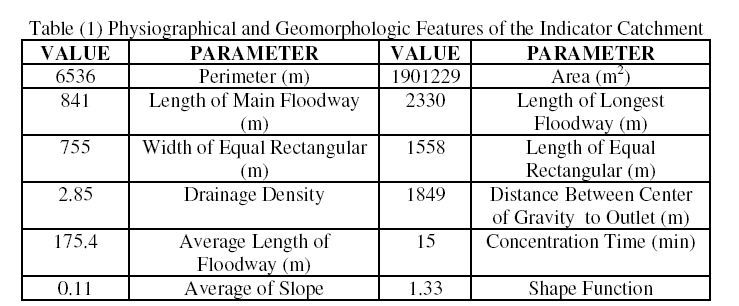
Journal of Applied Science & Environmental Management Vol. 15 No.1, March 2011, pp. 31 -36 Description of the G-A Infiltration Model Using Chu and Chow Viewpoints Mohammad Vaghefi; Hossein Rahideh *a Civil Engineering Department, Engineering Faculty, Persian Gulf University, Bushehr, Iran Code Number: ja11007 ABSTRACT The soil infiltration process is one of the hydrological cycle processes, attracting the attention of the hydrologists more than any other process. This process provides conversion of the raw rainfall into the excess rainfall; and ultimately the excess rainfall is used for describing the rainfall-runoff models. In most of the infiltration models, the rainfall is introduced to the model as steady and is converted into the excess rainfall. In this paper, through using Green-Ampt model and the double-ring tests results performed in seven pits in one of the indicator catchment south of the country, the model parameters have been estimated, and the excess rainfall resulting from the unsteady raw rainfall has been calculated using deterministic model and using two entirely different viewpoints. After making sure of the conditions and limitations of both viewpoints, the necessary grounds have been provided for distinguishing between time scale implemented in the model and time scale used for observation of the unsteady rainfall as well as their influence on such indexes as the runoff depth, the runoff peak and the cumulative infiltration. The bright point of this paper is consideration of the difference between the concepts of “Model Time Scale” and “Observation Time Scale”. Taking into notice of the change trend of infiltration, run-off and their change ratios against the changes of these two time scales, the researcher must suitably select between the “Model Time Scale” and “Observation Time Scale”of the rainfall and considers the optimum value of these time intervals in calculation of the excess rainfall and their influence on the run-off rainfall models. There are important parameters in surveying the unsteady rainfall conversion process into the runoff, regarding which acquiring more knowledge, for example about the influential factors and their changes will result in more accuracy in calculations and conclusions. One of these parameters is the soil infiltration in catchment areas. Generally in a catchment area the raw rainfall statistics -having been measured by hydrometer or a normal rain gauge- is accessible. This statistics, to be used in rainfall-runoff model, must be converted into excess rainfall. One of the conceptual models of infiltration is the Green- Ampt model whose equations have been defined by Green and Amp in 1911 based on the Darsi Rule and the continuity equation[Green and Ampt, 1911]. Numerous researchers through prolonged years have edited and modified it and have explored different ways of their application [Chow et al., 1988]. In 1978 and 1983, Chu used the said model for converting the raw rainfall into the excess rainfall in unsteady conditions and divided the infiltration into two stages of before ponding and during the surface ponding [Chu, 1978, 1983]. Esteves et al (2000) investigated the surface flows and the infiltration models in unsteady rainfall conditions and comparing between the numerical results and the observation values as well as the ponding phenomenon and detention storage effects on the runoff rate [Esteves et al.,2000]. Swartzendruber (2000) investigated the effect of the initial ponding time, hydraulic conductivity coefficient, and interaction of the infiltration model (G-A) and binomial infiltration equation, and introduced a suitable resolving method for binomial infiltration equation using the (G-A) model [Swartzendruber, 2000]. Serrano (2001) presented another method for resolving infiltration equation (G-A) and estimated it through using a series of mathematical equations and used it for calculation of the cumulative infiltration depth and the infiltration rate. He also made a comparison between this accurate solving method and the Lambert method [Serrano, 2001]. Hsu et al (2002) evaluated the three models of infiltration and its agreement with the Richard infiltration equation. They compared the three Philip, G-A, and Horton models with each other regarding several types of soil, and calculated the model parameters regarding these three models and specifically the (G-A) model. Among the calculated models, the (G-A) model parameters are in more consistency with the numerical analysis results, which is due to considering the ponding state of the model when the rainfall intensity is greater than the hydraulic conductivity coefficient [Hsu et al., 2002]. Chu and Marino (2005) An algorithm is proposed for determining the ponding condition, simulating infiltration into a layered soil profile of arbitrary initial water distributions under unsteady rainfall, and partitioning the rainfall input into infiltration and surface runoff. Comparisons of the developed model with other infiltration models (both modified Green–Ampt infiltration model and fully numerical model) and field measurements were conducted and good agreements were achieved [Chu and Marino, 2005]. Chen and Yang (2006) explains the direct physical effects of slope angle on infiltration and runoff generation by extending the Green-Ampt equation onto sloping surfaces. The result showed occurrence of non vertical rainfall could increase runoff with increasing slope angle when rainfall deflects a large angle to upslope [Chen and Yang, 2006]. Ma et al (2010) presented A modified Green–Ampt model to describe water infiltration through a 300-cm long and five-layered soil column. In the modified Green–Ampt model, a saturation coefficient was introduced to determine the water content and hydraulic conductivity of the wetted zone. For comparison, the infiltration process was also simulated by traditional Green–Ampt model and HYDRUS-1D code which was based on the Richards equation [Ma et al., 2010]. In this paper, considering the availability of the rainfall infiltration raw data of one of the south Iran’s areas named the Neyriz Palangan dry river indicator area, we deal with the analysis of the area data as well as the application and estimation of the (G-A) infiltration model parameters for the area under study. Finally, the raw rainfall of the area is converted to the excess rainfall. Also the influence of the parameters like the selective time interval in the model, rainfall observation time interval, hydraulic conductivity coefficient (K), combined parameter (ΨΔθ) and the influence rate of the detention storage volume on the runoff, peak runoff, the occurrence time of the peak runoff, and the cumulative infiltration rate is investigated. Two viewpoints have been paid attention to for calculation of the excess rain in unsteady rainfall conditions, and ultimately a comparison is made between these two viewpoints from the application conditions point of view (Chow, 1978 and Chu.1983). MATERIALS AND METHODSThe catchment area of the Palangan valley floodway is located in south Iran, 4 kilometers southeast of the city of Nayriz, between the longitudes of 54°23´ and 54° 25´ and latitudes of 29° 5´ and 29° 10´, and on the southern foot of the Zagros mountain chain. The catchment has a surface of 180 square kilometers and is considered as an arid or semi-arid land. For more precise calculations and also for hydrological studies, part of the region which was more similar to the main area in terms of its physiography, vegetation and geology was taken as the indicator catchment. Technical equipment, such as a rain guage and a cutthroat flume, was set up in the representative area to record the amount of rainfall and runoff and to obtain more accurate figures of the permeability of the soil. The aim was to predict the features of the main area through knowledge of the hydrological features and behaviors of the indicator catchment. Table 1 depicts the physiographical and geomorphologic features of the indicator catchment. Calculation of the Green-Ampt model parameters using the double-ring test results The main advantage and superiority of the Green-Ampt model compared with other infiltration models is using the physical properties of the soil in introducing the parameters and describing the mathematical equations of the model, so that the parameters’ values can be attained by physical measurement [Brakensiek and Onstad, 2000]. The equations ruling on this model are as follows:
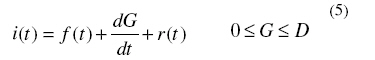
Δ θ = η - θ i (3) Where the f(t) is the infiltration velocity (cm/h), F(t) is the cumulative infiltration rate (cm), and (k) is hydraulic conductivity (cm/h), ŋ is the porosity degree, θi is the initial humidity, and Ψ is the soil vacuum in humid region (cm). Using the observation data and the equation (1), calculating the K and ΨΔθ coefficients is possible. RESULTS AND DISCUSSIONDifferent viewpoints about calculating the net rainfall A) Application of Green-Ampt model in calculating excess rainfall-Chu method: The basic equation of this method is as follows: P(t) = F(t) +G(t) + R(t) (4) In this equation, P is the cumulative rainfall rate (m), F is the cumulative infiltration rate (m), G is surface ponding (m), and R is the cumulative excess rainfall (m). Also the changing ratio of the equation (4) is calculated as follows:
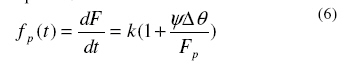
Where i is the rainfall intensity, f is the infiltration rate, and r is excess rainfall intensity (m). The variability range of G is from 0 to D, where D is detention storage of the catchment area. The infiltration rate is calculated from the following equation.
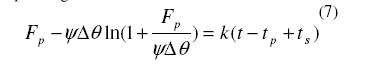
Fp the cumulative infiltration rate can be calculated in ponding conditions.
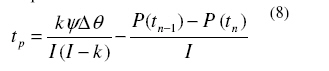
In equation (7), ts is a time transition due to cumulative infiltration effect before ponding. tp is the ponding time which is calculated from the following equation:
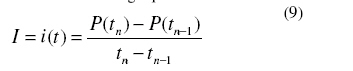
Where i is the rainfall intensity which is calculated from the following equation:
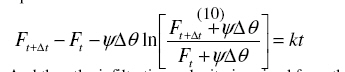
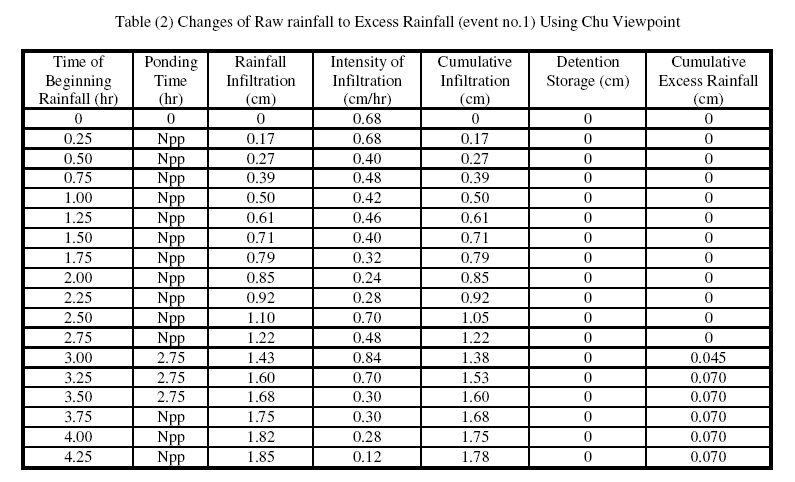
The results of converting the raw rainfall no.1 into the excess rainfall have been listed in table (2) (Chow, 1988 and Chu.1983). The said results have been gained through using the software supplied by Parsons and Carpena, 2000a and b). It must be mentioned that npp in the said table (2) is indicative of the non-ponding conditions. B) Application procedure of the Green-Ampt model in calculation of the excess rainfall: Chow et al converted the raw rainfall into the excess rainfall through a completely different attitude. Based on this attitude, with the start of the rain, the rainfall intensity will be different in different time intervals and the following three cases may occur [Chow, 1988]: Case 1: The infiltration rate is lesser than the rainfall intensity (ƒt ≤ it): pounding will occur during this period and the cumulative infiltration Ft+Δt at the end of this period is calculated from the following equation:
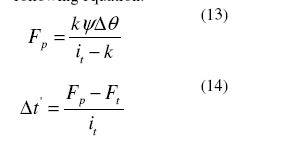
And then the infiltration velocity is gained from the equation (1) through replacing the Ψ value with Ft (Chow, 1988). Case 2: The infiltration rate is more than the rainfall intensity (ƒt > it): at the beginning of this period, pounding is not observed. Assuming that all the rain water is penetrated into the soil, the cumulative infiltration can be calculated from the following equation: F't +Δt = Ft + it Δt (11) If Ft in equation (1) is replaced by Ft +Δt, the infiltration velocity of ƒ't +Δt can be calculated. If theƒ' t +Δt value is more than the value it, that is the rainfall velocity (ƒ' t +Δt> it), the pounding phenomenon is not occurred during this period. Then we have: F t +Δt = F't +Δt Case 3: Forming water pounding during the period: If ƒ't +Δt is equal to or lesser than the rainfall intensity (ƒ't +Δt ≤ it), the pounding is calculated from the following equation:
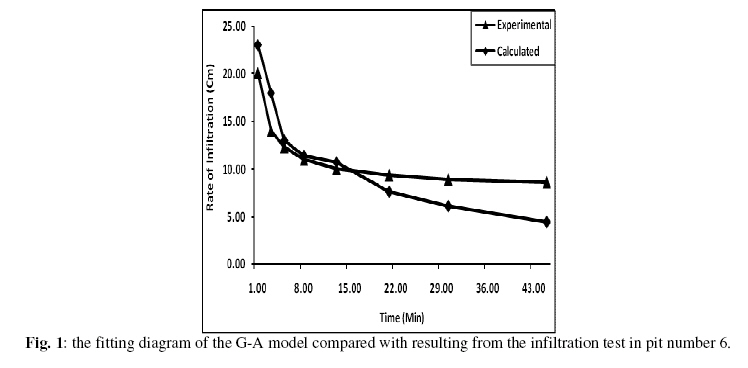
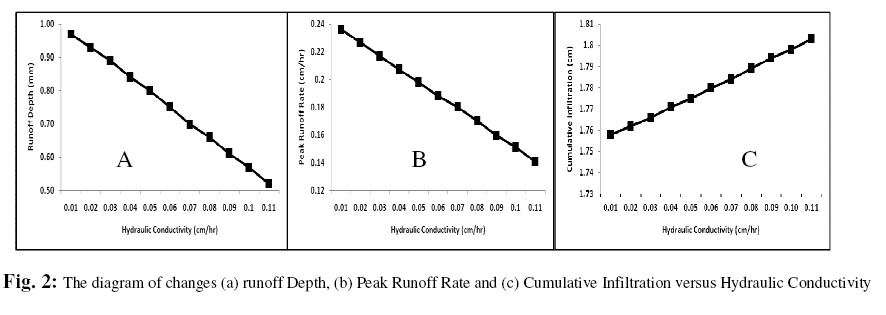
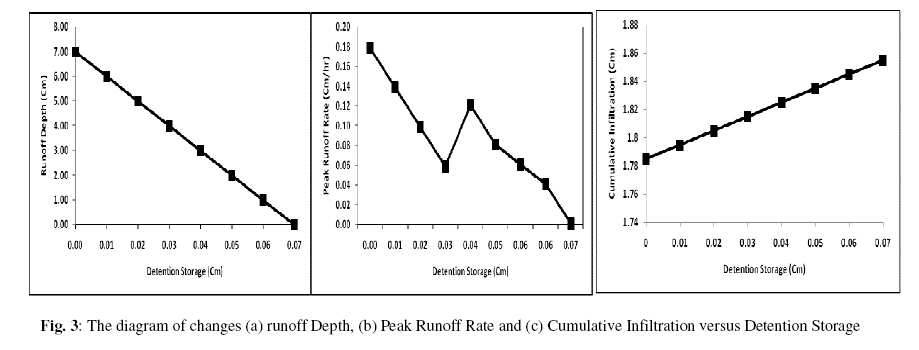
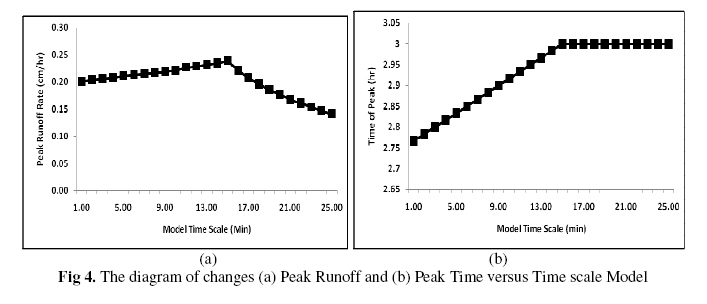
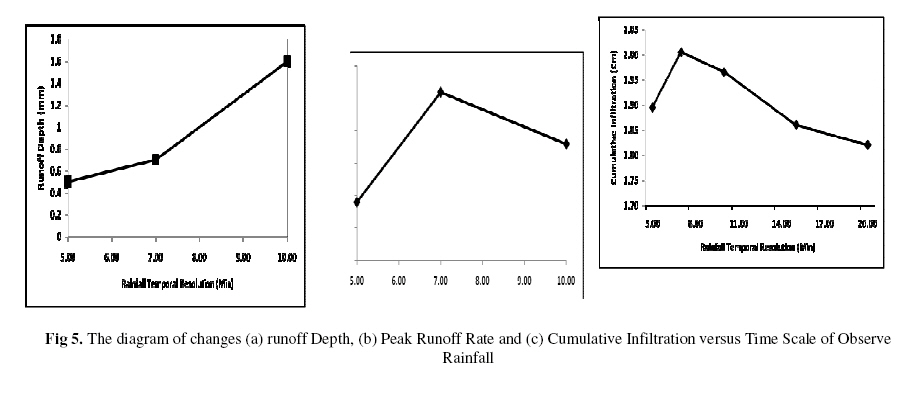
Throughout the recent equations, the Fp is the cumulative infiltration rate during the water pounding (cm), it is the rainfall intensity (cm/h), Δt is the given time interval (h). The cumulative infiltration is calculated by replacing Ft by Fp an also Δt by Δt-Δt′ in equation [Parsons and Carpena, 2000]. After calculations relating to the infiltration rate in different time intervals, the excess rainfall rate is gained from the difference between the cumulative infiltration rate in any time period and cumulative rainfall rate during that period [Chow, 1988 and Parsons and Carpena, 2000]. A computer application has been used for converting the raw rainfall into the excess rainfall considering the Chow attitude [Chu and Marino, 2005]. The results gained from using the computer application in a condition where the detention storage is assumed as equal to zero (D=0), are accurately consistent with the values mentioned in table (2). A) Comparison of the G-A model with the doublering tests results: The results gained from 5 times repeating of infiltration tests in seven infiltration pits using double-ring (35 tests in total) indicate that there is high conformity between the infiltration velocity using the G-A model and the infiltration tests. Fig. 1 shows the fitting diagram of the G-A model compared with resulting from the infiltration test in pit number 6. B) The effect of the Hydraulic conductivity (k): By increasing the hydraulic conductivity coefficient K, the runoff rate and the run-off peak is decreased as expected, while by increasing this coefficient, the cumulative infiltration of the catchment area is increased. Fig. 2 shows the above alterations. C) Detention storage effect of the area: By increasing the detention storage of the catchment area, the infiltration rate of the area is increased. Further, by increasing the detention storage of the catchment area, the run-off volume is also changed increasingly; but the peak runoff rate changes will be firstly decreasing, and then increasing. The results gained confirm the Esteves et al research and also the Hsu research findings [Esteves et al., 2000 and Hsu et al., 2002]. The way the detention storage affects the runoff depth, the run-off peak and the cumulative infiltration indexes has been represented in fig. 3. It′s worth mentioning here that converting the raw rainfall into excess rainfall has been carried out according to the Chow viewpoint without considering the detention storage. The results gained from applying the two viewpoints are comparable only under the conditions that D is equal to zero (D = 0). D) The model time scale effect: We mean “Δt” by the model time scale, which is the calculation basis for different processes. By increasing this index, the runoff peak will have a hydrographic change trend. Also by the increase of this time scale, the peak time changes of the hydrograph is firstly ascending and then constant. These changes are shown in fig. 4. E) The rainfall observation time scale effect: By rainfall observation time scale, we mean “rainfall reading time interval”. By increasing the time interval of the rainfall observation, the ascending runoff depth, the run-off peak values and cumulative infiltration show hydrographic change trend. These changes are shown in fig. 5. Conclusion: The investigations made throughout this research have produced the following results: As said before, the G-A infiltration model was surveyed considering two different viewpoints. In case the surface storage parameter of the area is considered as equal to zero, the calculated rainfall will be identical in both viewpoints. On the other hand, as any increase in the detention storage of the area increases the marsh time, it will cause the infiltration rate to increases and the run-off volume to decrease. Such changes were in agreement with the papers by authors like Esteves and Hsu. The bright point of this paper is consideration of the difference between the concepts of “Model Time Scale” and “Observation Time Scale”. Taking into notice of the change trend of infiltration, run-off and their change ratios against the changes of these two time scales, the researcher must suitably select between the “Model Time Scale” and “Observation Time Scale”of the rainfall and considers the optimum value of these time intervals in calculation of the excess rainfall and their influence on the run-off rainfall models. ACKNOWLEGEMENT The authors of this paper would like to thank the Office of Research at Persian Gulf University, Bushehr, for their financial support. REFERENCES
Copyright 2011- Journal of Applied Sciences and Environmental Management The following images related to this document are available:Photo images[ja11007t1.jpg] [ja11007f5.jpg] [ja11007f3.jpg] [ja11007t2.jpg] [ja11007f4.jpg] [ja11007f1.jpg] [ja11007f2.jpg] |
| |||||||||
