 |
| About Bioline | All Journals | Testimonials | Membership | News |
|
||||||
|
||||||
Journal of Applied Science & Environmental Management Vol. 15 No.1, March 2011, pp. 127-133 Evaluation of safety practices and performance in a brewery industry in Nigeria between 2000 –2007 1Oyawale, F A; 2*Odior, A O; 3Bolanle, R O 1Department of Industrial and Production Engineering, University of Ibadan, Nigeria. Code Number: ja11022 ABSTRACT Safety practices and performance in a brewery industry in Nigeria was evaluated
for a period of eight years between 2000 –2007 using the principles of
statistical expectation and efficiency index. The number of prevented accidents
and the corresponding values of lives and property saved were estimated annually
for the same period of eight years. The type of input resource, total number
of input resources, total number of prevented accidents by class, the unit
cost of each of the accident class, the cost of input resources, quantity of
each type of input resources and the targeted period were identified. The study
revealed that a total of 156 accidents were prevented in the period of the
safety programme which translates to an average of 19.45 per year. The safety
programme also saved lives and property worth An accident is an unplanned, unexpected, and undesigned (not purposefully caused) event which occurs suddenly thereby causing injury or loss, a decrease in value of the resources, or an increase in liabilities. Virtually, everyday and in every human endeavour, accidents have become a regular feature. It occurs in human endeavours such as transport, homes and manufacturing organisations among several others. They most often occur as a result of unsafe conditions of work (Adebiyi et al, 2007). These undesirable events may lead to human injury, damage to property, and loss of production hours, disease, permanent disability or death, (Duignan, 2003 and Burns, 2006). The consequences of accidents, in some cases, are not borne only by those directly involved but extended to relatives, friends, employers and government (Adebiyi, 2006). Despite all established standards and legislations on safety, with sophisticated devices developed and researches carried out (Adebiyi et al, 2005); yet, a perfectly safe condition for human and property is still an illusion. The desire for safety is on the increase in the manufacturing industry. Apart from the cost due to downtime, loss of wages and equipment, hospitalisation, the tragedy associated with personal injury, disability and fatality is enormous. As far as fatalities are concerned, industrial accidents take the third place after vehicle and homicide, (Duignan, 2003 and Adebiyi, 2006). In Nigeria, the manufacturing sector has stagnated, and its contribution to GDP and employment remain small, due to “weak safeguards against occupational and other hazards” (Adebiyi et al, 200). Although, this is one of the factors that is responsible for the stagnation, also abound are the problems of unstable electricity power supply, harsh government policy and lack of favourable enabling environment. In one of the reports of the Nigerian Institute of Safety Professionals (NISP) over 11,000 people die from onthe-job accidents each year and a worker is injured every 18 seconds in chemical industries in Nigeria. Adebiyi (2006) reported that there is higher incidence of fatal work-related injuries in developing world than in the developed ones. The problem of appropriately quantifying human life is the major problem of costing accident and no generally accepted model has been developed for this. There is need to provide useful mathematical tool to assist in taking judicious decisions concerning safety in our industries. This study investigates the performance of safety programme of a brewery firm for a period of eight years: from 2000-2007. Specifically, the number of prevented accidents, the corresponding lives and property saved and the way resources were used to achieve such safety were investigated. MATERIAL AND METHODSafety programme performance can be examined by considering the losses and costs associated with accidents and safety programme. The efficiency of a safety programme is related to how much of these losses are reduced or eliminated. The inputs are the resources used to run such a programme. The principles of statistical expectation and efficiency function can be used to analyse the performance of safety programme. It is concerned with efficient and effective utilisation of budgeted resources to run a safety programme. The Efficiency Index can be defined as:
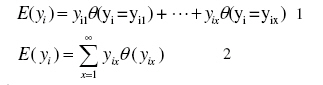
This model is one of the ways to estimate the amount of money gained/lost in operating a safety programme, how effectively the resources budgeted have been used to achieve the targeted safety level and to budget for the future. It also gives a scientific background upon which decision could be made. For this study the following were identified: (1) type of input resource (personnel, information, equipment etc), (2) total number of input resources, (3) the total number of prevented accident by class, (4) the unit cost of each of the accidents class, (5) the cost of input resources and (6) quantity of each type of input resources. It is also important to select a targeted period which is the standard period. The output of a safety programme in a manufacturing company is viewed from reduction in the following: number of accidents that occurred, accident frequency rate, manhour lost, severity rate etc. If a safety programme is effective and efficient, there will be a reduction in the number of accidents obtained within the observed period. The quantity of the output which is the number of prevented accidents of particular class i observed in the period x will be high, while its associated monetary value can also determined. Problem Description and Methodology Safety is actions, or steps timely taken to avoid occurrence of harmful effect to human or equipment (Adebiyi et al, 2005). To this end, any industrial establishment who ignores or pays little attention to safety can easily go out of business, or better still lose significant trade. All accidents cause losses to the employer, employee, customers, the company and the society. Losses caused by industrial accidents are of two types: material and personnel losses. Though various estimates have been made for the cost of industrial accidents in strictly monetary terms, but there are still some hidden accident costs (Charles-Owaba. and Adebiyi, 2001). The problem of appropriately quantifying human life is the major problem of costing accident and as such no yet generally accepted model for this. Thus, it depends on the country and circumstances. There is need to provide useful mathematical tool to assist in taking judicious decisions. This study investigates the performance of safety programme of a brewery firm from 2000-2007. Specifically, the number of prevented accidents, the corresponding lives and property saved and the way resources were used to achieve the safety were investigated. The expected number of accident class i is estimated from safety records before the use of the safety programme using mathematical expectation. Thus the expected number of accident is given by:
Where, E(yi) : Expected number of accident class i before advent of safety programme. θ (yi = yix) : Probability of yi occurring in period x. yi = Number of accidents class i in period x recorded in the period observed.
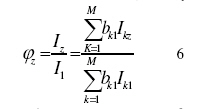
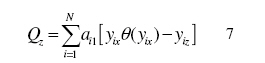
fi: frequency of accident class i that occurred in period before safety programme. n : total sum of accident class i frequency that occurred over the period observed before safety programme. In examining the performance of the safety programme, let z ≠ x be a safety programme period of the same duration as x and yiz be the observed number of accidents. If there were no safety programme, then the expected number of accidents is E(yix). But with the safety programme, yiz was observed. The number of accidents prevented by the programme (Aiz), is estimated with this expression: Aiz = E(yi) -yiz (4 ) With ai1 as the unit cost of accident class i, then the value of prevented accidents is given by: viz = ai1 [yix θ(yix) -yiz] (5) For a firm, the unit cost of accident type ai1 , can be estimated from the following components: cost of man-hour lost, legal fee, manpower replacement cost, medical bills, equipment / material replacement cost, compensation paid etc. However, Ige (1999) identified three classes of accidents in manufacturing industries and estimated the cost of each class of accident as: fatal The resources input used are: Man-hours spent, Information disseminated, Equipment-hours used and other items used The resources input index in period z; which is also the measure of how well budget was maintained independent of achievement is given by
Where: bk1 = the unit value or cost of resource k Ikz = the amount of resource k expended during safety programme in period z Ik1 = the amount targeted or budgeted. M = the total number of input k φz = Resource index in period z. The achievement index of this programme for period z, is
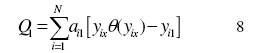
For planning and controlling safety programme operations using basic principles, a target value of present accidents is stated as follows:
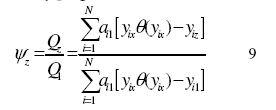
With Equation 8 as targeted and Equation 7 as the actual safety programme achievement, we then have:
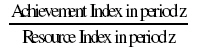
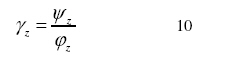
Where: ψz = Achievement index in period z. Generally, an industrial system may be simple or complex; this depends on the number of inputs and outputs within such a system. In this study, there are more than one input and output and thus, a complex industrial system. Efficiency index is obtained by dividing Equation 9 by Equation 6
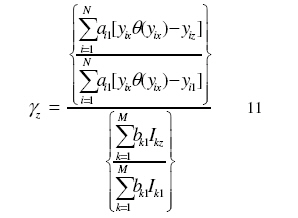
This implies that
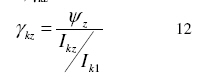
Where: γz = Efficiency index in period z. ψz = Achievement index in period z. φz = Resource index in period z. The efficiency index relative to each of the input resource k, γkz
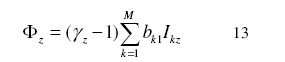
According to Charles-Owaba et al (2001), the equivalent naira gained/lost can be formulated for all the resources thus:
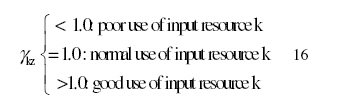
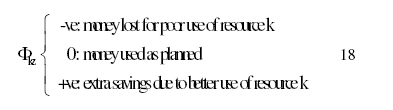
And for each Φ input resource k in period z as: Φkz = (γkz-1) bk 1Ikz 14 The efficiency index and monetary value can be interpreted as thus:
and
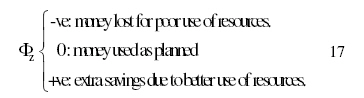
For the monetary value we have,
and
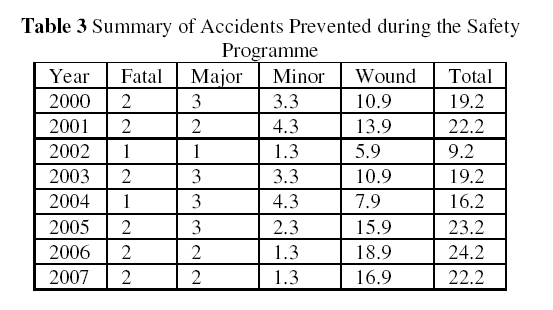
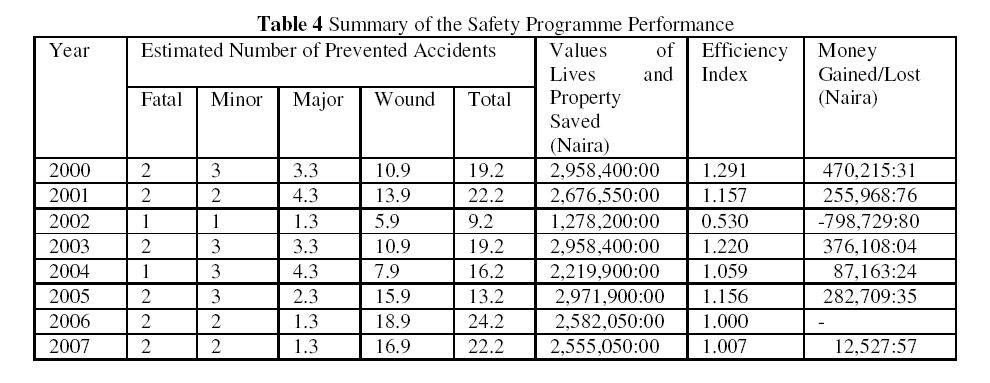
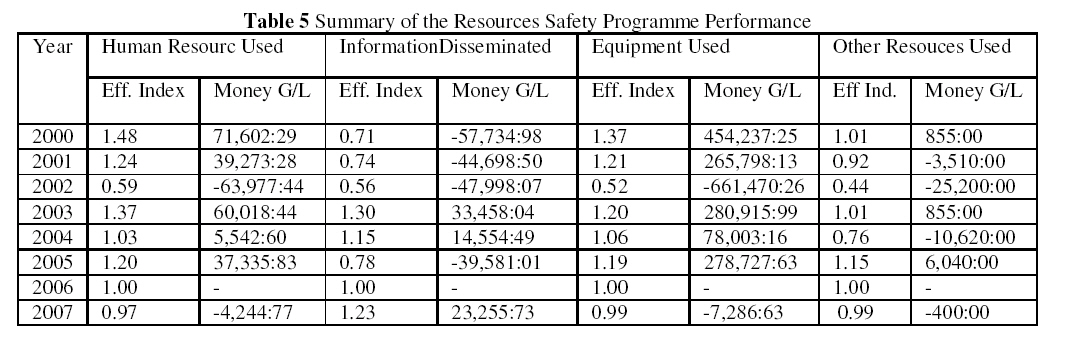
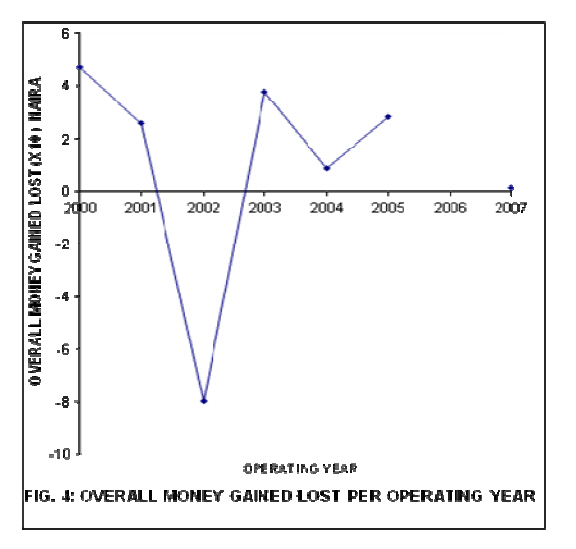
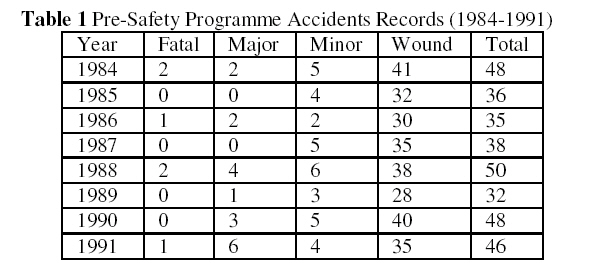
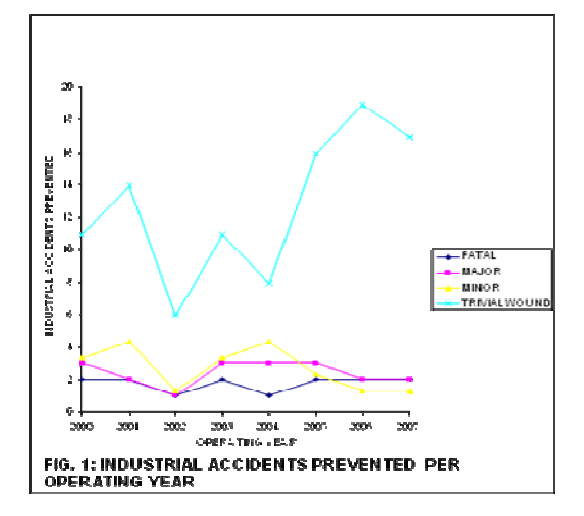
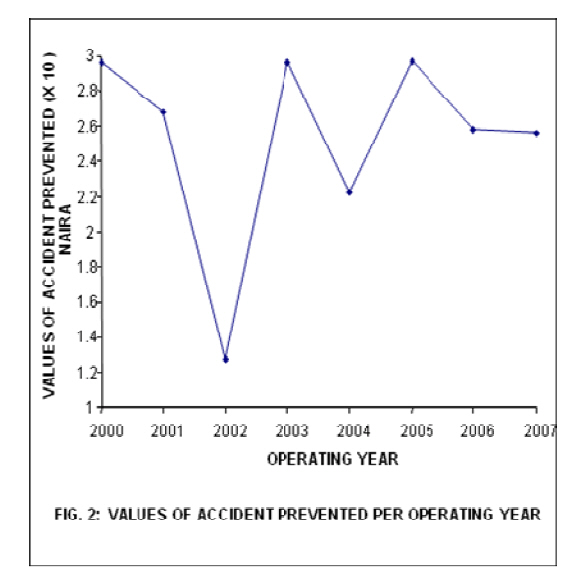
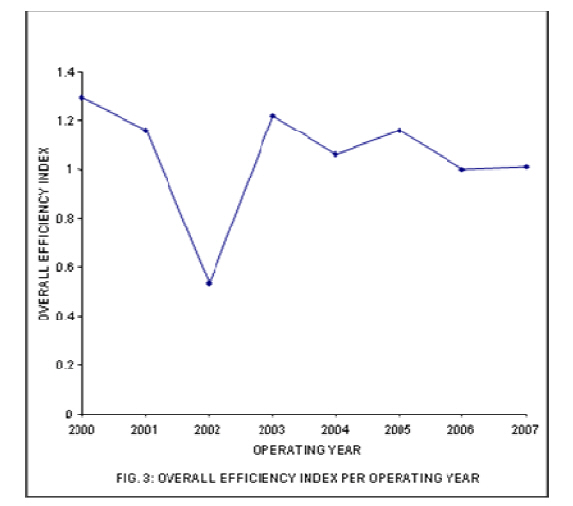
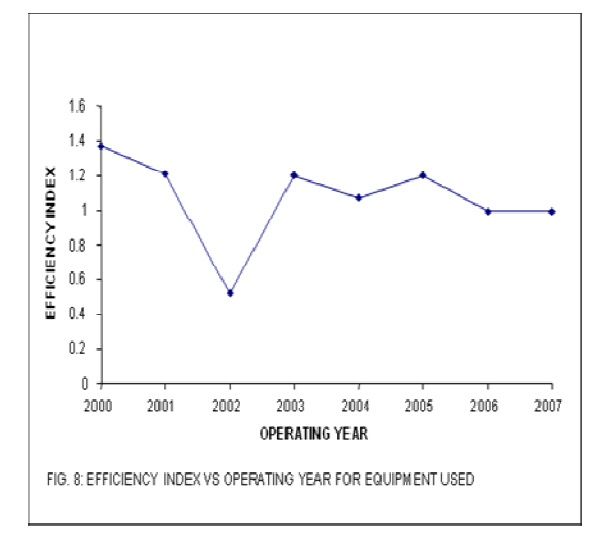
In applying the model, data were collected from the brewery industry on the (i) Quantities of input for both before and during safety programme. The outputs computation of the safety programme, which includes the number of accidents prevented, was done, using equation 4, and is presented in Table 3. While equation 5 was used in conjunction with Ige’s cost estimation earlier stated to obtain the monetary value of the accidents prevented and the results are presented in Table 4. For this study Year 2006 was chosen as The Standard Period or Targeted Period. Equation 6 was used to determine the Resources (Effort) Index during the safety programme operation. Equation 9 was used to determine the Achievement Index of the programme, while equation 11 was used to determine the Overall Efficiency Index of the safety programme. Equation 13 was used to determine its equivalent Money Gained or Lost and results are presented in Table 4. The efficiency index due to each of the input resources were determined using equation 12 and equation 14 for its corresponding money gained or lost and results are presented in Table 5. RESULTS AND DISCUSSIONS The expected number of accidents in each class is: 2.0, 3.0, 4.3 and 34.9 for
Fatal, Major, Minor and Wounds respectively. The computation of efficiency
indices due to use of all the input resources show that all the resources are
well utilised when compared with the Standard Period whose efficiency index
is 1.000, except for year 2002, whose index was below 1.000. From Figure
4.3,
the highest efficiency was attained in year 2000. Table
1 shows that year 2006
has the highest number of accident prevented. From Table
4, it is shown that
the amount of money spent on the programme ( The overall efficiency indices
for the 8-year period ( 2000-2007) showed that the safety programme was effective,
even though, the total annual efficiency index was not always increasing
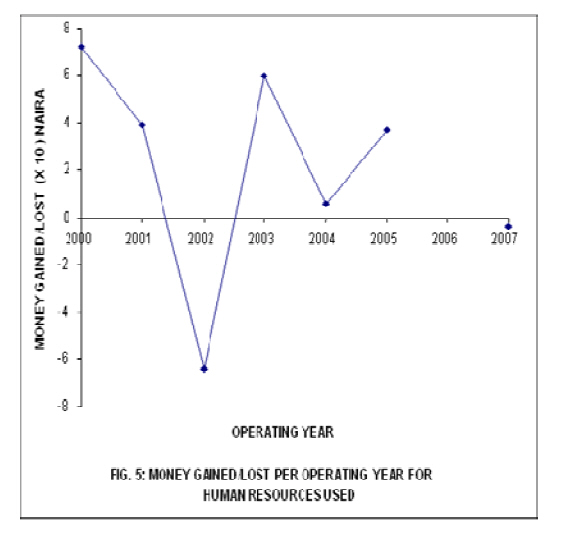
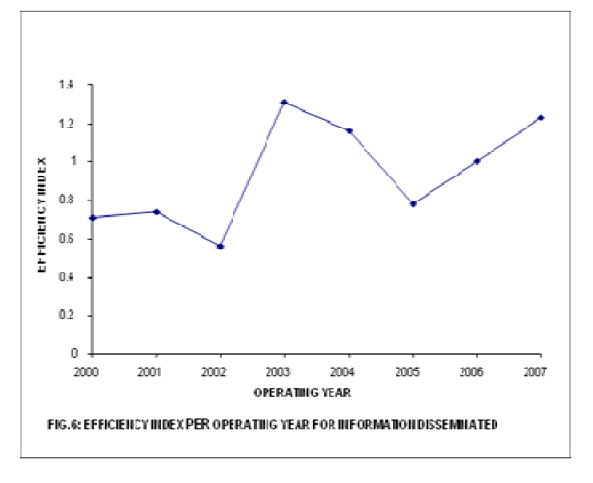
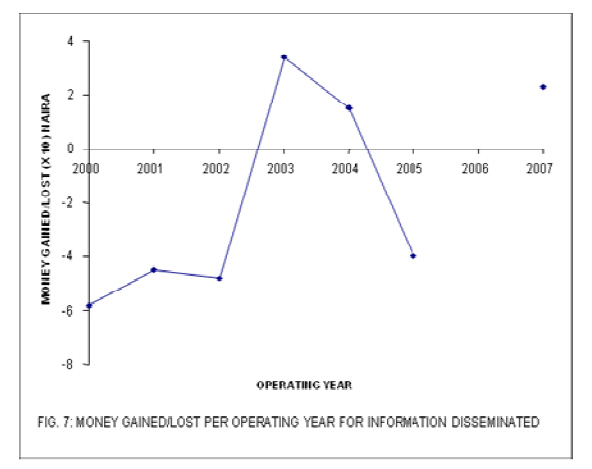
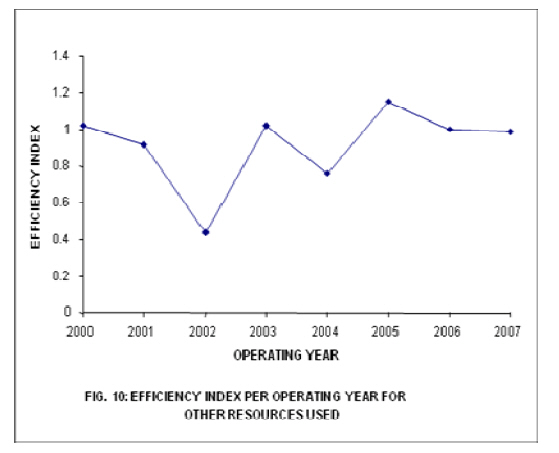
and it is particularly low in 2002 (0.530). For each of the input resources
employed
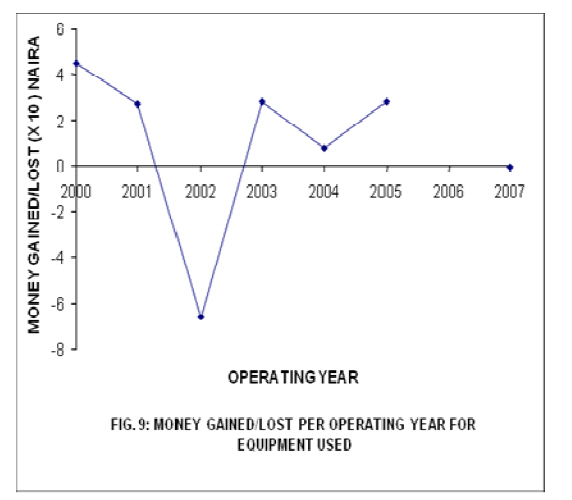
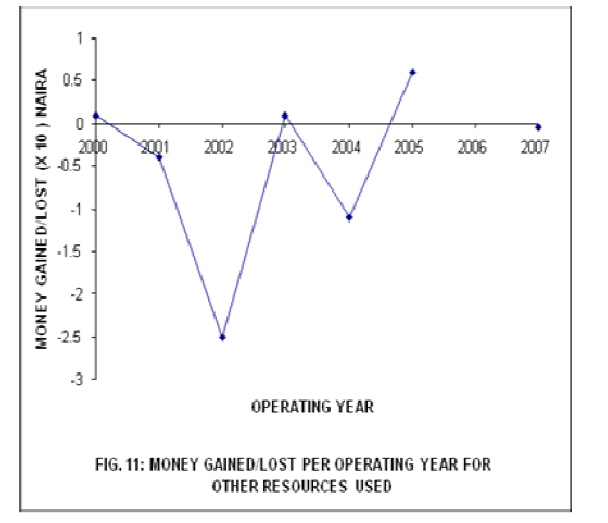
in operating the safety programme, varying amount of money is saved for each
year, and the highest money saved is obtained from the use of equipment ( Figures 1, 2, 3, 4, 5, 6, 7, 8, 9, 10 & 11 The safety programme as indicated in Table
4 shows that a total of 24.2 accidents
were prevented in the Best Period (Standard Period) of the programme (2006),
and the highest money saved due to the overall use of all resources (inputs)
is CONCLUSION This study used the principles of statistical expectation and efficiency index to analyse the performance of safety programme in a brewery industry based in Ibadan, Oyo State of Nigeria. The number of prevented accidents and the corresponding values of lives and properties saved were estimated and results obtained indicate that the programme is efficient, though there is still a need for more improvement, particularly in the use of resources. The firm, through its workers can improve on the performance of the safety programme, by effectively utilizing the input resources provided for them, so as to increase the efficiency of the model. This model is recommended for use for other manufacturing firms, so as to help in setting feasible benchmark for such manufacturing industries. REFERENCES
Copyright 2011- Journal of Applied Sciences and Environmental Management The following images related to this document are available:Photo images[ja11022f3.jpg] [ja11022t2.jpg] [ja11022t4.jpg] [ja11022f1.jpg] [ja11022f11.jpg] [ja11022f4.jpg] [ja11022t3.jpg] [ja11022f2.jpg] [ja11022t1.jpg] [ja11022f7.jpg] [ja11022f8.jpg] [ja11022f6.jpg] [ja11022f10.jpg] [ja11022t5.jpg] [ja11022f9.jpg] [ja11022f5.jpg] |
| |||||||||


