 |
| About Bioline | All Journals | Testimonials | Membership | News |
|
||||||
|
||||||
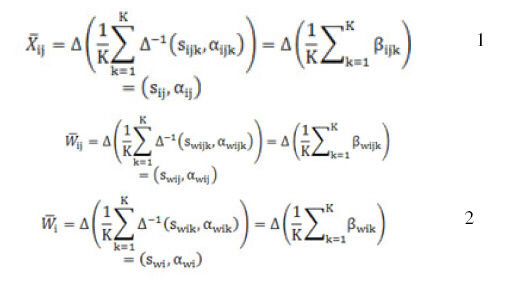
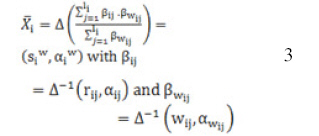
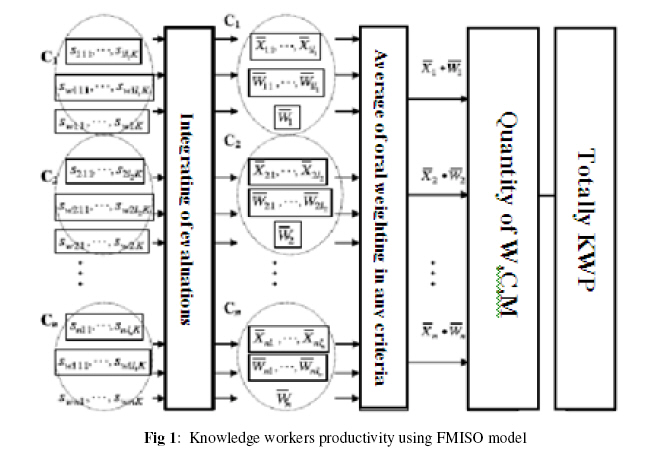
Model Validation and Verification of Data Mining from the Knowledge Workers Productivity Approach Asadallah Najafi Islamic Azad University, Zanjan Branch, Moallem Ave., Zanjan, Iran, Code Number: ja11027 ABSTRACT Improving validation and verification (vv) has been one of the most important tasks of the century. However, we have few measures or management interventions to make such improvement possible, and it is difficult to identify patterns that should be followed by developers because systems and processes in an organization are often regarded as a death blow to creativity. To improve vv, it first must be measured, and then its future should be defined. In this paper, we seek to present a hybrid method for Model Validation and Verification of Data Mining from the Knowledge Workers Productivity Approach. It is hoped that this paper will help managers to implement different corresponding measures. A case study is presented where this model measure and validates at the Alupan company. There are two viewpoints regarding knowledge workers’ productivity model, that is, the public and the specialized. According to the specialized viewpoint, several models (including those of staff long-term productivity and Fabricant general productivity) are proposed in which the most common and applicable model is defined as the ratio of output to input (Devenport, 2002). This model generally states the numerical value of knowledge workers’ productivity. According to the public viewpoint, various models (including those of Smith, Harris &Goldsmith, Crest, Victor, Room and FMISO) have been proposed that offer effective reasons and elements in productivity (Ramirez, 2006). The specialized view considers specialist knowledge workers such as engineers, doctors, managers, researchers and so on, while the public view considers all knowledge workers. Since organizations today employ knowledge workers in different fields, a specialized view would be ineffective (Najafi, 2010). Specialized knowledge workers interact with both within their group and outside of their group, thus rendering the public view and its existent models an effective tool for analysing the issue (Najafi and Afrazeh, 2010). Simulation models are increasingly being used in problem solving and in decision making. The developers and users of these models, the decision makers using information derived from the results of the models, and people affected by decisions based on such models are all rightly concerned with whether a model and its results are correct. This concern is addressed through model verification and validation. Model validation is usually defined to mean “substantiation that a computerized model within its domain of applicability possesses a satisfactory range of accuracy consistent with the intended application of the model” (Schlesinger et al., 1979) and is the definition used here. Model verification is often defined as “ensuring that the computer program of the computerized model and its implementation are correct,” and is the definition adopted here. A model sometimes becomes accredited through model accreditation. Model accreditation determines if a model satisfies specified model accreditation criteria according to a specified process. A related topic is model credibility, which is concerned with sufficiently developing the confidence that (potential) users have in a model and in the information derived from the model that they are willing to use the model and the derived information. A model should be developed for a specific purpose (or application) and its validity determined with respect to that purpose. If the purpose of a model is to answer a variety of questions, the validity of the model needs to be determined with respect to each question. Several sets of experimental conditions are usually required to define the domain of a model’s intended applicability. A model may be valid for one set of experimental conditions and invalid in another. A model is considered valid for a set of experimental conditions if its accuracy is within its acceptable range, which is the amount of accuracy required for the model’s intended purpose. This generally requires that the model’s output variables of interest (i.e., the model variables used in answering the questions that the model is being developed to answer) are identified and that their required amount of accuracy be specified. The amount of accuracy required should be specified prior to starting the development of the model or very early in the model development process. If the variables of interest are random variables, then properties and functions of the random variables such as means and variances are usually what is of primary interest and are what is used in determining model validity. Several versions of a model are usually developed prior to obtaining a satisfactory valid model. The substantiation that a model is valid, i.e., model verification and validation, is generally considered to be a process and is usually part of the model development process. It is often too costly and time consuming to determine that a model is absolutely valid over the complete domain of its intended applicability. Instead, tests and evaluations are conducted until sufficient confidence is obtained that a model can be considered valid for its intended application (Sargent, 1984; Shannon, 1975). In this paper, we seek to present a hybrid method for Model Validation and Verification of Data Mining from the Knowledge Workers Productivity Approach. MATERIALS AND METHODS Model validation: Three basic approaches are used in deciding whether a simulation model is valid or invalid. Each of the approaches requires the model development team to conduct verification and validation as part of the model development process, which is discussed below. The most common approach is for the development team to make the decision as to whether the model is valid. This is a subjective decision based on the results of the various tests and evaluations conducted as part of the model development process. Another approach, often called “independent verification and validation” (IV&V), uses a third (independent) party to decide whether the model is valid. The third party is independent of both the model development team and the model sponsor/user(s). After the model is developed, the third party conducts an evaluation to determine its validity. Based upon this validation, the third party makes a subjective decision on the validity of the model. The last approach for determining whether a model is valid is to use a scoring model (Balci, 1989; Gass, 1979; Gass and Joel, 1987). The last approach is selected for this research. Model verification: Computerized model verification ensures that the computer programming and implementation of the conceptual model are correct. To help ensure that a correct computer program is obtained, program design and development procedures found in the field of software engineering should be used in developing and implementing the computer program. These include object-oriented design, top-down design, structured programming, and program modularity. A separate program module or object should be used for each sub model, the overall model, and for each simulation function when using general purpose higher-order languages and where possible when using simulation languages. One should be aware that the type of computer language used affects the probability of having a correct program. The use of a special-purpose simulation language generally will result in having fewer errors than if a general-purpose simulation language is used, and using a general purpose simulation language will generally result in having fewer errors than if a general purpose higher order language is used. Not only does the use of simulation languages increase the probability of having a correct program, programming time is usually reduced significantly. There are two basic approaches to testing—static and dynamic testing (analysis) (Fairley, 1976). In static testing the computer program of the computerized model is analyzed to determine if it is correct by using such techniques as correctness proofs, structured walk-through, and examining the structure properties of the program. The commonly used structured walk-through technique consists of each program developer explaining his or her computer program code statement-by-statement to other members of the modeling team until all are convinced it is correct. In dynamic testing the computerized model is executed under different conditions and the resulting values are used to determine if the computer program and its implementations are correct. This includes both the values obtained during the program execution and the final values obtained. There are three different strategies used in dynamic testing: (1) bottom-up testing, which means, e.g., testing the sub models first and then the overall model; (2) top-down testing, which means, e.g., testing the overall model first using programming stubs (sets of data) for each of the sub models and then testing the sub models; and (3) mixed testing, which uses a combination of bottom-up and top-down testing (Fairly, 1976). The techniques commonly used in dynamic testing are traces, investigations of input-output relations using different validation techniques, internal consistency checks, and reprogramming critical components to determine if the same results are obtained, and it is selected for this research. Data mining: In the data mining field, people have no doubt that high level information (or knowledge) can be extracted from the database through the use of algorithms. However, a one-shot knowledge deduction is based on the assumption that the model developer knows the structure of knowledge to be deducted. This assumption may not be invalid in general. Hence, a general proposition for data mining is that, without human-computer interaction. Any knowledge discovery algorithm (or program) will fail to meet the needs from a data miner who has a novel goal (Wang & Wang, 2002). Recently, interactive visual data mining techniques have opened new avenues in the data mining field (Chen, Zhu and Chen, 2001; Shneiderman, 2002; Han, Hu and Cercone, 2003; de Oliveira and Levkowitz, 2003; Yang, 2003). Interactive visual data mining differs from traditional data mining, standalone knowledge deduction algorithms, and one-way data visualization in many ways. Briefly, interactive visual data mining is human centered, and is implemented through knowledge discovery loops coupled with humancomputer interaction and visual representations. Interactive visual data mining attempts to extract unsuspected and potentially useful patterns from the data for the data miners with novel goals, rather than to use the data to derive certain information based on a priori human knowledge structure. Major components of interactive visual data mining and their functions that make data mining more effective are the current research theme in this field. Wang and Wang (2002) have developed a model of interactive visual data mining for human-computer collaboration knowledge discovery. According to this model, an interactive visual data mining system has three components on the computer side, besides the database: data visualization instrument, data and model assembly, and human-computer interface. Knowledge Workers’ Productivity (KWP) Using the FMISO Model: The FMISO method is calculable for the intangible and qualitative factors as well as for the systems having several inputs and 1 output, in which the output is a function of the outputs. The steps of the fuzzy method with several fuzzy inputsone outputs have been summarized below: Step 1: Every expert from the sample population uses the oral significance for showing the weight of each criterion; also they use oral rank variables for the knowledge workers’ productivity considering each criterion. Step 2: the fuzzy estimation values obtained from K number of the experts are integrated as follows:
The Sijk shows the fuzzy ranking of the item j, considering the Ci criterion relating to the Km th expert, The Swijk shows the fuzzy significance of the item jm th, considering the Ci criterion relating to the Kmth expert. Figure 1 shows the calculation process of the productivity based on several inputs and one output.
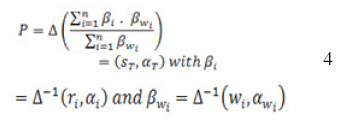
Step 3: the following equation is used for gaining the fuzzy ranking of the Ci criterion.
Step 4: The sum total of the knowledge workers’ productivity ranking (P) is calculated. The oral item ST can be used for representation of the knowledge workers’ productivity ranking.
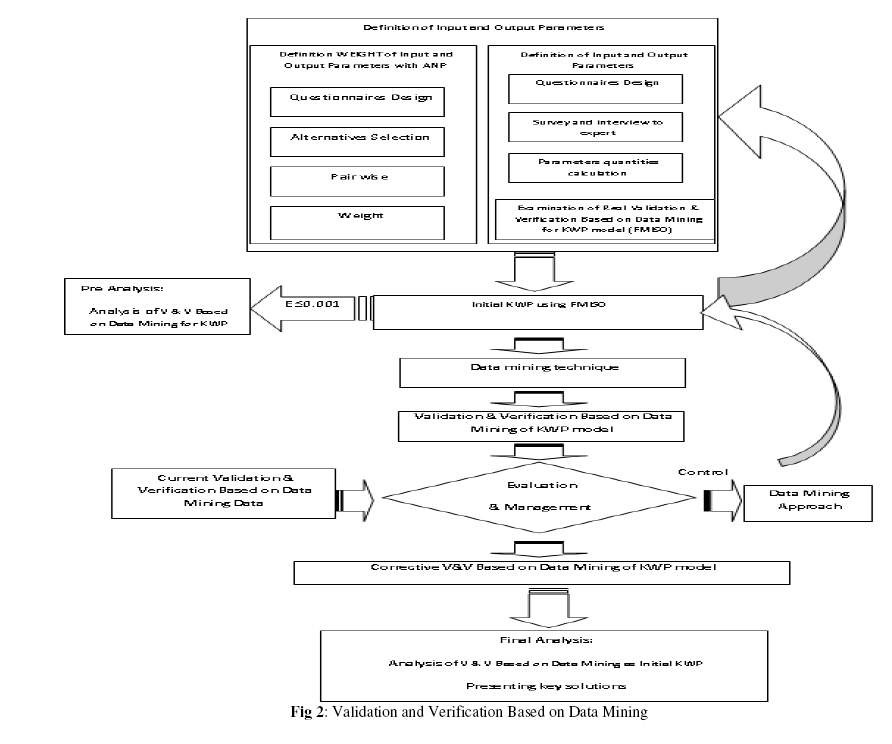
Validation & verification of KWP based on Data mining Approach: In this section, we will try to define method for V&V of KWP model. The method will be presented in the form of the V&V based on Data Mining for KWP Model, which can cover the research objectives. The V&V based on Data Mining is able to simultaneously applicable for V&V s’ of models. The Validation & Verification Based on Data Mining is developed to help managers keep track of V&V based on Data Mining for KWP Model status in the life cycle of a V&V based on Data Mining development. The Validation & Verification Based on Data Mining helps managers discern the true status of V&V of models quickly. V&V based on Data Mining for KWP Model gives a manager a quick current view of V&V based on Data Mining, which will be used to predict the optimum or future view of V&V based on Data Mining for KWP Model: it can also help perform a gap analysis between current and future views.The V&V based on Data Mining for KWP Model is shown in Figure 2. The research method we present here is based on the algorithm described. The current research is descriptive and of an exploratory type. In exploratory research, the researchers use interviews or questionnaires to discover the target people’s ideas, thoughts, preferences, and understandings. Information regarding the essence, conditions, and the relationship between current events and conditions is gathered. In our research, a questionnaire was used to measure the V&V of models. Data collection is easily conducted through library research and questionnaires. The target population is the staff of the Alupan Company, which works in the field of aluminum manufacturing. In this organization, 40 people were chosen for the sample and presented with the questionnaire. The sampling method of this research is simple random sampling, with the questionnaire being the data collection instrument. Cronbach’s alpha was used to calculate the questionnaire’s reliability and validity. For analyzing the present research’s information, both descriptive and inferential statistics were applied. What follows is an explanation of a practical implementation of the proposed method. RESULTS AND DISCUSSIONWe selected Alupan Company as the site for conducting the research. This company established its large factory for profile production and aluminium door and window manufacturing in Alborz Industrial Town, Qazvin. The facility is on a 50,000 square meter site, 25,000 square meters of which are devoted to production halls. Having more than 30 years of experience, the company is currently one of the largest producers in the Middle East of industrial profile sections, aluminium doors, windows; it uses silver and color anodizing methods and electrostatic powder coating. Its products are mostly exported to European countries like Germany, Holland, and Spain. It has been awarded two international management quality prizes and has been the member of the International Chamber of Commerce. Alupan is the only Iranian company that produces frameless curtains under the license of Italian-accredited companies like Aluk and Lilli, and is allowed to use the brand names of these companies. It is a private company. We distributed 40 questionnaires among employees—23 to men and the rest to women. In terms of education, 10 percent of the staff had a postgraduate degree, 67.5% had a bachelor’s degree, and 22.5% held only a high school diploma. 77.5% had fewer than 30 years of experience, and 87.5% had fewer than 10. 100% of the distributed questionnaires returned to us, and all 40 questionnaires were used for analysis. The combinational method was tested in Alupan Company (which is active in the field of aluminum manufacturing). Using Cronbach’s alpha (with a value is higher than 98.3%), the method’s validation was calculated and confirmed both by science-based and by survey-based methods, with 97% of experts and 98% of managing directors and managers agreeing. 40 people were directly involved in this research. The organization’s research findings indicated the V&V s’ high V&V of models level. Incentives, organizational atmosphere, and problem solving capability are the most important factors that have a fundamental influence on V&V of models. Among these factors, a suitable organizational atmosphere in which responsibility is awarded to V&V s was found to be the scenario that most increased V&V of models. Corresponding to the data and statistical analyses, the error squares’ average for the function described here reached its minimum, which is 0.0005, with R2 at 96.49 and Cronbach’s alpha at 98.3%; this indicates the model’s validity. Furthermore, a survey was conducted based on Delphi, which confirmed 97.28% of the abovementioned values. It is worth mentioning that the questionnaire’s validity is calculated using questionnaire, and the results showed 97.784% of questionnaire validation. To calculate its reliability, Cronbach’s alpha was used, with a result of 98.3%. These results showed the reliability and validity of the practical research. According this approach, it measures KWP in Alupan Co., such as bellows: The total sum of the knowledge workers’ productivity as per the above calculations is equal to 62.5% which is at “mean” fuzzy number level. The productivity of the knowledge workers in Programming Department is high, in Engineering Department is high, and in Execution Department is medium. The Knowledge Workers in six stages of the knowledge management is medium. Considering the above said facts, it can be perceived that the Knowledge Workers is at a suitable level but needs improvement. To improve the productivity we must know about the productivity trend of the knowledge workers. To implement the productivity improvement program, the knowledge workers’ productivity is therefore predicted for the future periods. According to the analysed data we have: The average value of the knowledge workers’ productivity in the past and future 12 month is equal to 46.3% and 50.99% respectively. To compensate this decrease and to increase the productivity during the next 12 month, the optimized scenario was executed and now 6 month past the implementation of the optimized scenario, the average value of the knowledge workers’ productivity has grown to the level of 56%. This indicates that through timely predicting the knowledge workers’ productivity and identifying the key factors influential on it, not only overcoming the effects of the decrease in the productivity would be possible, but also considerable increasing the knowledge workers’ productivity will not be out of the reach. This result is confirmable. We compared the results obtained from the proposed method with the results obtained from other methods. In conclusion, In this paper, we explored the possibility of building a hybrid method for validation and verification. The Calculation of V & V Based on Data Mining for KWP model or hybrid method can use in organizations. V & V Based on Data Mining for KWP model plays an important role in re-evaluating initial validation and verification. Data mining analysis of the data from our research shows the strength of the method strength. In future, this research will be extended to improve validation and verification in the following aspects: Supporting the time series analysis with a fuzzy nonlinear model and fuzzy weighting vectors. ACKNOWLEDGEMENTS This work was supported by a grant from Islamic Azad University, Zanjan Branch, and Zanjan, Iran. REFERENCES
Copyright 2011- Journal of Applied Sciences and Environmental Management The following images related to this document are available:Photo images[ja11027f2.jpg] [ja11027f1.jpg] [ja11027t1.jpg] |
| |||||||||
