 |
| About Bioline | All Journals | Testimonials | Membership | News |
|
||||||
|
||||||
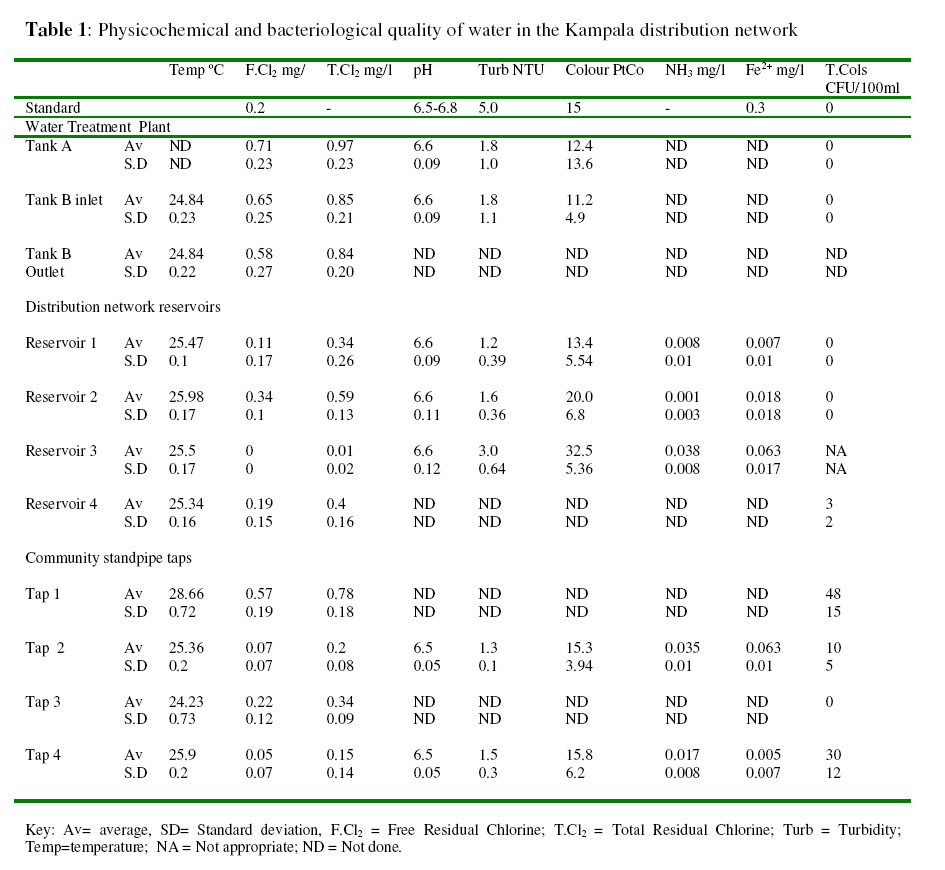
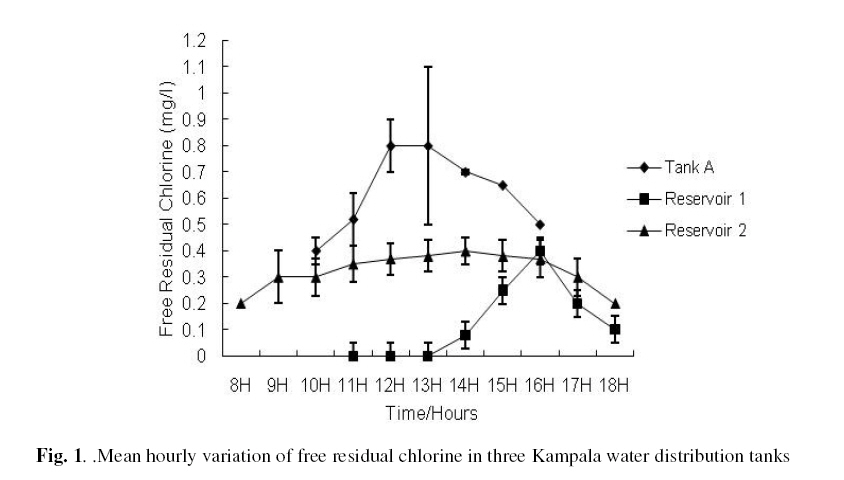
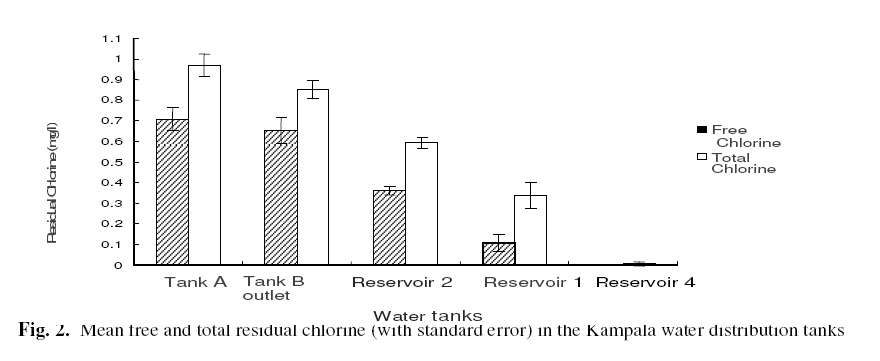
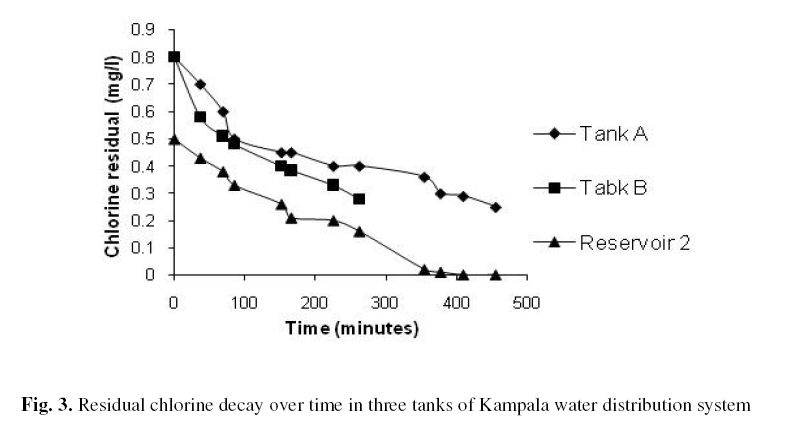
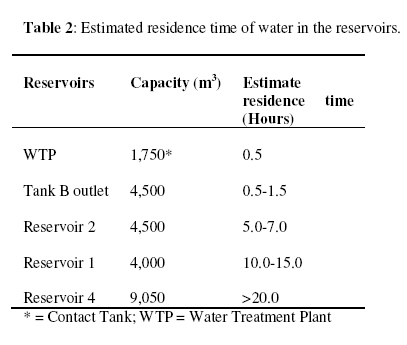
Journal of Applied Science & Environmental Management Vol. 15 No.1, March 2011, pp. 167-173 Monitoring Residual Chlorine Decay and Coliform Contamination in Water Distribution Network of Kampala, Uganda Julius Ecurua, James Okot-Okumub,* ,Tom O OkurutcaUganda National Council for Science and Technology P O Box 6884 Kampala E-mail: jecuru@uncst.go.ug Code Number: ja11028 ABSTRACT The study was undertaken to examine water quality in the distribution network of Kampala City by assessing five storage reservoirs and four consumer taps. The aim was to evaluate residual chlorine decay and relate it to the risk of recontamination. Physicochemical quality of water in the distribution network was temperature 25.6(24.23-28.66) pH 6.6 (6.5-7.1); turbidity 1.9 (0.5-4.5) NTU; colour 17.2 (2.0-54) PtCo, ammonia 0.02 (0.0-0.05) mgl-1, and Fe2+ 0.005 (0-0.0.08) mgl-1. Residual chlorine decay was significant between the Water Treatment Plant (WTP) and the storage tanks (Total Chlorine, F=35.67, P< 0.05; Free Chlorine, F=37.97, P<0.05) and consumer taps (P<0.05) and chlorine concentrations were lower that the WHO (2008) recommended levels in two reservoirs and most of the community standpipe taps. The findings in this study provide a typical scenario of water distribution network in African urban areas and the conditions that increase the risk of recontamination. The information generated is important to the scientific community for designing further research to ensure consumer safety. The Water Board can use the generated information and recommendations in this study for better planning and management of the water distribution network. A major responsibility of Water Boards is to ensure that drinking water consumers are supplied water safe for human consumption. Drinking water producers therefore try to eliminate microorganisms and avoid their re-growth in the water distribution network by using sedimentation, filtration and sterilisation or disinfection. These water treatment methods in combination help to achieve the essential objective of supplying drinking water free of harmful contaminants. In most developing nations there are financial constraints in running drinking water infrastructure and there is also increasing deterioration in the quality of raw water sources. The most commonly used method for drinking water disinfecting in African countries is chlorine dosing and a residual concentration of chlorine is essential throughout the water distribution network to prevent recontamination. Factors such as dissolved organic carbon, Fe2+, Mn2+, NO2-, H2S, H2SO3, ammonia, high temperatures and also corroded pipes, dead ends, long storage time (Gauthier et al., 2000; Heraud et al., 1997; Trussell, 1999; WHO, 2008) and poor maintenance standards (Clark et al., 1999) are known to cause residual chlorine decay in drinking water distribution network. The recommended safe residual chlorine level of 0.2–0.5mg/l (WHO, 2008) is therefore not easily maintained in the distribution network and therefore increasing recontamination risk. Kampala city obtains water from Lake Victoria at Murchison Bay and the water is treated at three conventional water treatment plants (WTP) before distribution. Over the years water quality at Murchison Bay has deteriorated and has become eutrophic (COWI, 2002; NWSC, 1998 and 2000a) causing water treatment problems. The problems experienced at the three Kampala WTPs have a bearing on the quality of drinking water leaving the treatment plants and in the entire distribution system. It is important to investigate residual chlorine in drinking water distribution network and the factors that cause chlorine decay in the network. Residual chlorine was therefore studied in the Kampala City drinking water distribution network to assess recontamination risks and the results discussed in this paper. MATERIALS AND METHODS The study was conducted on the drinking water distribution system of Kampala City. Sampling was conducted at five Kampala water reservoirs of Gaba II (including chlorine contact tank), and four consumer taps in central Kampala and the suburbs. All the reservoirs (hereafter named: 1, 2 & 3) receive water from Gaba II except one (hereafter named: 4) that receives water from an older water works at Gaba I. The reservoirs were sampled at hourly intervals during daytime for three consecutive days each week. Samples from 0.3 m and 1.5 m depths were mixed and used for analyses. Consumer taps were first opened to allow 20 litre of water to drain before sampling the water. Water for bacteriological analyses was collected in 250 ml autoclaved sterile glass bottles. Samples for physicochemical analyses were collected in 1-litre plastic bottles. All sampling, sample treatment and analyses were according to APHA (1995). In situ determinations included free residual chlorine (N,N-diethyl-p-phenylenediamine (DPD) colorimetric method), total residual chlorine (N, N-diethyl-pphenylenediamine (DPD) colorimetric method), pH (microprocessor pH 196T meter) and water temperature (WTW LF 96 meter). Parameters that were analysed in the laboratory included, turbidity (Nephelometric turbidimeter 2100A), colour (Hach DR 2010, 455nm), ammonia (Direct Nesslerization, Hach DR 2010, at 425nm), total iron (Ferrozine method, Hach DR 2010, 260nm), and total coliforms (membrane filtration method). Determination of the rate of decay of residual chlorine in the reservoirs were conducted as follows: 20-litre jerry cans (covered with black plastic sheet) for water collection were cleaned and left to stand (24 hours) full with Vim (calcium hypochlorite, home detergent) cleaned thoroughly with distilled water and allowed to dry. All chlorine measurements were by using the N, N-diethyl-p-phenylenediamine(DPD) colorimetric method with a colour comparator. Measurement time intervals were initially at 5 minute, then 10 minute and finally at 30 minute. The initial residual chlorine concentration was taken on site during sample collection. The decay of free residual chlorine was calculated using a first-order rate kinetic (Heraud et al., 1997; El-Shafy and Grunwald, 2000) given in equation 1 as: Ct =Co e-kt (1) Ct = residual chlorine concentration (mg/l) at any time (t = residence time); Co = initial residual chlorine (mg/l); k = first order decay coefficient (1/min). Physical assessment of the maintenance status of the water reservoirs was done by observation. Records of rusting, wall cleanliness (absence or presence of slimy growth), and water surface cleanliness (floating materials, foams, and scum) were made. The operation characteristics (filling and emptying of reservoirs) were also recorded. Gaba II WTP performance was assessed through on site inspection, interview of site staff and inspection of the daily performance records and annual reports. RESULTS AND DISCUSSIONThe results of the analysis of water quality in the Kampala distribution network are presented in Table 1. Residual chlorine concentrations in the reservoirs were found to increase gradually in the morning hours, reaching a peak in the early afternoon and then gradually decreasing in the later afternoon hours (Figure 1) which is attributed to reservoir filling and emptying regime. Figure 2 presents the mean free and total residual chlorine in five water tanks/reservoirs of Kampala drinking water distribution. Tanks B being the nearest to the WTP recorded highest residual chlorine levels (0.2-1.0mg1-1) that exhibited a sharp peak between 12.00 and 13.00hours. Reservoir 2 which is 18 kilometres from GabaII exhibited residual chlorine levels (0.2-0.5mgl-1) with gentle response peaking at a later time of around 14 hours. Reservoir 1 (Free Cl2 = 0.0 and 0.45mgl-1) which is 9 kilometres from GabaII exhibited zero free chlorine levels in the morning hours but exhibited a sharp rise in free chlorine levels between 13 and 16.00 hours. Such chlorine behaviour has been recorded by Toshiko et al., (2008) in a study simulating chlorine decay in water distribution system. Reservoirs 1 and 4 (Table 1) did not maintain acceptable potable water quality based on UNBS (1994) and WHO (2008) standards on many occasions and this can be attributed to the intermittent water supply to these reservoirs, long storage times (>10hrs) and the old age of the two reservoirs compared to others. In addition reservoir 4 is mainly fed by an older WTP at GabaI. These were some of the factors that contributed to rapid residual chlorine decay and water quality decline including regrowth and recontamination of water (Table 1, Figure 3). Free chlorine concentration in the reservoirs were related the distance from the WTP in the order Tank B The estimated water resident time was from 0.5 to over 20 hours for the storage reservoirs (Table 2). Residual chlorine concentrations dropped from a mean value of 1.0mgl-1 at the WTP to a mean value of 0.01mgl-1 at consumer’s outlets. Chlorine decay experiment indicated that chlorine was lost from water of the reservoirs very rapidly (Fig. 3) with the recommended concentrations (WHO, 2008) being maintained for 10 hours and complete depletion in water from one of the reservoirs (Reservoir 2) in less than one day (Figure 3). The equations for the simulated chlorine decay in the tanks are: i) WTP I: y= 0.9672e-0.0022x (R2= 0.95) (2) Residual chlorine decay coefficient determined for water in the Kampala distribution system was between 0.002 and 0.003 min-1 . This indicated high rates of chlorine loss in the water distribution network compared to other findings from other distribution networks (Heraud et al., 1997; Hart et al., 1992; Xin et al., 2003) which can be attributed to the poorer water quality (e.g. turbidity, colour) and age of the network pipes and reservoirs in the Kampala water distribution network. Similar to the findings of Gauthier et al., (2000) and Ozdemir & Ucak, (2002) water pumping cycles, water use demands and tank residence time also influenced the rate of chlorine loss in drinking water distribution systems. However, inconsistent chlorine dosing, inadequate water clarification and filtration were also reported (Ecuru, 2002) as important factors determining the recoded chlorine concentrations. Using the recorded chlorine decay coefficients for Kampala water distribution network, reservoir retention time would account for 6% chlorine loss at the WTP and 15% at Tank B. Temperature, pH, turbidity and colour in the water tanks were relatively constant at every sampling location, except in Reservoir 4 (Table 1) and within the standards for potable water (UNBS, 1994; WHO, 2008). The difference in the concentration of chlorine in the tanks and reservoirs were significant (p<0.05) as the distance increased away from the WTP. Even though the water quality parameters recorded were within the recommended standards (UNBS 1994; WHO 2008), turbidity of the treated water was in most reservoirs ≥0.1NTU which is not good for efficient disinfection. Reservoirs 2 and 4 especially had unacceptable turbidity and colour as also confirmed by the very rapid chlorine decay rates (Fig 3). For efficient disinfection turbidity should be< 0.1NTU. The elevated colour and turbidity can be attributed poor conditions in the aged reservoirs that may contain rust, scum foams or slime that in turn consume chlorine and may support bacterial growth increasing the risk of water recontamination. Tanks that have long residence times like Reservoirs 1 and 4 (Table 2) tended to supply water of higher risk of recontamination because of zero or very low residual chlorine levels and higher turbidity (Figure 3). For such water residual chlorine will be undetectable within 1 to 3 days depending on the storage tank condition. This means that such reservoirs that receive water already low in residual chlorine (about 0.5mgl-1) can only serve safely if continuously filled as is being emptied by demand. This problem is even exasperated by the intermittent water supply to consumers because of frequent pipe bursts, maintenance works and pump failures that cause frequent shut downs that all promote residual chlorine depletion in the water distribution network. Figure 2 illustrates the impact of water age on chlorine concentration where the WTP displayed the highest residual chlorine concentrations (0.71 mg/L Cl2) while Reservoir 1 that is the nearest to the WTP in the distribution network displayed intermediate concentrations (0.11 mg/L Cl2) and Reservoir 4 that is the farthest displayed the lowest concentrations (0.0 mg/L Cl2 at times). The substantial drop in residual chlorine concentrations from the WTP to consumer’s outlets is attributed to water turbidity in the water distribution system, poor tank storage conditions and network operation characteristics (e.g. pumping regimes, pipe bursts, maintenance, and other disruptions) and pipe age (NWSC, 2000b). Water at community standpipe taps (Table 1) had unacceptable levels of chlorine (< 0.2mg/l) that can be attributed to low chlorine levels at the reservoirs and further depletions during conveyance in the very old pipes in the network. Several factors however influence chlorine decay in water distribution network (Gauthier et al.,, 2000; Clark et al., 1999; Niquette et al., 2000; Trussell, 1999; Wen Lu et al., 1999). Some households, for instance, receive water at specific times of the day only and the water pressure fluctuate very much (Ecuru, 2002). With this kind of scenario, it becomes difficult to maintain adequate residual chlorine in the drinking water distribution network as reported by Haas (1999). To address the chlorine loss problem of the Kampala water network frequent studies are required to assess water quality (including chemical transformations) throughout the distribution system and develop a database for planning and management. Research on optimising operation including maintenance, pipe materials, storage tank materials, optimal storage residence time, pumping regimes should be done by the water authority. The aged conducting and storage facilities should be gradually phased out with new ones. For example pipes of polyvinyl chloride (PVC) and polyethylene (PE) materials where free chlorine is most effective on re-growths than in iron-based pipe materials (Niquette, et al., 2000) could be considered in low pressure areas. In conclusion the risk of recontamination of water in distribution network increases with storage time in reservoir, age of the reservoir, age of the distribution pipes and flow interruptions. To offset the recontamination risks we recommend refurbishment of the network and that treated water should leave the contact tank with residual chlorine level of at least 1.0mg/l and the chlorine concentration should be maintained between 0.2 and 0.5 mg/l throughout the water distribution network. Flow interruptions should also be attended to efficiently within the shortest time period possible. More so during rainy seasons when the risks of recontamination are higher concentrations of chlorine must be maintained at ≥ 0.5mg/l throughout the water distribution system. In case of detected undesirable low chlorine levels in the water distribution booster chlorination could be applied to correct the inadequacy. ACKNOWLEDGEMENTS We extend our sincere gratitude to Uganda National Council for Science and Technology for sponsoring the study and to National Water and Sewerage Corporation, Kampala Uganda (Gaba II and Central Laboratory, Bugolobi), for the cooperation accorded during the study. REFERENCES
Copyright 2011- Journal of Applied Sciences and Environmental Management The following images related to this document are available:Photo images[ja11028t2.jpg] [ja11028f1.jpg] [ja11028f3.jpg] [ja11028t1.jpg] [ja11028f2.jpg] |
| |||||||||
