 |
| About Bioline | All Journals | Testimonials | Membership | News |
|
||||||
|
||||||
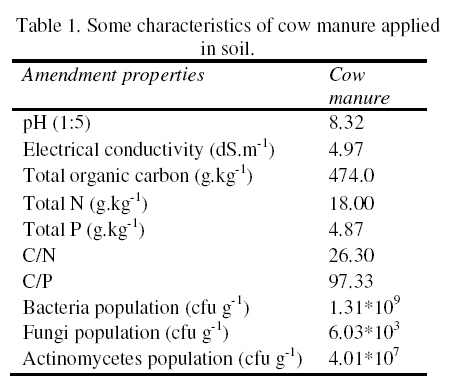
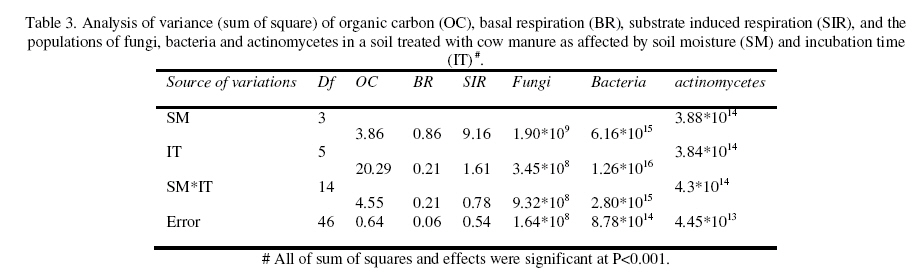
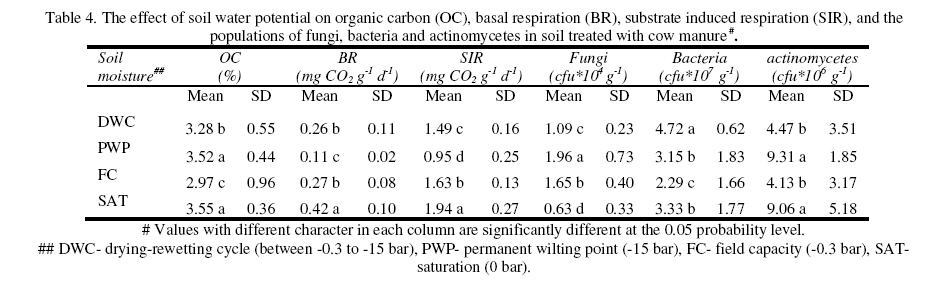
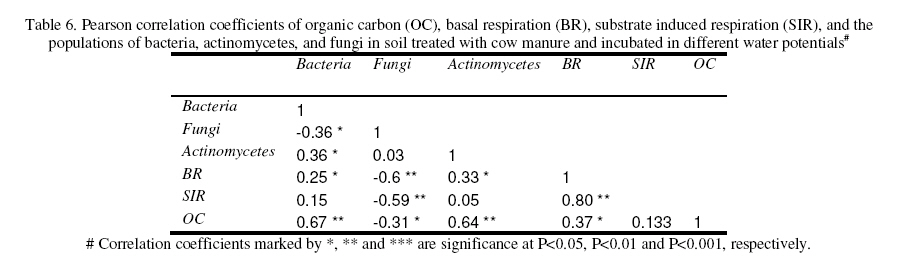
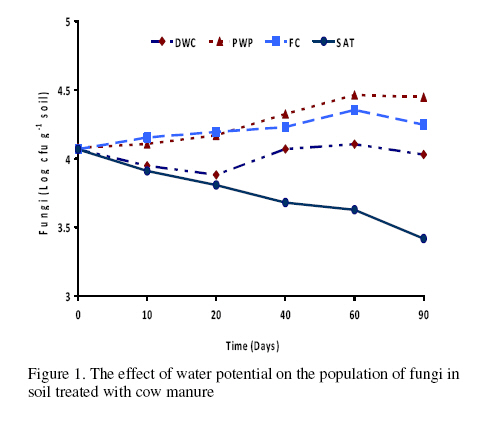
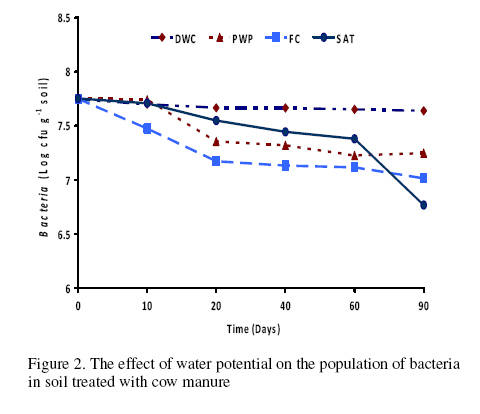
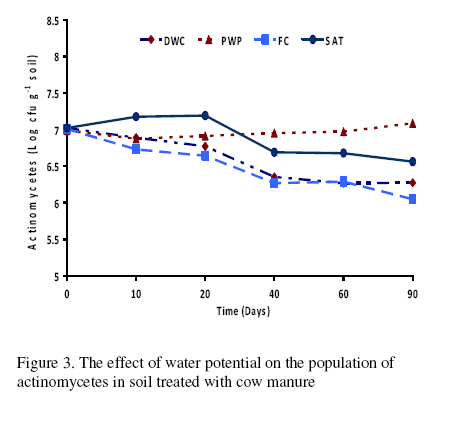
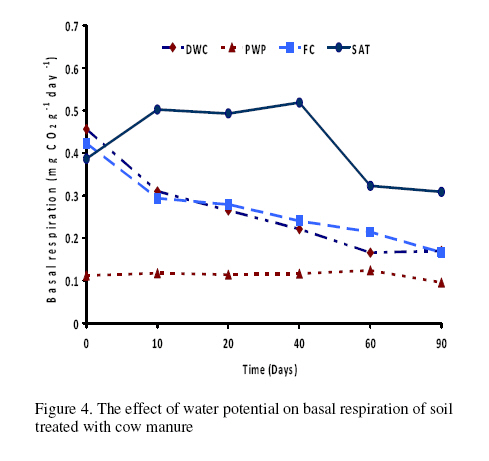
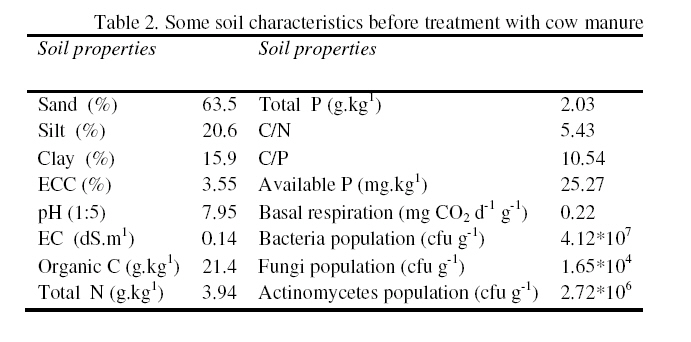
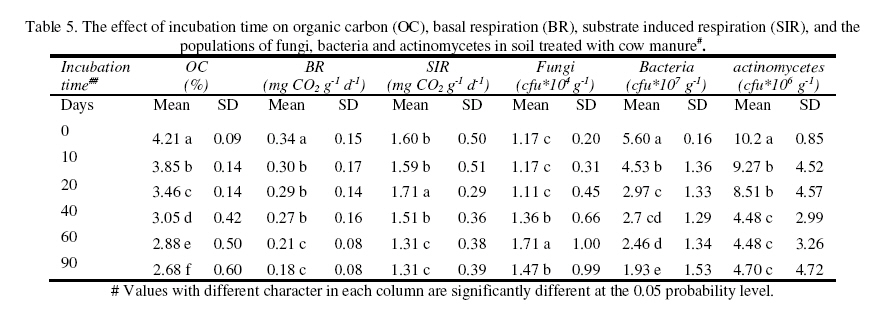
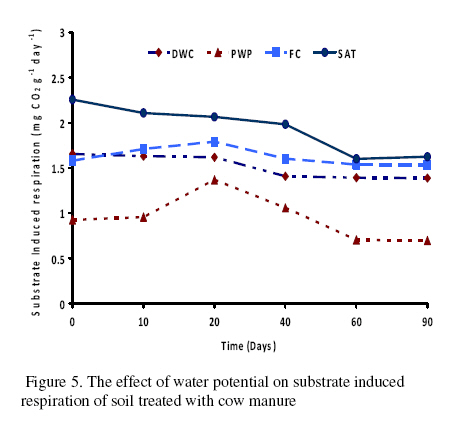
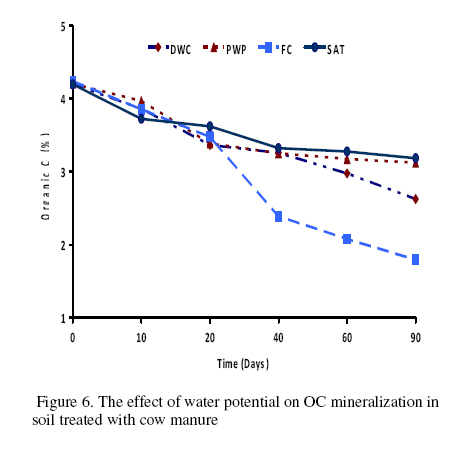
Journal of Applied Science & Environmental Management Vol. 15 No.1, March 2011, pp. 179 -188 The effects of water potential on some microbial populations and decrease kinetic of organic carbon in soil treated with cow manure under laboratory conditions *Ali Akbar Safari Sinegani; Javad Maghsoudi Faculty of Agriculture, Bu-Ali Sina University, Hamedan, Iran. * Email: aa-safari@basu.ac.ir Code Number: ja11030 ABSTRACT The moisture content of the soil habitat is an important stress factor and effects on soil microbial population and activity. The objectives of this study were to test the effects of water potential on the decrease kinetic of soil organic carbon (OC), some microbial populations and their activities in a soil treated with cow manure. A semiarid soil was treated with raw cow manure (CM) at a rate of 20 g kg-1. Three water potentials established for soil incubation were: saturation (SAT, 0 bars), field capacity (FC, -0.3 bars), and permanent wilting point (PWP, -15 bars). Fourth irrigation treatment was drying-rewetting cycle (D-W) between -0.3 to -15 bars. After 0, 10, 20, 40, 60 and 90 days of incubation, soils were sampled for analysis. Colony forming units of bacteria, actinomycetes and fungi and soil OC, basal respiration (BR) and substrate induced respiration (SIR) were measured. The effects of soil moisture, incubation time and their interactions on all of the studied properties and kinetic parameter for OC decrease were significant. The populations of bacteria and fungi were the highest in the soils incubated in DWC and PWP respectively. The population of bacteria decreased significantly with increasing time of incubation. The population of fungi was the lowest in soil incubated in SAT condition and decreased continuously. However fungal population in soil incubated in other moisture increased significantly with increasing time of incubation. The population of actinomycetes was the highest in soil incubated in SAT condition in the early stages of incubation but it was decreased significantly with increasing time in soils incubated in SAT, FC, and DWC. Soil BR and SIR were significantly higher in SAT condition and lower in PWP condition compared to those in other water potentials. However both BR and SIR decreased significantly during soil incubation. Soil OC was significantly higher in SAT and PWP conditions due to unsuitable soil aeration and moisture for OC mineralization. The power function equation was the best model for decrease kinetic of OC in soil incubated in SAT and PWP conditions. However the second order equation was the best model for decrease kinetic of OC in soil incubated in FC and DWC conditions. Soil organic matter (SOM), defined here as nonliving organic material in soils, consists of plant residues, microbial cell fragments and animal detritus as well as decomposed, humified refractory organic material (Sollins et al., 1996), is regarded as an important sink of CO2 which, if properly managed, can be used to mitigate global climate change and to maintain or even improve soil fertility, structure and quality. Understanding the mechanisms of formation and degradation of SOM, in particular the refractory portion has therefore become increasingly important (Krull et al., 2003). Increasing concerns about global climate change, driven by rising atmospheric concentrations of greenhouse gases (GHG), have enhanced the interest in soil C sequestration as one of the strategies to offset anthropogenic CO2 emissions. Soils can function either as a source or a sink for atmospheric GHG depending on land use and soil management. Appropriate management can enable agricultural soils to be a net sink for sequestering atmospheric CO2 and other GHG (Lal and Kimble, 1997; Paustian et al., 1997; West and Post, 2002). The CO2 emission from soil to the atmosphere, a primary mechanism of C loss from soils, is attributed to the metabolism of plant roots, microflora and fauna (Rastogi et al. 2002). Rates of soil respiration are controlled by several factors including soil temperature, quantity and quality of soil organic matter (SOM), soil moisture, the CO2 concentration gradient between the soil and the atmosphere, pore size distribution and wind speed (Raich and Schlesinger, 1992; Rodrigo et al., 1997; Raich and Tufekcioglu, 2000; Jarecki and Lal, 2006). The moisture content of the soil habitat may be an important stress factor. It effects on soil microbial population and activity significantly. A number of studies have reported that microbial survival is dependant upon soil moisture content (Entry et al., 2000; Jenkins et al., 2002; Mubiru et al., 2000; Postma et al., 1989; Reddy et al., 1981). The oxygen status of the soil depends on soil moisture content. A slightly anaerobic condition favors the persistence of microbes in soil. In general, the rate of microbial die increases with a decrease in soil moisture; as an example, the die rate of E. coli 0157 within different soil types has been determined to be dominated by differences in soil water availability (Mubiru et al., 2000). Entry et al. (2000) concluded that increasing the water content of a soil does not always prove beneficial to an introduced bacterial population. Under conditions of excessive moisture, a considerable dilution of usable organic C may result, creating unfavorable conditions for E. coli survival (Klein and Casida, 1967) if the cells are no longer associated with fecal wastes. Metabolic quotient (qCO2) (respiration rate per unit microbial C) has been suggested to evaluate the effects of environmental conditions (Anderson and Domsch, 1993; Fließbach et al., 1994; Moreno et al., 1999) and to quantify substrate utilisation efficiency (Wardle and Ghani, 1995; Dilly and Munch, 1998). High qCO2 can result from an increase in availability of labile C source per unit biomass, a shift in microbial populations (e.g. fungal to bacterial biomass ratio) (Fließbach et al., 1994; Mamilov and Dilly, 2002) and/or increased proportion of active biomass (Wardle and Ghani, 1995; A ´ lvarez and A ´ lvarez, 2000). So it can be used as a key index for assessment of the effect water stress on soil microbial metabolism and OC mineralization. Therefore the objectives of this research were to: (i) assess the effects of soil moisture on microbial population and activity in a soil treated with cow manure, and (ii) assess the effects of soil moisture on the decrease kinetic of OC. These studies prepare more information for soil C sequestration as one of the strategies to offset anthropogenic CO2 emissions. MATERIALS AND METHODSSoil and organic waste sampling: The soil was sampled from the top 20-cm layer of an agricultural land in Hamadan, in northwest of Iran, with semiarid climate (annual rainfall of 300 mm; annual average temperature 13 oC). Raw cow manure (CM) were collected from the dairy units of Hamadan. Soil physical and chemical analyses: Air-dry soil was subsequently crushed and sieved to pass a 2-mm mesh screen for particle-size analysis using the hydrometer method (Gee and Bauder, 1986). Equivalent calcium carbonate (ECC) was measured by back titration procedure (Loeppert and Suarez, 1996). Soil pH and electrical conductivity (EC) were measured in a 1:5 soil: water extract after shaking for 30 min (Hesse, 1971). Organic carbon (OC) was analyzed by dichromate oxidation and titration with ferrous ammonium sulfate (Walkley and Black, 1934). Total nitrogen in all samples was determined by the Kjeldahl method (Hinds and Lowe, 1980). Total P, organic P, and available P were extracted with perchloric-nitric acid, sulfuric acid and 0.5 M NaHCO3 (pH 8.5) respectively and determined spectrophotometrically as blue molybdate-phosphate complexes under partial reduction with ascorbic acid (Sommers and Nelson.1972; Bowman,1989; Jackson, 1958). Microbiological and biochemical analyses: Microbe populations were determined by plate seeding. First, a sample of 1 g dry weight was added to 99 ml of solution (Na4P2O7, 0.2 % in water), the resultant 1:100 suspension then being homogenized by 15 minute shaking and used to make a set of dilutions in distilled water, the dilution levels chosen being those that would give 30–300 colonies per plate. The average number of colonies obtained for each dilution was calculated for each sample, population and day of incubation, and then the averages of all the dilution factors used were found and, taking into account the dry soil weight of each sample, each population was expressed as colony-forming units per gram of dry matter. The culture media used for semi-quantitatively analyzing of heterotrophic bacteria, actinomycetes and fungi were Petri dish containing sterilized nutrient agar (NA), rose Bengal starch casein nitrate agar (RBSCNA) and modified potato dextrose agar (MPDA) respectively. The populations of microorganisms, counted as colony forming units (cfu), were expressed as log10-values per gram dry weight of sample. Basal respiration (BR) was measured as CO2 evolved in 5 days (Alef & Nannipieri, 1995). Substrate induced respiration (SIR), was determined in 72 h (Anderson & Domsch, 1978). Cow manure was also analyzed according to those methods. Table 1 shows some properties of cow manure used in this study. Cow manure had high pH, OC, C/N and C/P ratios. Incubation procedure: A factorial experiment with complete randomized design with three replicates has been done. Soil samples were treated with CM at a rate of 20 g kg-1 (dry weight basis). Four levels of irrigation (deionized water) were established for 90 days. Soil moistures were maintained at: 1) saturation (SAT, 0 bar), 2) field capacity (FC, -0.3 bar), and 3) permanent wilting point (PWP, -15 bar). An irrigation treatment was drying rewetting cycle (DWC) between -0.3 to -15 bars. After 0, 20, 60 and 90 days of incubation a portion of each soil were taken for analysis. Analysis of soil parameters in DWC treatment carried out at 48 hours after soil rewetting. Soil moisture was near field capacity at this time. Soil was analyzed for OC, BR, SIR, fungal and bacterial populations according to the methods mentioned above. Statistical analyses: The experiment was considered a completely randomized design as factorial in three replicates. The factors were soil moistures (SA, FC, PWP, DWC), and incubation time (0, 10, 20, 40, 60 and 90 days). Data were statistically analyzed for standard deviation, means were calculated, and Duncan’s new multiple range tests were performed to assess the effect of soil water potential and incubation time on OC, BR, SIR, fungal and bacterial populations in soil. The computer programs used for data analysis were Ms-Excel, SAS 6.12 and SPSS 9.0 for windows (SPSS Inc). Kinetic Modeling: The decreased kinetic of OC in soil treated with CM and incubated in different water potentials was analyzed using different kinetic models, these include: the linear, the first order, the second order and the power function equations due to their different application (Berry et al, 1980; Sparks 1989). The Zero Order Equation: The zero order (linear) equation is generally expressed as: d(OCt )/ dt = k (1) WhereOCt is the OC at time t (µg g-1 ) and k is the rate constant of linear decrease of OC (h-1 ). After integration and applying boundary conditions t = 0 to t = t and OCt = OCo to OCt = OCt, the integrated form of equation (1) becomes: (OCt) = (OCo) -k.t (2) When the values of (OCt) were linearly correlated with t, the plot of (OCt) versus t will give a linear relationship from which k and OCo can be determined from the slope and intercept of the graph respectively. The First Order Equation: The first order equation is generally expressed as: d(OCt) / dt = k1 . (OCt) (3) Where OCt is the OC at time t (µg g-1 ) and k1 is the rate constant of first order decrease of OC (h-1 ). After integration and applying boundary conditions t = 0 to t = t and OCt = OCo to OCt = OCt , the integrated form of equation (1) becomes: ln(OCt ) = ln(OCo) -k1.t (4) When the values of ln(OCt) were linearly correlated with t, the plot of ln(OCt) versus t will give a linear relationship from which k1 and OCo can be determined from the slope and intercept of the graph respectively. The Second Order Equation: The second order decrease of OC kinetic equation is expressed as equation 3: d(OCt) / dt = k2 . (OCt)2 (5) Where OCt is the OC at time t (µg g-1 ) and k2 is the rate constant of the second order decrease of OC (g µg-1 . h-1 ). For the boundary conditions t = 0 to t = t and OCt = OCo to OCt = OCt , the integrated form of equation (3) becomes: 1/(OCt) = 1/ (OCo ) + k2 . t (6) If the second order kinetics is applicable to the experimental data, the plot of (OCt)-1 versus t should give a linear relationship from which (OCo ) and k2 can be determined from the slope and intercept of the plot respectively. The power function equation: The power function equation is expressed as: (OCt)= a tb (7) Where OCt is the OC at time t(µg g-1 ),a and b are equation constants. A linearised form of equation (9) is: Ln(OCt) = lna + blnt (10) RESULT AND DISCUSSIONSoils properties: The texture of the soil was sandy loam. It was nonsaline (EC 0.14 dS/m) with relatively low eqiuvalent calcium carbonate 3.55%, organic matter (OC 2.14 %) and total nitrogen (TN 0.394 %). Soil organic P, available P, and Biomass P were relatively high (799, 25.27 and 21.23 g kg-1 , respectively). The populations of bacteria, fungi and actinomycetes were 4.12*107, 1.65*104 and 2.72*106cfu g-1 respectively. Table 3 shows analysis of variance of soil organic carbon, basal respiration, substrate induced respiration, and the populations of fungi, bacteria and actinomycetes as affected by soil moisture, incubation time and their interactions. Soil moisture, incubation time and their interactions had strong and significant effect on all of the studied soil properties (p<0.001). The effect of soil moisture (sum squares) compared to the effect of incubation time on soil BR, SIR, and the population of fungi was relatively higher. However the effect of incubation time compared to the effect of soil moisture on the population of bacteria and OC content in soil was reasonably higher. The population of actinomycetes was affected more by interaction between soil moisture and incubation time. The effects of soil moisture: Table 4 shows the effect of soil water potential on the contents of OC, BR, SIR, and the populations of fungi, bacteria and actinomycetes in soil treated with CM. Soils incubated in SAT and PWP compared to those incubated in FC and DWC had higher OC contents may be due to unsuitable condition for OC mineralization. Soils with lower moisture contents (incubated in DWC and PWP conditions) compared to those incubated in SAT and FC conditions, had significantly lower BR and SIR. The highest BR and SIR obtained in soil incubated in SAT condition. They were 0.422 and 1.939 mg CO2 g-1 d-1, respectively. The lowest BR and SIR obtained in soil incubated in PWP condition. They were 0.113 and 0.925 mg CO2 g-1 d-1, respectively. Soil incubated in PWP condition had the highest populations of fungi and actinomycetes. However the population of actinomycetes was also significantly high in soil incubated in SAT condition (9.06*106 cfu -1g soil). The highest population of bacteria was obtained in soil incubated in DWC (4.72*107 cfu g-1 soil). The effects of incubation time: Table 6 shows the effect of incubation time on the contents of OC, BR, SIR, and the populations of fungi, bacteria and actinomycetes in soil treated with CM. Soil OC content decreased continuously from 4.21 to 2.28 % in 90 days of incubation. Soil BR decreased continuously but the decrease rate of BR was not as large as the decrease rate of soil OC. Soil SIR, as an excellent biomass index fluctuated during incubation. The highest SIR was obtained after 20 days of soil incubation (1.711 mg CO2 g-1 d-1). After that soil SIR decreased continuously to 1.31 mg CO2 g-1 d-1. The population of soil fungi did not change significantly in early stages of soil incubation. After 20 days of incubation it increased significantly. The highest population of fungi was counted after 60 days (1.71x10⁴ cfu g-1 soil). The effect of incubation time on the population of bacteria was significant. Same as soil OC, the population of bacteria decrease continuously during soil incubation (from 5.6 x 10⁷cfu g-1 at the start of soil incubation to 1.93x10⁷ cfu g-1 at the end of soil incubation). The population of actinomycetes was also decreased during soil incubation but its decrease rate was not same as decrease rate of bacteria. Temporal variability of the populations of fungi, bacteria and actinomycetes: The population of fungi strongly depended on soil water status during soil incubation (figure 1). The effect of water potential on the population of fungi intensified with increasing time of incubation. The fungal population obviously decreased in soil incubated in SAT condition reasonably. However it increased with increasing time in soils incubated in DWC, FC and specially PWP conditions. At the end of soil incubation the highest and the lowest fungal populations were measured in soils incubated in PWP and SAT conditions. Figure 2 shows the population of bacteria during soil incubation in different water potentials. Bacterial population decreased in soils incubated FC and PWP obviously in the early stages (20 days) of soil incubation. After that it was nearly constant. Although the decrease of bacterial population was low in early stages of soil incubation in SAT condition, but in the end of soil incubation it decreased markedly. Bacterial population was nearly constant in soil incubated in DWC condition. Thus at the end of soil incubation the highest and the lowest bacterial populations were measured in soils incubated in DWC and SAT conditions. The population of actinomycetes decreased in soils incubated in FC and DWC continuously (figure 3). However it was interesting that in the early stages (20 days) of soil incubation the population of actinomycetes increased in soil incubated in SAT condition. After that the population of actinomycetes decreased markedly in soil incubated in SAT condition. But it increased in soil incubated in PWP condition. At the end of soil incubation the highest and the lowest populations of actinomycetes were measured in soils incubated in PWP and FC conditions. Temporal variability of soil BR, SIR and OC content: Soil BR strongly depended on soil water status during soil incubation (figure 4). Soil BR increased in soil incubated in SAT condition in 10 days of incubation and remained nearly constant for 40 days. However it decreased obviously with increasing time of incubation. Soil BR decreased continuously and similarly in DWC and FC conditions. Basal respiration of soil incubated in PWP was significantly low during soil incubation. However it did not decrease so much with increasing time of soil incubation. Although the effect of water potential on soil BR weakened with increasing time of incubation (figure 4), but in each time soil sampling the highest soil BR obtained in SAT condition and the lowest soil BR was obtained in PWP condition. Although soil SIR was considerably high in SAT condition, it decreased continuously during soil incubation. Soil SIR did not decrease in soils incubated FC and DWC conditions. Basal respiration of soil incubated in PWP was significantly low during soil incubation. It fluctuated but did not decrease so much with increasing time of soil incubation. The effect of soil water potentials on soil OC mineralization has been shown in figure 6. In the early stages of incubation soil OC decreased in all soil water status similarly, but with increasing time of incubation the effect of water potential on OC mineralization was cleared. Soil OC decreased with higher rate in FC and then DWC conditions compared to those in PWP and SAT conditions. Correlation analysis: Table 6 shows correlation coefficients of OC, BR, and SIR, and the populations of bacteria, actinomycetes, and fungi in soil treated with CM and incubated in different water potentials. Correlation coefficients of fungal population with soil OC, BR and SIR and bacterial population were negative and significant. But correlation coefficients of bacterial population with soil OC and BR and the population of actinomycetes were positive and significant. Same as bacterial population, the population of actinomycetes had positive and significant correlation with soil OC and BR. The correlation coefficients of soil SIR with the population of bacteria and actinomycetes were not significant. On the other hand the correlation coefficients of soil BR and SIR with the population of fungi were negative and significant. This finding is not in agreement with other reports. Low fungi population in soil incubated in SAT condition and high BR and SIR in soil incubated in SAT condition may be the reason of this result. It was reported that SIR is an excellent index for soil microbial biomass (Alef and Nannipieri, 1995). Our result showed that it is not suitable for wet or submerged soil. Soil incubated in SAT condition has high levels of OC such as organic acids and etc. which were used and mineralized by soil microorganisms during determination of soil respiration in jars. Soil batter aeration in this condition may be the reason of those disagreements. Kinetic of OC decrease: The kinetic study of soil OC mineralization in different water potential showed that the best model and its parameters for decrease of OC in soil strongly depend on the soil water status. In general the determination coefficients (R2 ) of the zero order, first order, and second order equations and power function model were statistically significant. However these equations were different in level of significance. They had also different standard error of the estimate. The zero order equation, the first order equation, the second order equation and the power function equation were suitable for OC dynamic in soils incubated in DWC and FC conditions. But the second order equation may be the best for OC dynamic in DWC and FC conditions because of high determination coefficient and relatively low standard error of the estimate. The best equation for soil OC dynamic in unsuitable conditions (SAT with limited aeration and PWP with limited water supply) was the power function equation. Its determination coefficients for PWP data was 0.89 and significant at p<0.05. This equation was the best for OC dynamic in SAT condition. Its determination coefficients was 0.98 and significant at p<0.001. The y intercept and slop for linearied form of the kinetic equations for OC decrease in soil treated with CM was affected by soil water status. The y intercepts for most of the kinetic equations studied here were considerably high for OC dynamic in soil incubated in FC condition. Moreover the slops for most of the kinetic equations were considerably high for OC dynamic in soil incubated in FC condition. These finding related to the best condition for OC mineralization in soil incubated in FC condition. Soil respiration is used as an indicator to determine the effect of sludge amendment on soil microbial activity (Page et al. 1982). Soil respiration in terms of carbon dioxide evolution increases as microbial activity increases. Moreover, the amount of carbon dioxide evolved also demonstrates the net Cmineralized in the soil (Wong and Wong 1986). Generally, soil respiration increased initially after organic amendment and then declined (Wong and Wong 1986). The initial increase is due to the moistening of soil which moisture activates the microorganisms and the supply of amendment nutrients from organic amendment stimulates the growth and activity of microorganisms (Wong and Wong 1986). The decline in CO2 evolution in the later stage is caused by the exhaustion of one or more essential nutrients and the accumulation of toxic metabolites during incubation (Saviozzi et al. 1993; Wong and Lai 1996). In this study soil basal respiration increased in soil incubated in SAT condition in 10 days of incubation and remained nearly constant for 40 days. After that it decreased obviously with increasing time of incubation. Soil BR decreased continuously and similarly in DWC and FC conditions. Basal respiration of soil incubated in PWP was significantly low during soil incubation. However it did not decrease so much with increasing time of soil incubation. Wong et al. (1998) reported that in application of different amount of sewage sludge in a sandy soil, the daily CO2 evolution pattern was the same in all treatments that CO2 evolution increased initially and then decreased till the end of the incubation period. All the treatments had peak CO2 evolution at day 7, except for the soil amended with 350 g kg-1 of sludge which had peak CO2 evolution at day 2. The results showed that soil SIR was considerably high in SAT condition and it decreased continuously during soil incubation. Soil SIR did not decrease in soils incubated FC and DWC conditions. Basal respiration of soil incubated in PWP was significantly low during soil incubation. It fluctuated but did not decrease so much with increasing time of soil incubation. These results are not in agreement with other reports. It was reported that water deficit did not seem to affect microbial biomass C adversely (Pascual et al. 2007). Zaman and Chang (2004) showed that microbial biomass C was dramatically affected by temperature, but less so by soil moisture content. However, water deficit had a significant effect on the biomass metabolic activity (as indicated by basal respiration). Metabolic quotient (qCO2) (respiration rate per unit microbial C) has been suggested to evaluate the effects of environmental conditions (Anderson and Domsch, 1993; Fließbach et al., 1994; Moreno et al., 1999) and to quantify substrate utilization efficiency (Wardle and Ghani, 1995; Dilly and Munch, 1998). High qCO2 can result from an increase in availability of labile C source per unit biomass, a shift in microbial populations (e.g. fungal to bacterial biomass ratio) (Fließbach et al., 1994; Mamilov and Dilly, 2002) and/or increased proportion of active biomass (Wardle and Ghani, 1995; A ´ lvarez and A ´ lvarez, 2000). If soil SIR would be accepted as an index of soil biomass, the result of this study is not in agreement with those reports. The metabolic quotients calculated (BR/SIR) for more suitable water (DWC and FC) conditions (0.17) were higher than that calculated for unsuitable water (PWP) condition (0.13). Pascual et al. (2007) reported that water deficit produced an increase of qCO2 only in soils treated with mineral fertilizers, which indicates high respiration per unit of biomass in order to survive in the hostile environment of this treatment (high EC and low water availability). Thus, these conditions could have resulted in a more stressed microbial community, which was less efficient in using organic resources (Anderson and Domsch, 1993; Rietz and Haynes, 2003). The metabolic quotient (BR/SIR) calculated here was (0.22) significantly high in soil incubated in SAT condition. It is not because of the hostile environment and microbial stress. It may be due to different condition of soil BR measurement (in jars) and soil respiration during incubation. Displacement of saturated soil sample during SIR determination helped soil aeration and raised BR incorrectly. The rate of OC mineralization was low in soil incubated in SAT condition. CONCLUSION The effects of soil moisture, incubation time and their interactions on the populations of fungi, bacteria and actinomycetes, on soil OC, BR and SIR and on the kinetic parameters for OC decrease were significant. The populations of bacteria and fungi were the highest in the soils incubated in DWC and PWP respectively. The population of bacteria decreased significantly with increasing time of incubation. The population of fungi was the lowest in soil incubated in SAT condition and decreased continuously. Fungal populations in soil incubated in other moisture increased significantly with increasing time of incubation. The population of actinomycetes was the highest in soil incubated in SAT condition in the early stages of incubation but it was decreased significantly with increasing time in soils incubated in SAT, FC, and DWC. Soil BR and SIR were significantly higher in SAT condition and lower in PWP condition compared to those in other water potentials. However both BR and SIR decreased significantly during soil incubation. Displacement of saturated soil sample during SIR determination helped soil aeration and raised BR incorrectly. The rate of OC mineralization was low in soil incubated in SAT condition. Soil OC was significantly higher in SAT and PWP conditions due to unsuitable soil aeration and moisture for OC mineralization. The power function equation was the best model for decrease kinetic of OC in soil incubated in SAT and PWP conditions. However the second order equation was the best model for decrease kinetic of OC in soil incubated in FC and DWC conditions. REFERENCE
Copyright 2011- Journal of Applied Sciences and Environmental Management The following images related to this document are available:Photo images[ja11030t5.jpg] [ja11030t1.jpg] [ja11030t2.jpg] [ja11030f1.jpg] [ja11030f3.jpg] [ja11030f6.jpg] [ja11030t7.jpg] [ja11030f5.jpg] [ja11030t3.jpg] [ja11030f2.jpg] [ja11030t4.jpg] [ja11030f4.jpg] [ja11030t6.jpg] |
| |||||||||
