 |
| About Bioline | All Journals | Testimonials | Membership | News |
|
||||||
|
||||||
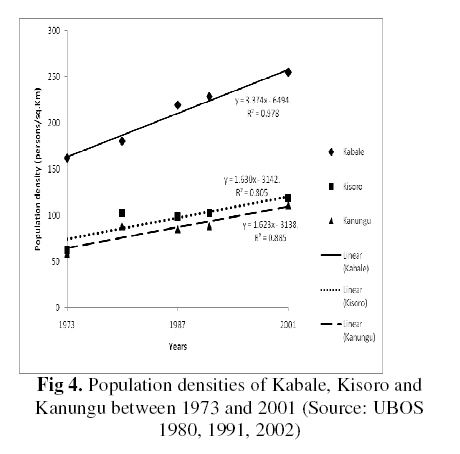
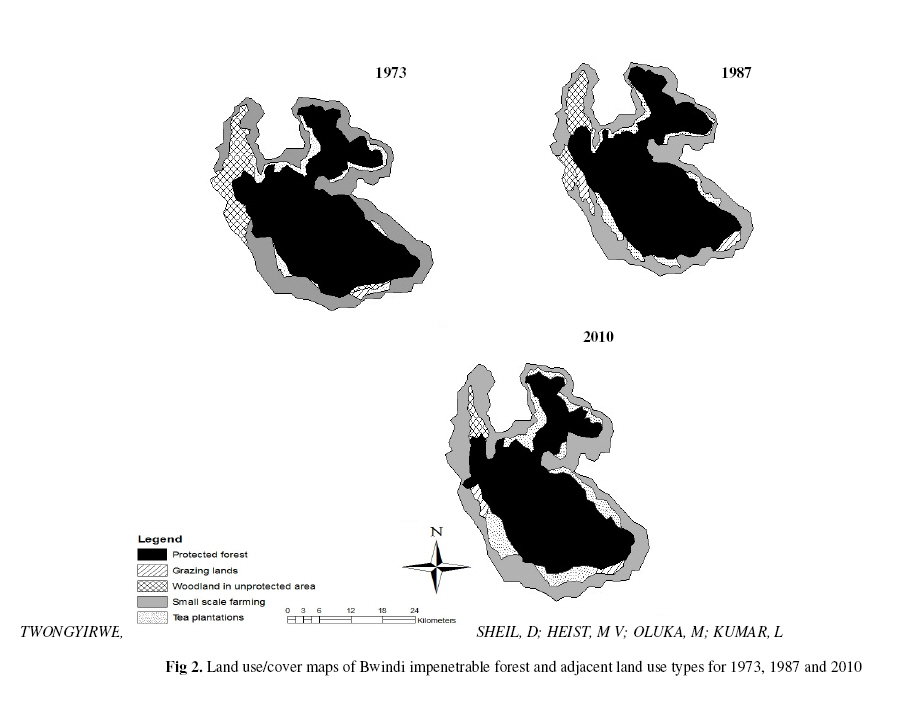
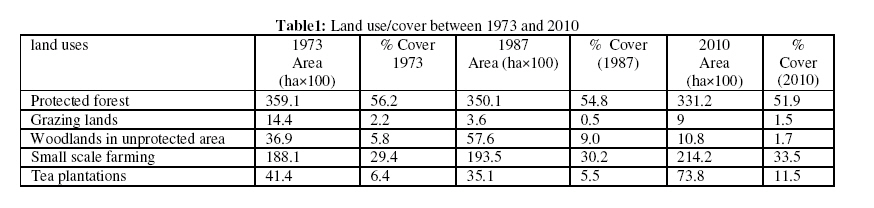
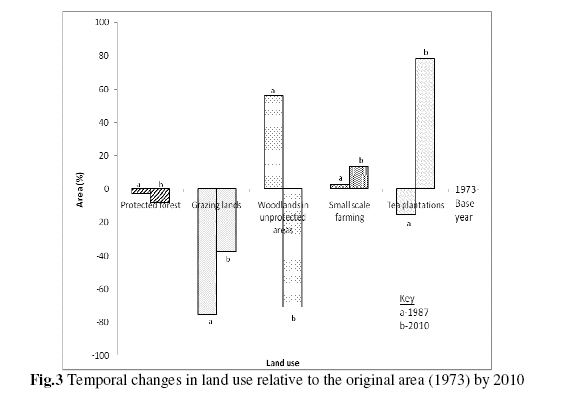
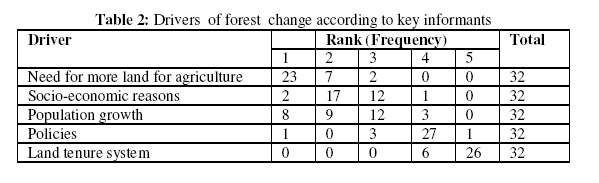
Journal of Applied Science & Environmental Management Vol. 15 No.1, March 2011, pp. 189 -195 Dynamics of forest cover conversion in and around Bwindi impenetrable forest, Southwestern Uganda 1,2Twongyirwe, R; 1Majaliwa, J G M; 3Ebanyat, P; 3Tenywa, M M; 2Sheil, D; 2 Heist, M V; 1, 2Oluka, M; 4Kumar, L 1Makerere University, College of Agricultural and Environmental Sciences, Department of Environmental Management, P.O. Box 7062, Kampala. Code Number: ja11031 ABSTRACT Forest cover has been converted to agricultural land use in and around the protected areas of Uganda. The objectives of this study were; to examine the dynamics of forest cover change in and around Bwindi impenetrable forest between 1973 and 2010 and to identify the drivers of forest cover change. The trend in forest cover change was assessed by analyzing a series of orthorectified landsat imageries of 1973, 1987 and 2001 using unsupervised and supervised classification. Land use/cover map for 2010 was reconstructed by analyzing 2001 image, validated and/or reconstructed by ground truthing, use of secondary data and key informant interviews. A series of focused group discussions and key informant interviews were also used to identify drivers of land use/cover change. Policies and institutional arrangements that could have affected forest cover change for the studied time period were also identified. Results showed that protected forest and woodlot in unprotected area had declined by 7.8% and 70.7% respectively as small scale farming and tea plantations had increased by 13.9% and 78.3% respectively between 1973 and 2010. The conversions were attributed to land use pressure due to population growth, change in socio-economic conditions and institutional arrangements. The severe loss of woodlot outside the protected area not only poses a potential threat to the protected forest but also calls for intervention measures if efforts to mitigate climate change impacts are to be realized. The Millennium Development Goals have recognized a crucial link between forests and sustainable development. The area of forest cover is one of the indicators for the 7th Goal to ‘ensure environmental sustainability’ (Hoare, 2005). In the tropics however, deforestation is estimated to account for forested area decline of 13 million ha yr–1 as a result of conversion to agricultural land (FAO, 2005; MEA, 2005). Owing to this, forests are reported to have nearly completely disappeared in 53 countries (MEA, 2005). Uganda has one of the highest rates of forest loss globally (Namirembe, 2010) ranging from 0.7% to 2.27% (NFA, 2009). The disappearance of tropical forests is a result of many pressures, both local and regional, acting in various combinations in different geographical locations (Geist and Lambin, 2002). As humans try to meet their daily needs, they are subjecting forests, woodlands and grasslands to the highest rates of change (Pomeroy & Tushabe, 2004; MEA, 2005) resulting in land use/cover changes (Mwavu and Witkowski, 2008; Egeru and Majaliwa, 2009). While it is possible to identify with some certainty the factors underlying tropical deforestation in a general sense, it is very difficult to pinpoint a uniform set of drivers/causes and their relative contributions that apply generally at a global or even regional level (MEA, 2005). A complicated combination of economic and social development factors, levels of agricultural productivity and urbanization, climatic and geographical peculiarities, and historical factors, together determine the rates of deforestation in any particular place (Luoga et al., 2005). The conversions have not spared the forests in and around Bwindi impenetrable forest in Southern western Uganda. The protected forest has a unique eco-system with diverse gene reserves with worldwide interest. It is most popular for gorilla tourism attraction (Nkurunungi et al., 2004). The area is of particular concern due to the rapid land conversion practices and sensitivity to human impact. The growing population cultivates the land immediately surrounding the Park where no forest now remains (UNEP-WCMC, 2007). Any further loss of land under forest cover in and around Bwindi impenetrable forest may be counterproductive to global efforts to mitigate the effects of climate change (Balmford and Whitten 2003; Laurance, 2007; Cerbu et al., 2010). An assessment of the impacts of the forest conversion could serve as a basis for development of mitigation strategies for the areas in and around the protected forest and contribute to improvement of the environment quality. The objectives of this study were to determine the spatio and temporal forest cover changes in and around Bwindi impenetrable forest from 1973 to 2010 and drivers of forest cover change. We anticipated that forest cover in both protected and unprotected areas was significantly converted to other land use types because of changes in population together with socio-economic policies in the region in the period of analysis. MATERIALS AND METHODSDescription of study area: The study was conducted at Bwindi impenetrable forest located in Southwestern Uganda (0˚53΄–1˚08΄N and 29˚35΄–29˚50΄E) for 12 months between September 2009 and August 2010. The protected forest shares boundaries with the Bwindi Impenetrable National Park and covers approximately 331 km2, characterized by steep hills and narrow valleys with continuous forest vegetation throughout. The elevation of Bwindi ranges from 1160 to 2607 m a.s.l. and encompasses a rare ecological continuum of medium altitude and afromontane forest. Although classified as moist lower montane forest, the vegetation composition is complex and greatly affected by altitude, topography and soil depth (Hamilton, 1982). The soils are characterized as well differentiated humic ferralsols with a well developed and moderately to strong subangular structure, moderate to high acidity, and deficient in bases (Twongyirwe et al., unpubl.). The annual rainfall range is 1400–1900 mm and the wettest periods are March to April and September to November. The annual mean minimum and maximum temperature ranges are 7–15oC and 20– 27oC respectively (Howard, 1991). The vegetation is classified as medium altitude moist evergreen forest and high altitude submontane forest (Langdale-Brown et al., 1964). About 61% of the forest was heavily exploited by pitsawyers (between 1932 and 1991), 29% was selectively pitsawed and only about 10% remained relatively intact (Howard 1991). Part of the heavily exploited area was subjected to agricultural encroachment. Wild fires have in the past occurred in some parts of the forest (Butynski 1984). Densely populated (about 230 persons per square kilometer) agricultural lands surround the forest (Obua & Muhanguzi 1998). Determination of forest cover change trend: Land use/cover for Bwindi impenetrable forest area was identified and reconstructed from Landsat images and community land use/ cover mapping for the period 1973-2010. The historical time points selected were 1973, 1987, and 2001 (a period with changes in governance and rapid land use changes in Uganda). Landsat images (1973, 1987, and 2001) taken during the same period of the year were acquired for analysis. The 2010 land use/cover map was reconstructed from analyzing the 2001 image, use of key informant interviews and ground-truthing. The images were analyzed using both unsupervised and supervised classification procedures in Integrated Land and Water Information System (ILWIS) version 3.3 and Erdas (1999) image processing software. The classes used in the study were; forest1, woodlands2 grazing lands3, small scale farming4 and tea plantations. The Landsat images were corrected for known system gain, filtered to reduce noise and interpolated for cases of missing values due to sensor failure prior to the analysis. Preliminary maps produced from digital image interpretations were validated with ground observations (ground-truthing) done by elders in communities and the researcher for the studied areas. Forest, woodlands, farm lands and grazing lands were geo-referenced using GPS devices with 2m accuracy. A total of 32 key informants which included some elders were identified and invited for focused group discussions in the sampled areas [Ruhija, Nkuringo, Buhoma, Karangara (Kayonza)] to identify drivers for land use change. They were interviewed on land use types that existed and change that occurred over time and the possible reasons. They were asked to rank the drivers starting with what they thought was the most important obtaining rank 1. To further understand the factors that have caused land use change, a literature review was conducted to identify policies that were implemented and institutional arrangements during the period of analysis. In addition, comparison between population densities and land use/cover changes were made. Population densities for the three districts (Figure 4) in which Bwindi impenetrable forest lies were computed on the basis of the population growth rates between census years available from the Uganda National Bureau of Statistics. RESULTS AND DISCUSSION In general, the trends in forest cover declined while agricultural land uses and tea land uses increased over time indicating spatial forest conversion (figure 2). The total area of the protected forest and woodlot in unprotected area declined at the rate of -0.2% and 1.9% per year respectively between 1973 and 2010. However, the total area of small scale farming and tea plantations increased at the rate of 0.4% and 2.1% per year respectively between 1973 and 2010. Trends relative to total area were a decline 56.2% , 54.8%, 51.9% for protected forest cover, an increase 29.4% , 30.2% and 33.5% for cultivated land, an increase 6.4%,5.5% 11.5% for tea plantations; and an increase 2.2%, 0.5%, 1.5% for grazing land for 1973, 1987 and 2010 respectively. Woodlands in unprotected areas however increased initially from 5.8% to 9.0% between 1973 and 1987 but later sharply declined to 1.7% in 2010 (Table 1). Grazing lands reduced initially from 2.2% in 1973 to 0.5% in 1987. However there was then a slight increase to 1.5% by the year 2010. Figure 3 shows temporal changes in land use around Bwindi impenetrable forest with 1973 as the base year. Protected forest cover, grazing lands and woodlands in unprotected area had declined relative to original area (1973) by 2010 by 7.8%, 37.5% and 70.7% respectively. On the contrary, small scale farming and tea plantations had increased relative to the original area (1973) by 2010 by 13.9% and 78.3% respectively. During the Focussed Group discussions (FGD), the respondents identified and ranked the need for more land for agriculture as the most important driver for forest conversion (Table 2). They argued that forest soils were more fertile and hence gave higher yields when opened up for cultivation. Some respondents argued that the policies implemented within the period of analysis were not clear. As an example they higlighted that the boundary of the protected forest was not made clear to the people living adjacent to the forest leading to encroachement for activities such as farming and settlement. This argument is in agreement with Scott (1992) who found that most of the forest patches that were lost near the forest boundary were due to unclear demarcation of the protected forest boundary. Population density generally increased near linearly in the three districts in which Bwindi impenetrable forest lies during the period of study (Figure 4). Kabale had the highest and Kanungu the lowest population densities in the entire period under investigation. This growth in population over the years exerted more pressure on the land resulting to forest and woodland encroachment as more need for food, firewood and timber arose. Land use change in African farming systems has been attributed largely to population growth with the common conclusion that it has resulted in widespread environmental degradation (Clever and Schrieber, 1994) although there has been some documented examples where environmental quality improved with population growth (Tiffen et al., 1994, Tappan and McGahuey, 2007). Bwindi impenetrable forest lies in a region of political instability (neighboring DRC has gone through decades of civil war; Uganda has gone through a period of political and economic instability since independence. It’s after 1986 to date that there has been some stability). Although the 1970’s and 1980’s were lawless years, the boundaries of Bwindi forest reserve remained largely un-violated, there was however, massive exploitation of the forest for timber, game and gold (Butyanski 1984). Where it occurred, it was often because politicians and other influential people circumvented the laws and not because local people took action on their own (Hamilton, 1984). A survey in the late 1980’s revealed that an estimated 61% of the reserve had been heavily exploited for timber, the best hard woods had been removed from an additional 29% and only 10% remained intact (Howard 1991). The Game Department took action to address these problems in the late 1980’s. The status of the forest was then raised to national park in 1991. At-first there was little local support for the new park because of the concerns about loss of access to forest resources and increased crop raiding by forest animals (Hamilton et al., 1990). Sixteen fires, some deliberately set by local residents or left to burn gutted the park boundaries during the dry season that followed its gazettment leading to loss of 5% of the forest. There have been no recent cases of deliberate burning. Many parts of the forest are under regeneration (Babaasa et al., 2004) although the forest has not been established to the original extent. In the period of analysis, the protected forest and woodlands in unprotected areas were converted at the rate of 0.2% and 1.9% per year respectively. The rate for conversion of woodlands in the unprotected area is in the range of Uganda’s annual deforestation rate of 1-3% (Kayanja and Byarugaba, 2001). The rate for the protected forest is less than that predicted by Kayanja and Byarugaba, 2001 because it remained relatively tightly protected even during the period of political instability. Although there has not been recent conversion of the protected forest (after becoming a National Park), woodlot patches outside the protected areas are almost becoming extinct. The woodlots, owned by private individuals, are heavily encroached on for firewood, timber and other forest products in an unsustainable manner (Aineomucunguzi et al., 2009). This poses a potential threat to the protected forest as the demand for forest resources outweighs what can be readily obtained from the private and community woodlots. The recent efforts to mitigate global climate change impacts through Reduced Emissions from Deforestation and forest Degradation plus (REDD+) might provide a viable solution to community needs through financial incentives to maintain the protected forest and woodlot in unprotected areas as well as to plant trees in degraded areas (Harris et al., 2008; Cerbu et al., 2010). On the other hand, tea plantations and small scale farming increased by 13.9% and 78.3% at the expense of protected forest and woodlot between 1973 and 2010. The expansion of tea plantation could be attributed to a readily available market for tea leaves from the nearby Kayonza tea factory (in Kanungu), an enticement for farmers to maximize profits since it was reportedly more profitable than other crops. Additionally, several farmers surrounding the park are faced with the problem of crop raiding and so tea serves as a good buffer between the forest and crop fields since it is unpalatable to wild animals. Previous studies in Uganda have shown that some parts of the protected forest were converted to small scale farming and tea plantations (Mugisha, 2002, Majaliwa et al., 2010). The increase in land under small-scale farming could be attributed to pressure on land as a result of population growth in the three districts within which the forest lies leading to conversion of forest cover and woodlot to agricultural land uses. Taylor et al., (1999) attributed the increase in the small scale farming to dire need to support the high population densities of the Rukiga highlands for food. Although the key informants perceived that need for more land for agriculture and population growth were the most important drivers of forest conversion, further comparative studies are required to validate the findings. These results are similar to the findings of Majaliwa et al., (2010) who found out that woodland and grasslands were declining as small scale farming and built up areas were increasing around Kibale national park in South-western Uganda over the period of 1973 to 2009. Mwavu and Witkowski, (2008) also found that Budongo forest cover in Northern Uganda had decreased significantly as sugarcane plantations had increased between 1988 to 2002. They attributed these changes to agricultural expansion, increasing human population exacerbated by large influxes of refugees, conflicts of interest and political interference in the management of Budongo Forest and the unclear land tenure. ACKNOWLEDGEMENT We‘re grateful to Institute of Tropical Forest Conservation, entire staff and Mac-Arthur foundation for having supported and funded this Research. NOTES 1 Forest was defined as an area consisting of trees with overlapping crowns forming over 70% cover. Bwindi impenetrable forest is protected by the government of Uganda.
Copyright 2011- Journal of Applied Sciences and Environmental Management The following images related to this document are available:Photo images[ja11031f3.jpg] [ja11031f4.jpg] [ja11031f2.jpg] [ja11031t2.jpg] [ja11031t1.jpg] [ja11031f1.jpg] |
| |||||||||
