 |
| About Bioline | All Journals | Testimonials | Membership | News |
|
||||||
|
||||||
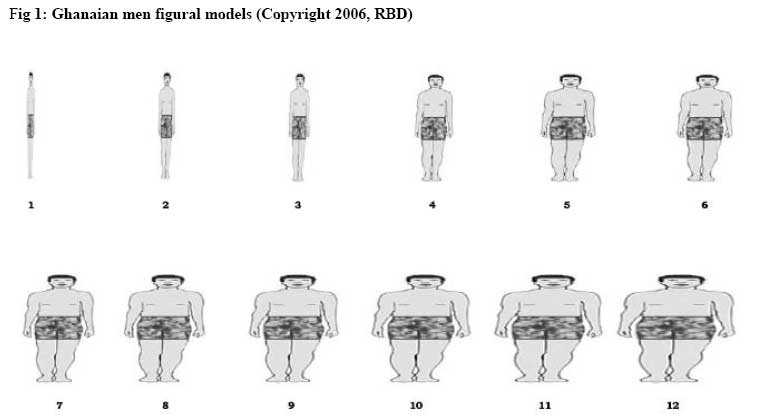
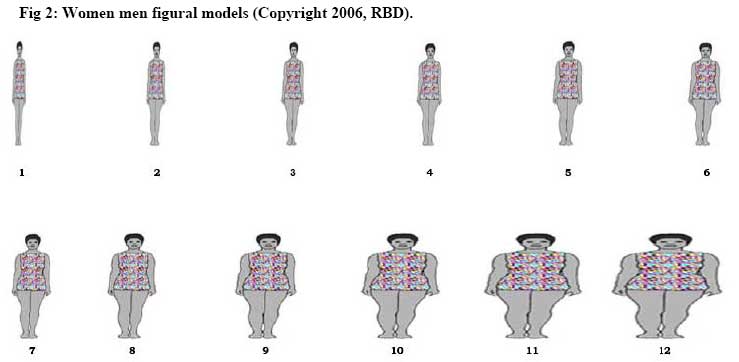
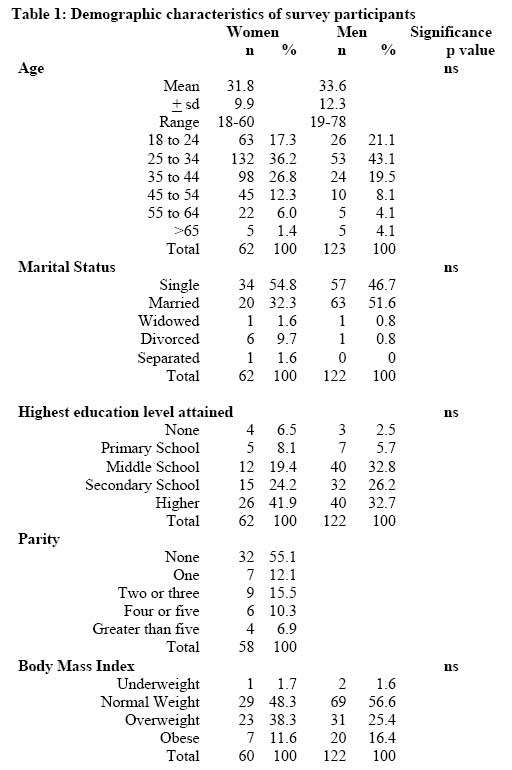
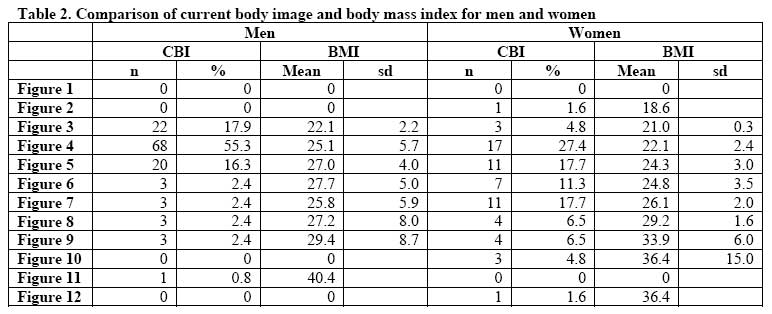
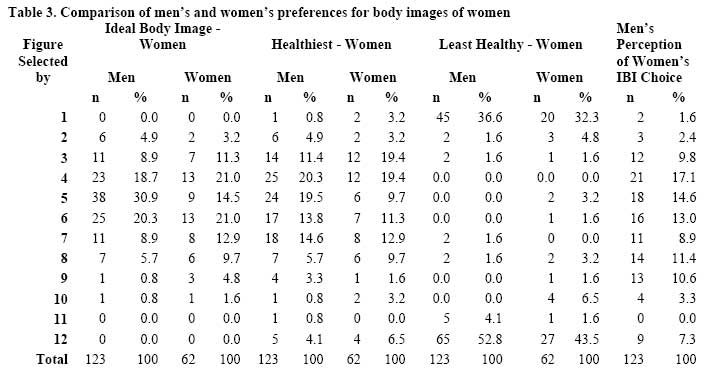
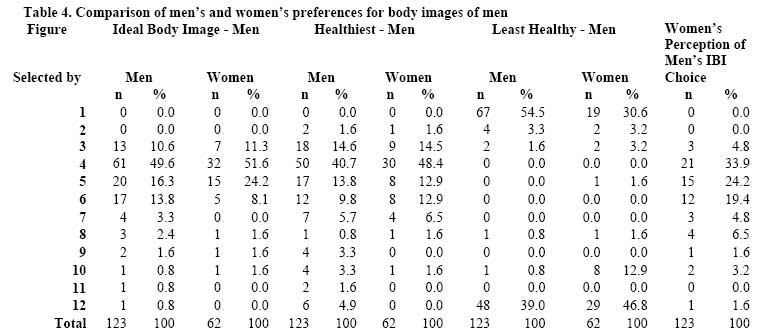
African Journal of Health Sciences, Vol. 14, No. 1-2, Jan-June, 2007, pp. 54-60 Comparison of the perception of ideal body images of Ghanaian men and women Naana Afua Jumah1 , Rosemary B Duda2* 1Harvard Medical School, Boston, MA 02215, USA; 2Department of Surgery, Beth Israel Deaconess Medical Center, RW871, 330 Brookline Ave, Boston, MA 02215, USA Code Number: jh07008 SUMMARYObesity is now a worldwide public health problem. The prevalence of obesity and obesity-linked illnesses continues to increase in regions of the developing world that were previously unaffected by such conditions. Reasons for this increase include changes in diet, occupations, activity and cultural norms. The purpose of this study was to test the hypothesis that Ghanaian men preferred Ghanaian women to be of the larger, traditional body size. Ghanaian men and women were selected at random to complete a survey and to select a body image that best represented their current body image (CBI), and an ideal body image (IBI) for men and women. The results showed that 69.7% of men selected the IBI for women to be in the normal BMI range while only 44.7% felt that women preferred to be in the normal body mass index BMI category. In comparison, 56.5% of women selected the IBI for women in the normal BMI range and 48.4% stated that they believed men preferred a woman in the normal BMI range. An additional 33.9% of women reported that they felt men preferred a women’s figure in the underweight range. The difference in men’s selection and their perception of a women’s selection of the IBI for a woman was significant (p=0.05). Men were significantly more likely to be satisfied with their current body image (CBI) than women (43.9% vs. 22.6%, respectively, OR 1.12 [1.03-1.20], p=0.003). Women were significantly more likely to change their CBI to improve their health (OR 2.97 [1.31 – 6.71], p=0.009). It is concluded that the majority of men and women in this cohort prefer women to be of a normal BMI but the perceptions of the preference of the opposite gender are significantly different. This information now allows us to proceed with an educational and medical program aimed to reduce obesity and the consequences of obesity-linked illnesses in this population. Introduction Just over a generation ago, increasing body weight with age was uncommon in Sub-Saharan African populations [1]. This situation is changing, particularly in the urban environment where the prevalence of obesity is purported to be increasing [2]. In a recent assessment of the health of urban women residing in Accra, Ghana, the prevalence of obesity was surprisingly identified in 34.7% (340/1237) of the women and hypertension in 712/1303 (54.6%)[3]. Hypothetical rationale for the high prevalence of obesity includes readily available and affordable food items, diet rich in fried foods and oil, lack of exercise or vigorous activity, genetics [4], and the presumed cultural valuation of obesity as a sign of wealth and prosperity. Obesity in this Ghanaian cohort was not linked to higher education or income. Little is known about the cultural factors that contribute to the idea of ideal body image among urban Sub-Saharan African women and in particular the influence of men on forming this ideal. In a recent survey, Ghanaian women attending the gynecology and/or radiology clinics at the Korle Bu Teaching Hospital were interviewed regarding their perception of the ideal body image for women [5,6]. Figural stimuli, an easy to administer self report of body image [7], were specifically adapted to represent Ghanaian women from extremely thin to morbidly obese. The figures representing normal weight women were selected by 66.2% of women interviewed as the ideal body image for Ghanaian women. The purpose of this present study was to randomly select Ghanaian men in a non-medical environment to determine the men’s preference for the ideal body image of Ghanaian women and men. Randomly selected women in the same environment were used as controls. Methods Figural stimuli –Body Images Culturally adapted prototype Figural Stimuli for Ghanaian women and men were developed using computerized body morph assessment tools (Adobe Photoshop and Abrosoft Fanta Morph3) [8,9,10,11]. Figures included a range of shapes from extreme thinness to morbidly obese. Color images of the women and the men figural stimuli were printed on separate placards (Figures 1 and 2) [5]. SurveyThe verbally administered survey consisted of demographic information, including age, marital status, parity, and education level, as well as body image questions. Participants used Figural Stimuli to report the current body image (CBI) that most closely resembled the participant at this time ; an Ideal Body Image (IBI), and a body image that appeared most healthy and least healthy. Participants were asked to identify the CBI that most closely resembled his or her spouse/significant other. The survey was conducted in English, the official language of Ghana where the literacy rate in 2003 for those aged 15 years and older is reported to be 82.7 for men and 67.1% for women [12] Anthropometric measurementsAnthropometric measurements were obtained on the participants wearing lightweight street clothes without shoes. Weight was measured on a calibrated portable Salter scale to the nearest 0.1 kg. Height was measured with a metal tape measure to the nearest 0.5 cm with the participants standing upright with the head in the Frankfurt position [13]. Body mass index (BMI) was defined as BMI < 18.5 kg/m2 underweight; 18.5 – 24.9 kg/m2 normal weight; 25.0 – 29.9 kg/m2 overweight; and > 30.0 kg/m2 obese [14]. EligibilityGhanaian men and women age 18 years and older were randomly selected at public bus stops and marketplaces in Accra and requested to participate in the survey. Verbal consent was obtained and the interviews were conducted in English by the investigators. Pregnant women and lactating mothers were not included in the study. Statistical analysisThe data was coded and entered into SPSS version 13 for Windows (SPSS, Inc., Chicago, IL.). Analysis included frequency distributions, a dissatisfaction score (CBI-IBI), Fisher’s exact test one sided, ANOVA linear regression analysis, multinomial logistic regression, and binary logistic regression analysis. A p-value of 0.05 was considered significant. The strength of association is expressed as the Odds Ratio with a 95% confidence interval. Institutional reviewsThe Committee for Clinical Investigations, Beth Israel Deaconess Medical Center and the Institutional Review Board, Harvard Medical School approved the study. Results Demographic characteristics A total of 123 men and 62 women completed the study conducted between July and August 2005. Table 1 outlines the demographic characteristics of the participants. There was no significant difference between the two groups when compared for age distribution, marital status, and education level or body mass index. Current body imageThe majority of men selected a model that represented a thin (17.9%) or normal (74.0%) BMI as their current body image. Only 8.0% related their CBI with an overweight or obese model. The mean BMI for the cohort was 25.0 + 4.6 (range 17.4 – 40.4). Most of the women selected a representation of a normal BMI (56.4%), while 6.4% selected a thin model and 37.1 selected an overweight or obese model as her CBI. The mean BMI for the women was 25.6 + 5.7 (range 18.4 – 53.7). There is a significant correlation between an increase in the mean BMI with an increase in size of the figure selected as the CBI for both men (adjusted r2 = 0.172, p=0.001) and women (adjusted r2 = 0.496, p=0.001). A comparison of CBI and BMI is shown in Table 2 for men and women. In addition, 51.6% of men reported their wife or significant other to be of a figure in the normal range while 65.3% of women reported their husband to be in the normal range (p=NS). U Dissatisfaction score for men and womenThe dissatisfaction score is defined as the difference between the current body image and the ideal body image. Men were significantly more likely to be satisfied with their CBI than women (43.9% vs. 22.6%, respectively, OR 1.12 [1.03-1.20], p=0.003). Most of the women selected a smaller IBI than her CBI (46.8%, range 1 to 5 figure difference) compared to men (38.2%, range 1 to 7). Women were significantly more likely to change their CBI to improve their overall health compared to the men (76.9% vs. 50.4%, respectively, OR 2.97 [1.31 – 6.71], p=0.009). Women were asked additional health improvement questions and 70.4% would change their CBI to a smaller size to reduce the risk of hypertension (70.4%) and diabetes (72.2%). Neither age, body mass index, level of education or marital status was significantly associated with the dissatisfaction score. Difference in gender perceptions of ideal body image for women Table 3 shows the comparison of men’s and women’s selections for ideal body image, healthiest body image and least healthy body image for women and the men’s perception of what they thought women would select as their IBI. The majority of men (69.7%) chose one of the three models (numbers 4, 5 and 6) that represents the normal BMI as their IBI for a Ghanaian woman compared to 56.5% of women who selected the same three figures as a Ghanaian woman’s IBI (p=NS). However, when men were asked to select the figure they thought women would select as ideal, only 44.7% thought that women would prefer a figure in the normal BMI range (p=0.05 difference between men’s perception and women’s choice of IBI). There was no significant statistical difference between men’s and women’s choices for the healthiest and least healthy appearing women’s model. Table 4 shows the comparison of men’s and women’s selections for ideal body image, healthiest body image and least healthy body image for men. A total of 79.9% of men and 83.9% of women selected a model that represented a normal BMI as the IBI for a Ghanaian man (p=ns). There was also no significant difference between men’s and women’s selections of healthiest male figures. Women were significantly more likely to select number 12 that represents morbid obesity and men were significantly more likely to select number 1 that represents extreme thinness as the least healthy models (p=0.012). There was a borderline significant statistical difference in women’s perceptions of the IBI men wanted for themselves (p=0.057). Almost twice as many women than men (19.4% vs. 9.8%, respectively) selected an overweight or obese model as the preferred IBI for men. Discussion The intent of this pilot study of randomly selected men and women was to investigate gender based perceptions of body size among urban Ghanaian men and women living in Accra. We found that very few men or women interviewed selected a model representing an obese BMI as the ideal for either a Ghanaian man or woman. The difference in the perception of what the opposite gender considered as the ideal body image was significant for the men. Fewer men reported that women considered the IBI to be normal or slim than women selected as the ideal body image, indicating that men felt women preferred to be large. Similarly, more women indicated that men preferred to be of a larger size than what men actually indicated was the ideal body image for men. This observation did not reach statistical significance; most likely because of the small size of the cohort of women in this study or that perhaps women do more accurately predict which body size men would prefer for themselves. As expected, significantly more women were dissatisfied with their CBI than men and more women were more likely to change their CBI if it would improve their health. The mean BMI of men was in the normal range and that of the women was in the overweight range although the difference did not reach statistical significance. It would be interesting to determine if, in a larger cohort, whether or not the BMI would influence the dissatisfaction score. Since in many households women are responsible for the health maintenance of the family, it is no surprise that they would take the steps necessary to improve health. The majority of men and women selected a figure with a normal body weight as their CBI and this corresponded well to the calculated BMI based on the height and weight measurements. The ability of the figural stimuli to serve as a reliable predictor of obesity has been widely used in epidemiologic investigations as an adjunct to measured or self-reported height and weight [15]. A figural stimuli scale is a highly robust model that is highly correlated with a measured weight and is easy to administer self-report of body image [7]. The figure that was chosen with most frequency as the ideal body image for men was also chosen by both men and women as being the most healthy for men. The model selected with most frequency for ideal body image for women was one figure larger than the model selected with most frequency as the most healthy. This suggests that the participant’s concept of an ideal body image includes an association with good health. Ideas on what constitutes the least healthy body image varied by gender. Women had a stronger association of obesity with poor health for both men and women, while men had a stronger association of being underweight with poor health for men and of obesity with poor health for women. A more extensive survey of 305 Ghanaian women to determine their preferences of the ideal, healthiest and least healthy body image of Ghanaian women was conducted at the Korle Bu Teaching Hospital of the University of Ghana, Accra [5]. These women were recruited at the gynecology and radiology clinics to participate in an extensive survey that included many decision analysis questions and represents women who seek health care in comparison to the participants of the current study that were selected in a non-medical environment. The medical clinic study found that 60.2% of women selected a model that represented a normal BMI for the IBI and 65.3% selected the same figures for the healthiest body image, which is comparable to the results from this study of women selected in a non-medical environment. However, 69.1% women interviewed at the medical clinics selected number 12 (morbidly obese) and 23.2% selected number 1 (extreme thinness) as the least healthy model while the 32.3% of women interviewed in a non-medical environment selected number 12 and 43.5% selected number 1 as the least healthy model. This may reflect an increase awareness of obesity-linked illnesses in those who seek medical care in comparison to a cohort selected from the general population. Women who participated in the survey in the medical clinic also reported a strong interest in reducing BMI for a healthier life [6]. The limitations of this study that precludes generalization to the Ghanaian urban population include the small number of both men and women participants, the restriction of the survey language to English, the relatively uniform BMI of Ghanaian men – although the author’s observation is that most men are of a normal BMI, and the relatively high level of education for both groups. Future body image assessments would be designed to include a larger and more varied cohort of both men and women. ConclusionMost men in this study prefer women in the thin to normal BMI range as their ideal image of women. It was also shown that most women selected their ideal body image of men to be in the same thin to normal range. It is evident from this study that while women perceived that men preferred a larger BMI for women and men perceived that women wanted a larger BMI for herself, both genders actually prefer an IBI in the thin to normal BMI range for Ghanaian women and men. References
Copyright 2007 - African Forum for Health Sciences The following images related to this document are available:Photo images[jh07008t4.jpg] [jh07008t3.jpg] [jh07008t1.jpg] [jh07008f2.jpg] [jh07008t2.jpg] [jh07008f1.jpg] |
| |||||||||