 |
| About Bioline | All Journals | Testimonials | Membership | News |
|
||||||
|
||||||
African Journal of Health Sciences, Vol. 14, No. 3-4, Jul-Dec, 2007, pp. 171-186 Inequalities in selected health-related Millennium Development Goals indicators in all WHO Member States Doris G. Kirigia1* and Joses M. Kirigia2 1University of New South Wales, School of Public Health and Community Medicine,
Faculty of Medicine, Indigenous Health Unit, Sydney, Australia{kirigiadoris@yahoo.com.au};
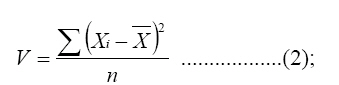
Code Number: jh07026 SUMMARY The objective of this study was to quantify inequalities in selected Millennium Development Goal (MDG) indicators in all the 192 WHO Member States using descriptive statistics, the Gini coefficient and the Theil coefficient. The data on all the indicators were obtained from The World Health Report 2004. The main findings were as follows: (i) generally, all the MDG indicators are significantly worse in low-income countries than in the other three income groupings; (ii) for all the MDG indicators, there are inequalities within individual countries, within the four income groups, and across income groups of countries; (iii) the inequalities in the MDG indicators are higher among the low-income countries than in high-income countries; and (iv) the ranking of income groups, by various indicators, is fairly stable whether one employs the Gini coefficient or Theil coefficient. As Member States strive to expand the effective coverage of strategies and interventions (including health promotion, primary and secondary prevention, treatment, and care) geared at reducing child mortality; improving maternal health; combating HIV/AIDS, malaria and TB; and ensuring environmental sustainability (through reduction in the use of solid fuels and expansion in access to improved water and sanitation), it is vitally important to ensure that they are implemented in a manner that redresses the inequalities in various MDG indicators. Thus, it is vital for countries to systematically monitor not only the changes in various MDG indicators but also the inequalities across the various income quintiles. In addition, at the regional and global levels, it is necessary to set up mechanisms for rigorous monitoring of the inequalities in the MDG indicators across the income groups of countries. The lessons learnt from the monitoring processes should inform the design and targeting of the various MDG-related policies, strategies and interventions with a view to eradicating the inequalities. Introduction In 2000, the United Nations General Assembly adopted the Millennium Declaration containing eight Millennium Development Goals (i.e. eradicate extreme poverty and hunger; achieve universal primary education; promote gender equality and empower women; develop a global partnership for development; reduce child mortality; improve maternal health; combat HIV/AIDS, malaria and other diseases; ensure environmental sustainability) and 18 targets [1].The analysis reported in this paper focuses on the latter four MDGs. The UN Millennium Declaration was made about 20 years after the Alma-Ata Declaration, which was made at the International Conference on Primary Health Care (PHC), September 1978 in Alma-Ata, former Union of Soviet Socialist Republics [2]. The UN Millennium Declaration heralds a return to the contents, philosophy and spirit of the PHC Declaration. At the core of both the UN Millennium Declaration and the PHC Declaration lies a strong concern with inequalities in health status and socio-economic well-being. This is clearly demonstrated in these words from the PHC Declaration [2]: “the existing gross inequality in the health status of the people particularly between developed and developing countries as well as within countries is politically, socially and economically unacceptable…” (p. 2). The purpose of this study is to answer the following question: What is the magnitude of inequalities in the health-related MDG indicators? Our preoccupation with health emanates from the fact that improved health is not just an end in itself but also an essential means of reducing poverty and achieving sustained economic growth. Thus, it is important to ensure that MDG-related interventions strive to promote and maintain equity and equality within and between income groupings of countries. The specific objective of this study was to quantify the inequalities in selected MDG indicators in all the 192 WHO Member States using descriptive statistics and the Gini and Theil coefficients. Methods The usual statistical measures of inequality include the range, the variance, the coefficient of variation, the Gini coefficient of the Lorenz curve, the Theil coefficient, etc [3]. Range The range (R) of a sample of observations of data (Xi) is a measure of dispersion. It indicates how spread out the data observations is. It is defined as the difference between the largest (Max Xi) and smallest (Min Xi) observations in a sample: R = (Max Xi - Min Xi )........................................(1) If a given health-related variable is equal across all the countries, then clearly R = 0. Otherwise, the value of R should fall between 0 and the largest observation in a sample. The larger the value of R, the larger the inequality between the largest and the smallest observation. The limitation of this measure is that it focuses exclusively on the two extreme values of the distribution. In other words, it ignores the distribution in- between the extremes [4]. Variance Variance is a measure of the dispersion of a series of
given values from their arithmetic mean. It is calculated in five steps: (i)
obtain the arithmetic mean; (ii) subtract the mean The formula for the sample variance (V) is:
Where: X is the variable, ∑ is simply an instruction to
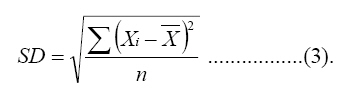
sum all the values of X, Standard deviation The standard deviation (SD) is a measure of dispersion of a series of given values from their arithmetic mean; all values are taken into account [5]. It is the square root of the variance, expressed in the units of the original observations:
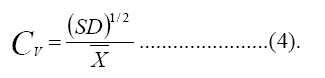
The larger the SD, the larger the inequality in the distribution of the variable under consideration. Coefficient of variation Coefficient of variation (C) is the standard deviation (or square root of the variance) divided by the mean of X [5]:
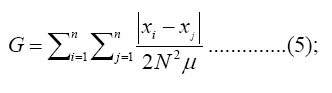
The Cv provides a relative measure of data dispersion compared to the mean. It may be reported as a simple decimal value or as a percentage. A small value of Cv implies that data scatter compared to the mean is small; in other words, the inequalities in the distribution of X are small. On the other hand, when the Cv is large compared to the mean, the amount of variation (or inequality) is large. Cv passes the Pigou-Dalton test, which states that a transfer from a richer man (or country) to a poorer person (or country) always reduces the value of C or inequality in the aspect under consideration. Gini coefficient This study uses the Gini coefficient to measure inequalities in both health indicators and determinants for each of the four income groupings. It is the most frequently used measure of inequality in income distribution studies. The Gini coefficient ranges from 0 (perfect equality) to 1 (total inequality). It can be estimated using the following formula [6]:
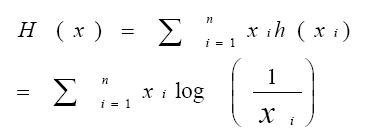
where G = Gini coefficient; ∑ = summation sign; x = the variable (e.g. male healthy life expectancy at birth) whose Gini Coefficient is being estimated; μ = average of value of variable x; N = number of countries; xi and xj are variable x values for any two of the N countries. In taking differences over all pairs of X, the Gini coefficient avoids the total concentration on differences vis-à-vis the mean which V, SD or Cv has. Like the coefficient of variation, the Gini coefficient passes the Pigou-Dalton test, which states that a transfer from a richer man (or country) to a poorer person (or country) always reduces the value of G or inequality in the aspect under consideration. Theil’s entropy measure According to Sen and Foster [3], where there are n possible events 1,...,n , we take the respective probabilities xi, ..., xn, such that xi ≥ 0 and ∑n i=1 xi = 1. The entropy or the expected information content of the situation can be viewed as the sum of information content h (x) of each event weighted by the respective probabilities:
The closer the n probabilities xi are to T = log n - H (x) = ∑n i=1 xi log nx i. ....(6) Data This paper uses four indicators of child health, namely: percentage of children under five years of age; underweight for age; infant mortality rate per 1000 live births under-five mortality rate per 1000 live births and percentage of one-year-olds immunized against measles. We have used maternal mortality ratio per 100 000 live births as an indicator for maternal health and the percentage of births attended by skilled health personnel as a proxy of maternal care availability and accessibility. Concerning HIV/AIDS, tuberculosis and malaria, we have employed the percentage of 15-49-year-olds who are HIV positive; malaria-related mortality rate per 100 000; and tuberculosis (TB) prevalence per 100 000 as proxies of the burden of disease attributable to the trio. In addition, we have used the percentage of TB cases detected under DOTS and the percentage of TB cases cured under DOTS as indicators of availability and effectiveness of diagnostic and treatment facilities for TB. The proxies used for environmental sustainability include: the percentage of the population using solid fuels; the percentage of urban population with sustainable access to an improved water source; the percentage of rural population with sustainable access to an improved water source; the percentage of urban population with access to improved sanitation; and the percentage of rural population with access to improved sanitation. Definitions of the aforementioned indicators are provided in Table 1. The World Health Report 2004 [7] had data on the abovementioned indicators for all the 192 WHO Member States. Of the Member States, 27% are in the European Region; 24% in the African Region; 18% in the Americas Region; 14% in Western Pacific Region; 11% in the Eastern Mediterranean Region; and 6% in the South East Asia Region (see Table 2). Countries were divided into four categories (high-income, upper middle-income, lower middle-income and low-income) using the World Bank per capita Gross National Income (GNI) classification. In these categories, 20% of the Member States are high-income; 20% are upper middle-income; 29% are lower middle-income; and 32% are low-income. Table 2 shows the distribution of WHO Member States per region by income group. The statistical measures of inequality (range, variance, coefficient of variation, Gini and Theil inequality coefficients) for each of the income groupings were estimated using STATA statistical software. Results Maternal, newborn and child health Goal 4: Reduce child mortality In 2002, globally, childhood diseases (pertussis, poliomyelitis, diphtheria, measles and tetanus) caused 1.124 million deaths. Of those deaths, 46.91% occurred in the African Region, 0.42% in the Americas Region, 34.83% in the South East Asia Region, 0.53% in the European Region, 13.64% in the Eastern Mediterranean Region and 3.65% in the Western Pacific Region [7]. Nutritional deficiencies caused 485 000 deaths in 2002, the majority of which occurred among children. Of the nutritional deaths, 29.60%, 12.62%, 38.9%, 2.47%, 10.98% and 5.42% occurred in the African Region, the Americas Region, South East Asia Region, European Region, Eastern Mediterranean Region and Western Pacific Region, respectively [7].
Source: WHO [19].
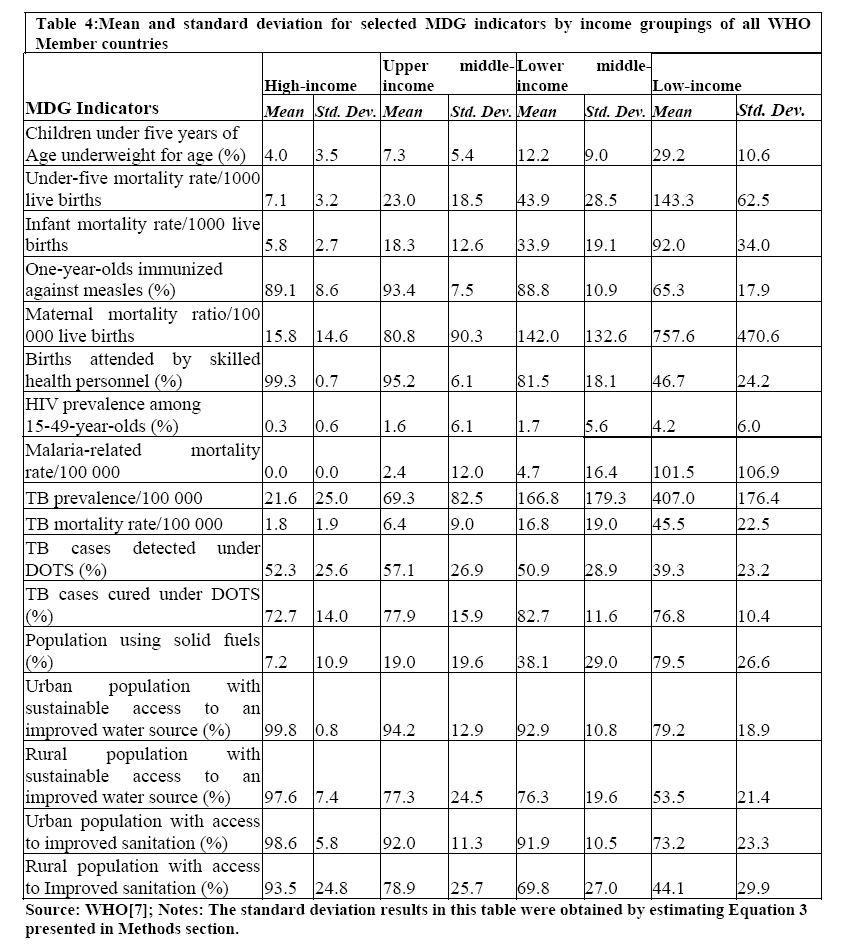
Range, mean standard deviation, variance, coefficient of variation Table 3 presents the range of the aforementioned four indicators of child health. It is clear that the range increases as one moves from the high-income to low-income countries. With regard to the percentage of children under five years of age underweight for age, the range among the low-income countries is four times that of high-income countries. Concerning infant mortality rate per 1000 live births, the range among the low-income countries is 19 times that of high-income countries. For under-five mortality rate per 1000 live births, the range among the low-income countries is 14 times that of high-income countries. And finally, regarding percentage of one-year-olds immunized against measles, the range among the low-income countries is twice that of high-income countries. The larger values of range among lower-income countries compared to high-income countries imply that the inequalities in the four indicators are largest among the low-income countries. Table 4 shows the mean and standard deviation for selected MDG indicators by income groupings of all WHO Member States. The percentage of children under five years of age underweight for age is seven times higher in low-income countries compared to high-income countries. The standard deviation among the low-income countries is three times that of high-income countries. The infant mortality rate per 1000 live births for low-income countries is 16 times higher than that of high-income countries. The standard deviation among the low-income countries is 13 times that of high-income countries. Table 3: The range for health-related millennium development goals indicators by income group
Note: The range results in this table were obtained by estimating Equation 1 presented in Methods section. The under-five mortality rate per 1000 live births in low-income countries is 20 times higher than that in high-income countries. The standard deviation among the low-income countries is 20 times that of high-income countries. The percentage of one-year-olds not immunized against measles in low-income countries is three times higher than that of high-income countries. The standard deviation among the low-income countries is twice that of high-income countries. In general, the standard deviation in the four child health indicators increases as one moves from the high-income to low-income countries. Table 6 presents the Gini and Theil coefficients (and 95% confidence intervals) for selected MDG indicators by income groupings of all WHO Member States. The respective Gini and Theil coefficients for children under five years of age underweight for age among the four income groupings can be arranged as follows: HIG > UMIG > LMIG > LI G and HIT > UMIT > LMIT > LI T. Where HIG depicts Gini coefficient for high-income countries; UMIGis Gini coefficient for upper middle-income countries; LMIG is Gini coefficient for lower middle-income countries; LI G is Gini coefficient for low-income countries; HIT depicts Theil coefficient for high-income countries; UMIT is Theil coefficient for upper middle-income countries; LMIT is Theil coefficient for lower middle-income countries; LI T. is Theil coefficient for low-income countries;. Thus, the inequalities of children under five years of age underweight for age are higher among high-income countries than the other three groups. The Gini and Theil coefficients for under-five mortality rates for the four income groupings can be ranked as follows: UMIG > LMIG > LI G > HIGand UMIT > LMIT > LI T. > HIT. Similarly, the Gini and Theil coefficients for infant mortality rates for the various income groupings can be expressed as follows: UMIG > LMIG > HIG > LI Gand UMIT > LMIT > HIT > LI T. . The under-five and infant mortality rates are highest among upper middle-income countries. The Gini Theil coefficients for one-year-olds immunized against measles in the disparate income groupings can be expressed as follows:LI G >LMIG> HIG > UMIG and LI T. >LMIT >HIT > UMIT The inequalities in one-year-olds immunized against measles are highest among the low-income countries vis-à-vis other income groups. In 2002, globally, maternal conditions resulted in 510 000 deaths. Of those deaths, 45.37%, 3.26%, 33.56%, 0.55%, 13.17% and 4.09% occurred in the African Region, the Americas Region, South East Asia Region, European Region, Eastern Mediterranean Region and Western Pacific Region, respectively [7]. Perinatal is the period from the 28th week of pregnancy to the end of the first week after birth. Perinatal mortality is a statisticalexpression of the number of stillbirths and infant deaths occurring during the first week after birth. Perinatal conditions caused 2.462 million deaths; 22.52%, 7.10%, 41.16%, 2.67%, 12.33% and 14.21% of those deaths occurred in the African Region, the Americas Region, South East Asia Region, European Region, Eastern Mediterranean Region and Western Pacific Region, respectively [7]. Range, standard deviation, variance, coefficient of variation The maternal mortality ratio (MMR) range increases as one moves from high-income to low-income countries. For example, the range among upper middle-income countries is seven times higher than that of the high-income countries; 13 times higher among lower middle-income countries than the high-income countries; 35 times higher among low-income countries compared to high-income countries. Therefore, there are more pronounced inequalities in maternal mortality ratios among the low-income countries than among the other three income categories. Goal 5: Improve maternal health Again, the range in percentage of births attended by skilled health personnel seems to be inversely associated with income grouping. In other words, the degree of inequalities in percentage of births attended by skilled health personnel is lowest among the high-income countries compared to low-income countries. For instance, the range among the upper middle-income countries is 11 times higher than that of high-income countries; 30 times higher among lower middle-income countries compared to high-income countries; 44 times higher among low-income countries compared to high-income countries. The MMR per 100 000 live births for low-income countries is 48 times higher than that of high-income countries. The MMR standard deviation increases as one moves from high-income to low-income countries. For example, the standard deviation among upper middle-income countries is six times higher than that of the high-income countries; nine times higher among lower middle-income countries than the high-income countries; 32 times higher among low-income countries compared to high-income countries. In a nutshell, there are more pronounced inequalities in maternal mortality ratios among the low-income countries than among the other three income categories. The percentage of births not attended by skilled health personnel for low-income countries is 76 times higher than that of high-income countries. The standard deviation in percentage of births attended by skilled health personnel seems to be inversely associated with income grouping. In other words, the degree of inequalities in percentage of births attended by skilled health personnel is lowest among the high-income countries compared to low-income countries. For instance, the standard deviation among the upper middle-income countries is nine times higher than that of high-income countries; 26 times higher among lower middle-income countries compared to high-income countries; 35 times higher among low-income countries compared to high-income countries. The Gini and Theil coefficients for maternal mortality ratios among the various income groupings can be ranked as follows: UMIG > LMIG > HIG > LI Gand UMIT > LMIT > HIT > LI T The inequalities in maternal mortality ratios are highest among the upper middle-income countries. The Gini and Theil coefficients for percentage of births attended by skilled health personnel among the four income groups can be expressed as follows: LI G > LMIG >UMIG > HIG and LI T > LMIT > UMIT > HIT The inequalities in percentage of births attended by skilled health personnel are highest among the low-income countries. HIV/AIDS, malaria and other diseases Goal 6: Combat HIV/AIDS, malaria and other diseases Globally, HIV/AIDS caused 2.777 million deaths in 2002. Of those deaths, 75.50%, 3.72%, 15.68%, 1.30%, 1.58% and 2.22% occurred in the African Region, the Americas Region, South East Asia Region, European Region, Eastern Mediterranean Region and Western Pacific Region, respectively [7]. Tuberculosis resulted in a total of 1.566 million deaths in 2002; 22.23%, 2.93%, 38.27%, 4.37%, 8.82% and 23.37% of those deaths occurred in the African Region, the Americas Region, South East Asia Region, European Region, Eastern Mediterranean Region and Western Pacific Region, respectively [7]. Malaria caused 1.272 million deaths in 2002, and 89.33%, 0.12%, 5.11%, 0.01%, 4.59% and 0.85% of those deaths occurred in the African Region, the Americas Region, South East Asia Region, European Region, Eastern Mediterranean Region and Western Pacific Region, respectively [7]. The African Region bears the heaviest burden of malaria-related mortality. The majority of these deaths occur among children under the age of five years [10]. Table 5: Variance and coefficient of variation for selected MDG indicators by income groupings of all WHO Member countries
"Note: The variance and coefficient of variation results in this table were obtained by estimating equations 2 and 4 presented in Methods section". Range, standard deviation, variance, coefficients of variation The HIV prevalence (%) among 15-49-year-olds is 14 times higher in low-income countries than in high-income countries. HIV prevalence range among 15-49-year-olds in high-income countries is 4%. The prevalence range is 9 times, 7.8 times and 7.5 times higher in upper middle-income, lower middle-income and low-income countries than in high-income countries. The malaria-related mortality rate per 100 000 is 102 in low-income countries compared to almost zero in high-income countries. The range in malaria-related mortality ate per 100 000 is zero in high-income countries. The range in low-income and lower middle-income countries is 6 times and 1.5 times that of upper middle-income countries. Tuberculosis prevalence per 100 000 in low-income countries is 19 times higher than that of high-income countries. The range of TB prevalence per 100 000 people in the high-income countries is 137. Comparatively, the TB prevalence range of upper middle-income, lower middle-income and low-income countries is 3.2, 6.2 and 5.5 times higher than that of high-income countries. The range of TB mortality rate per 100 000 is 10 in high-income countries. The range is 4.9 times higher in upper middle-income countries; 9.1 times higher in lower middle-income countries; and 10.6 times higher in low-income countries. The range in percentages of TB cases detected and cured under DOTS are lowest among low-income countries compared to other income categories. HIV prevalence standard deviation among 15-49-year-olds in high-income countries is 0.6%. The prevalence standard deviation is 10 times, 9 times and 10 times higher in upper middle-income, lower middle-income and low-income countries than in high-income countries. The standard deviation in malaria-related mortality rate per 100 000 is zero in high-income countries compared to 107 in low-income countries. The standard deviation of TB prevalence per 100 000 people among the high-income countries is 25. Comparatively, the TB prevalence standard deviation of upper middle-income, lower middle-income and low-income countries is 3.3, 7.2 and 7.1 times higher than that of high-income countries. Tuberculosis mortality rate per 100 000 among low-income countries is 25 times higher than that of high-income countries. The standard deviation of TB mortality rate per 100 000 is 1.9 in high-income countries. The standard deviation is 4.7 times higher in upper middle-income countries; 10 times higher in lower middle-income countries; and 11.8 times higher in lower-income countries. About 61% of tuberculosis cases are not detected under DOTS in low-income countries compared to 48% of cases in high-income countries. The standard deviation in percentages of TB cases detected and cured under DOTS are lowest among low-income countries compared to other income categories. The Gini and Theil coefficients for the percentage of 15-49-year-olds who are HIV-positive among the four income groups can be expressed as follows: LMIG > UMIG >LI G >HIG and LMIT > UMIT >LI T > HIT . Where HIG The inequalities in the distribution of 15-49-year-olds infected by HIV are highest among lower middle-income countries compared to the other income groups. The Gini and Theil coefficients for malaria-related mortality rates among the four income groups can be expressed as follows: LMIG > UMIG >LI G >HIG and LMIT > UMIT >LI T > HIT . Where HIG Inequalities in the distribution of malaria-related mortality rates are highest among lower middle-income countries vis-à-vis the other income groups. The Gini and Theil coefficients for TB mortality rates among the four income groups can be expressed as follows: and. Inequalities in the distribution of TB mortality rates are highest among upper middle-income countries vis-à-vis the other income groups. The Gini and Theil coefficients for TB cases cured under DOTS among the four income groups can be expressed as follows: UMIG > LMIG > HIG > LIG and UMIT > LMTI > HIT > LIT Inequalities in the distribution of TB cases cured under DOTS are highest among lower middle-income countries compared to the other income groups. Environmental Health Goal 7: Ensure environmental sustainability Diarrhoeal diseases and some of the tropical diseases are partly attributed to lack of improved water and sanitation facilities and poor personal and domestic hygiene [17]. Environment-related diseases led to 1.798 million deaths in 2002. In terms of distribution, 39.38%, 3.14%, 33.58%, 0.92%, 14.40% and 8.59% of those deaths occurred in the African Region, Americas Region, South East Asia Region, European Region, Eastern Mediterranean Region and Western Pacific Region, respectively [7]. Six tropical diseases (i.e. trypanosomiasis, Chagas’ disease, schistosomiasis, leishmaniasis, lymphatic filariasis, onchocerciasis) caused 129 000 deaths in 2002. Of those deaths, 43.32%, 12.22%, 28.18%, 0.11%, 12.21% and 3.97% occurred in the African Region, Americas Region, South East Asia Region, European Region, Eastern Mediterranean Region and Western Pacific Region, respectively [7]. Intestinal nematodes (ascariasis, trichuriasis, hookworm disease) caused 3728 deaths in 2002; 31.7%, 12.87%, 36.53%, 0.47%, 8.17% and 10.25% of those deaths occurred in the African Region, Americas Region, South East Asia Region, European Region, Eastern Mediterranean Region and Western Pacific Region, respectively [7]. We have utilized the percentage of the population using solid fuels; the percentage of the urban population with sustainable access to an improved water source; the percentage of the rural population with sustainable access to an improved water source; the percentage of the urban population with access to improved sanitation; and the percentage of the rural population with access to improved sanitation as proxies for environmental sustainability. Table 6: Inequality statistics for selected MDG indicators by income groupings of all WHO Member countries
"Note: The Gini and Theil Coefficients in this table were obtained by estimating equations 5 and 6 presented in Methods section". Range, standard deviation, variance, coefficient of variation About 93% of the population in high-income countries do not use solid fuels compared to 21% in low-income countries. Generally, the range and standard deviation in percentage of population using solid fuels increases as one moves from high-income countries to low-income countries. This is not surprising since wood and wood products are the main fuels for cooking and heating houses in low-income countries. The percentage of urban populations without sustainable access to an improved water source in low-income countries is 104 times higher than that of high-income countries. The range in percentage of urban populations with sustainable access to an improved water source is only 3% among high-income countries. Compared to high-income countries, it is 20 times higher in upper middle-income countries; 19 times in lower middle-income countries; and 27 times in low-income countries. The percentage of rural populations without sustainable access to an improved water source in low-income countries is 19 times higher than that of high-income countries. The range in percentage of rural populations with sustainable access to an improved water source is 29% in high-income countries. Compared to high-income countries, it is 2.8 times higher in upper middle-income countries; 2.9 times in lower middle-income countries; and 3 times higher in low-income countries. The standard deviation in percentage of urban populations with sustainable access to an improved water source is 16 times higher in upper middle-income countries; 14 times higher in lower middle-income countries; and 24 times higher in low-income countries compared to high-income countries. The standard deviation in percentage of rural populations with sustainable access to an improved water source for low-income countries is 3 times higher than that of high-income countries. The percentage of urban populations without access to improved sanitation in low-income countries is 19 times higher than that of high-income countries. The range in percentage of urban populations in high-income countries with access to improved sanitation is 24% compared to 88% among low-income countries. The mean and standard deviation in upper middle-income, lower middle-income and low-income countries are 1.9, 1.8 and 4 times higher than that of high-income countries, respectively. Therefore, inequalities in access to improved sanitation among the urban dwellers are much higher among the upper middle-income, lower middle-income and low-income countries compared to the high-income countries. The percentage of rural population without access to improved sanitation in low-income countries is nine times higher than that of high-income countries. The range of rural populations in high-income countries with access to improved sanitation is 96% compared to 99% among low-income countries. The magnitude of inequality in access to improved sanitation is about equally high across the different income groupings of countries. The Gini coefficients for the percentage of population using solid fuels among the four income groups can be expressed as follows:UMIIG > LMIIG > HIIG > LIIG Theil coefficients for the percentage of population using solid fuels among the four income groups can be expressed as follows: UMIT > HIT > LMIT > LIT. The inequalities in the distribution of population using solid fuels, as measured in the Gini and Theil coefficients, are highest among upper middle-income countries compared to the other income groups. The respective Gini and Theil coefficients for proportions of urban and rural populations with sustainable access to an improved water source among the four income groups can be expressed as LIG >UMIG > LMIG > HIG and LIT >UMIT > LMIT > HIT. Both coefficients indicate that the inequalities in the distribution of proportion of urban and rural populations with sustainable access to an improved water source are highest among low-income countries vis-à-vis the other income groups. The respective Gini and Theil coefficients for proportions of urban population with access to improved sanitation among the four income groups can be expressed as LIG >UMIG > LMIG > HIG and LIT >UMIT > LMIT > HIT.. Both coefficients indicate that the inequalities in the distribution of proportion of urban population with access to an improved sanitation are highest among low-income countries vis-à-vis the other income groups. The respective Gini and Theil coefficients for proportions of rural population with access to improved sanitation among the four income groups can be expressed as LIG >UMIG > LMIG > HIG and LIT >UMIT > LMIT > HIT.. Both coefficients indicate that the inequalities in the distribution of proportion of rural population with access to improved sanitation are highest among low-income countries vis-à-vis the other income groups. Discussion Goal 4 & 5: Reduce child mortality & Improve maternal health World Health Assembly resolution on maternal, newborn and child health interventions In May 2005, the World Health Assembly adopted a resolution entitled ‘Working towards universal coverage of maternal, newborn and child health interventions’ [8]. The resolution urges Member States: (a) “To commit resources and accelerate national action towards universal access and coverage with maternal, newborn and child health interventions, through reproductive health care; (b) To establish or sustain national and international targets, and to establish monitoring mechanisms for measuring progress towards the achievement of agreed goals, particularly target on universal access to reproductive health care by 2015; (c) To involve all key stakeholders, including civil society organizations and communities, in setting priorities, developing plans and programmes, measuring progress and evaluating impact; (d) To improve the quality and completeness of vital registration and other relevant household-survey data, where appropriate, to reflect mortality differentials among mothers, infants and under-fives; (e) To adopt and implement, in line with international agreements, the legal and regulatory frameworks to promote gender equality and protect the rights of women and children, including equal access to health care with special attention for those thus far excluded, particularly the poor, the marginalized and the underserved; (f) To ensure that national strategic-planning and budgetary processes include interventions at political and programme level to strengthen health-care delivery systems for effective and rapid advance towards universal coverage.” (p. 2). The WHO Commission for Macroeconomics and Health (CMH) identified a number of cost-effective interventions for reducing childhood morbidity and mortality: integrated management of childhood illnesses, immunization, treatment of severe anaemia, outreach services (immunization campaigns, outreach IMCI, home management of fever, outreach micronutrients and deworming) and multisectoral interventions (e.g. improving quality of private drug sellers, school deworming and micronutrients; policies on indoor air pollution, information, regulation, food fortification with iodine, iron, folic acid and zinc). Concerning maternal and perinatal health, CMH proposes emergency obstetrics care, skilled birth attendance, antenatal and postnatal care, and family planning [9]. Therefore, as countries strive to implement the World Health Assembly resolution and the CMH recommendations, it is important that they proceed in a manner that helps to alleviate the maternal and child health inequalities within and across countries. Goal 6: Combat HIV/AIDS, malaria and other diseases World Health Assembly on combating of HIV/AIDS, malaria and tuberculosis HIV/AIDS In 1999, the Fifty-second World Health Assembly Ministerial Round Table discussed a document entitled ‘HIV/AIDS: strategies for sustaining an adequate response to the epidemic’ [11]. The Assembly recommended that the following points should be taken into account by countries when formulating a strategy for the control of HIV/AIDS: the control of sexually-transmitted infections; blood for transfusion should be screened for HIV and clinicians should be trained in the appropriate use of blood and blood products in order to reduced unnecessary transfusion; voluntary counselling and testing is the starting point for prevention and care; treatment and prevention of common HIV-related illnesses need to be integrated into district level care; prevention interventions for injecting drug users should include needle exchange, condom supply and psychosocial care; health promotion strategies to educate communities and to empower women so that they can protect themselves should be rapidly developed and implemented; staff training; alternatives and complements to hospital care (e.g. day, hospice, and home care) need to be developed within a functioning referral system; partnerships linking health providers with the community (nongovernmental organizations, community-based organizations, etc) need to be established; strategies to sustain an effective response to HIV/AIDS need to build on the principles of health care reform; creation of a favourable environment for effective responses to HIV/AIDS [11]. In 2001, the Fifty-fourth World Health Assembly adopted a resolution entitled ‘Scaling up the response to HIV/AIDS’ [12]. Among other actions, the resolution urged Member States, “to take effective measures, within a supportive environment, to ensure that people everywhere, particularly young people, know how to avoid infection, and to facilitate access to services and methods of prevention which should be the mainstay of programmes” (p. 2). By this the Assembly was urging Member States to leverage health promotion strategies (e.g. health information, health education, screening, individual risk assessment and social marketing) in order to bring about positive behavioural change among the populations. The Member States and partners (including the Global Fund to Fight AIDS, Tuberculosis and Malaria [GFATM]) ought to ensure that HIV/AIDS-related resource allocation and implementation of prevention and control interventions are implemented in an equitable manner. Malaria In May 1998, the Director-General of WHO initiated a new effort to roll back malaria, which subsequently evolved into the Roll Back Malaria movement, with emphasis on partnership, evidence-based action, political mobilization and participation of civil society. The movement encourages national authorities, development partners, research groups and civil society organizations to curb malaria morbidity and mortality through widespread use of insecticide-treated materials, early effective treatment of people with suspected malaria, and reliable prediction of possible malaria epidemics with effective and rapid response to reduce the risks of illness and death [13]. In December 2005, the United Nations General Assembly adopted a resolution entitled ‘2001-2010: decade to roll back malaria in developing countries, particularly Africa’ [14]. The resolution calls upon the international community to meet the financial needs of the GFATM through country-led initiatives to create conditions for insecticide-treated mosquito nets, insecticides for indoor residual spraying for malaria control, and effective antimalarial combination treatments to be fully accessible, including free distribution of such nets where appropriate. It appeals to the international community to assist States, in particular malaria-endemic countries, to implement sound national plans to control malaria in a sustained and equitable way that contributes to health system development. Tuberculosis In 1994, a new framework for effective TB control was developed and a global strategy called DOTS (directly-observed treatment short-course) was introduced [15]. Due to the increasing impact of HIV on incidence of TB and the new multidrug-resistance, WHO has produced an expanded strategic framework to reinforce the five essential components of the DOTS strategy [16]:
As countries implement the DOTS-plus strategy, it is imperative that they do it in an equitable way. Goal 7: Ensure environmental sustainability World Health Assembly on environmental matters In 1998, the Fifty-first World Health Assembly discussed an agenda item entitled ‘Environmental matters: strategy on sanitation for high-risk communities’ [18]. The Assembly argued that with the persisting low sanitation coverage, the high prevalence of diseases caused by poor environmental conditions, low investment in sanitation, and rapid population growth and urbanization, a new approach to sanitation was considered to be the best course of action. The strategy, among other actions, urged Member States to focus on communities at high risk from diseases related to unsanitary conditions [18]: “identify and give high priority to high-risk communities and subgroups in urban and rural areas according to existing health statistics; support and participate in research on sanitation methods and technology especially suited to the needs of communities in difficult geographical and social conditions; and ensure the suitability of sanitation services through programmes of meaningful community involvement, stimulating community action and self-help, and remaining sensitive to cultural and ecological needs” (p. 5). The strategy also urged Member States, international development organizations and nongovernmental organizations to give higher priority to sanitation in national planning for health and investment in infrastructure [18]: “begin a sanitation promotion programme to increase political will at every level; establish priorities in the preparation of national action plans for health and environment, and integrate them firmly into programmes for implementation; integrate sanitation with as many other aspects of development as possible, e.g. child survival, maternal and child health, communicable disease control, essential drugs and agricultural development” (p. 5). It is critically important to ensure that all future environmental health investments consciously strive to bridge the environmental infrastructural gaps between the different income groups. Way forward The Fifty-eighth World Health Assembly resolution [19] on accelerating the achievement of MDGs requests Member States to: prioritize MDGs in national development and health plans, Poverty Reduction Strategy Papers and medium-term expenditure frameworks; increase the level of funding for MDG-related health interventions; implement fully the various World Health Assembly resolutions on MDG components, e.g. reproductive health and HIV/AIDS; strengthen collaboration and partnership among relevant sectors and international financial institutions; improve health and nutrition information systems, including strengthening of vital registration systems, supported by critical health-systems research; ensure that health and development policies are underpinned by a gender analysis and strive for gender equality and women’s empowerment; strengthen equity in development efforts and facilitate the empowerment and participation of the population in decision-making processes; address the human resource crisis; strengthen the core functions of public or private components of health systems, as appropriate, in line with the Declaration of Alma-Ata so that they contribute to the delivery of better and more equitable health outcomes in the areas relevant to the health-related MDGs.In order to achieve the health and health-related MDGs, there is need for lower middle-income countries and low-income countries to revive their political and financial commitment to the content of the Declaration of Alma-Ata. Primary Health Care (PHC) still remains the key to attaining the health and health-related MDG goals and targets and to reducing the gap between the MDG indicators of high-income, upper middle-income, lower middle-income and low-income countries of the world. According to the Declaration, PHC [2]:
Over 20 years after the passing of the Declaration of Alma-Ata [2], the United Nations Millennium Declaration [1], heralds a positive return to the PHC contents, philosophy and spirit. Almost all lower middle-income countries and low-income countries invest a pittance in PHC that would otherwise be providing cost-effective promotive, preventive, curative and rehabilitative services to a majority (over 80%) of their populations. Ironically, the majority of the financial, human (specialists, doctors, pharmacists, diagnosticians, nurses) and physical resources are concentrated in tertiary and regional hospitals in urban areas, where less than 20% of their populations live. The majority of health sector resources go to tertiary and secondary curative care, where the returns in terms of quality adjusted life years gained or deaths averted are relatively small compared to the potential returns from PHC investments. Community participation in the planning, organization and operation of health services is very weak. There is continuous attrition of human resources for health through premature deaths as well as internal and external migration. There has been almost singular ignorance of the paramount role of other sectors (e.g. agriculture, animal husbandry, food, industry, education, housing, public works, transport, communications) in health development; even though their contribution to health development is greater than that of the health sector. As a result, the health sectors in lower middle-income countries and low-income countries continue to treat poor (or near-poor) people and then send them back to unhealthy environments characterized by hunger, inadequate housing and infrastructure, unsafe water, inadequate sanitation, high illiteracy levels, and harmful traditional practices (e.g. female genital mutilation, wife inheritance). In a short time, these patients are re-infected and have to go back for more treatment: the vicious cycle of sickness-treatment-sickness-treatment continues. The only way to break this cycle and achieve the MDGs is by investing the majority of the national and international financial, human and physical resources in the implementation of PHC. Conclusion This study quantified inequalities in selected MDG indicators in all the 192 WHO Member States using descriptive statistics as well as the Gini and Theil coefficients. The key findings are: (i) generally all the MDG indicators are significantly worse in low-income countries than in the other three income groupings; (ii) for all the MDG indicators there are inequalities within individual countries, within the four income groups, and across income groups of countries; (iii) the inequalities in the MDG indicators are higher among the low-income countries than in high-income countries; and (iv) the ranking of income groups by various indicators is fairly consistent whether one employs the Gini or Theil coefficient. Member States are striving to expand the effective coverage of strategies and interventions geared at reducing child mortality; improving maternal health; combating HIV/AIDS, malaria and TB; and ensuring environmental sustainability through reduction in the use of solid fuels and expansion in sustainable access to both improved water sources and sanitation. It is vitally important that countries implement such strategies and interventions in a manner that redresses the inequalities in various MDG indicators. The current unfortunate state of high debility, morbidity and mortality from the double-burden of communicable (e.g. HIV/AIDS, TB, malaria, avian flu) and noncommunicable diseases (e.g. cardiovascular diseases, diabetes, cancer) in lower middle-income countries and low-income countries is largely due to a dearth of investments in cost-effective PHC. Judicious implementation of PHC (with a strong foundation of health promotion strategies, methods and approaches [20]) would protect the majority of the people from falling sick; it would also assist in early identification of people who do fall sick, allowing them to obtain treatment at low-cost PHC facilities (e.g. district hospitals, health centres, dispensaries, health posts, etc.) and avert future high costs of treatment, care and rehabilitation. The Fifty-fourth World Health Assembly resolutions WHA54.13 and WHA54.11 provide further guidance to Member States, the international community and multilateral institutions on other actions that need to be taken to strengthen health systems in developing countries [21] and to promote equitable access to medicines [22]. Finally, the Alma-Ata vision of health-for-all or universal coverage (i.e. equity in access to quality health services and financial risk protection for all) cannot be attained when majority of the poor and near-poor cannot access PHC due to financial barriers, including catastrophic and impoverishing direct out-of-pocket health services costs [23]. Therefore, it is critically necessary for all Member States to increase the extent of prepayment and reduce the reliance on all types of out-of-pocket payments [24]. This calls for development of more extensive and equitable tax-based systems, social health insurance-based systems or combinations of prepayment systems [25]. Acknowledgement We are immensely grateful to Joe Kadhi for commendable editorial support. LNK Muthuri provided valuable research assistance to the study. The authors are profoundly indebted to Jehovah Nissi for inspiration and all round support at all stages of this study. The paper has benefited greatly from the WHO World Health Assembly resolutions and documentation. This article contains the views of the authors only and does not represent the decisions or the stated policies of the University of New South Wales or the World Health Organization. References
© Copyright 2007 - African Forum for Health Sciences The following images related to this document are available:Photo images[jh07026t4.jpg] | |||||||||||||||||||||||||||||||||||||||||||||||||||||||||||||||||||||||||||||||||||||||||||||||||||||||||||||||||||||||||||||||||||||||||||||||||||||||||||||||||||||||||||||||||||||||||||||||||||||||||||||||||||||||||||||||||||||||||||||||||||||||||||||||||||||||||||||||||||||||||||||||||||||||||||||||||||||||||||||||||||||||||||||||||||||||||||||||||||||||||||||||||||||||||||||||||||||||||||||||||||||||||||||||||||||||||||||||||||||||||||||||||||||||||||||||||||||||||||||||||||||||||||||||||||||||||||||||||||
| |||||||||