 |
| About Bioline | All Journals | Testimonials | Membership | News |
|
||||||
|
||||||
Journal of Postgraduate Medicine, Vol. 48, Issue 3, 2002 pp. 218-225 Monitoring the Injured Brain in the Intensive Care Unit Gupta AK Department of Neuro Critical Care, Addenbrooke's Hospital, Cambridge, UK. Code Number: jp02076 Abstract: The primary aim of managing patients with acute brain injury in the intensive care unit is to minimise secondary injury by maintaining cerebral perfusion and oxygenation. The mechanisms of secondary injury are frequently triggered by secondary insults, which may be subtle and remain undetected by the usual systemic physiological monitoring. Continuous monitoring of the central nervous system in the intensive care unit can serve two functions. Firstly it will help early detection of these secondary cerebral insults so that appropriate interventions can be instituted. Secondly, it can help to monitor therapeutic interventions and provide online feedback. This review focuses on the monitoring of intracranial pressure, blood flow to the brain (Transcranial Doppler), cerebral oxygenation using the methods of jugular bulb oximetry, near infrared spectroscopy and implantable sensors, and the monitoring of function using electrophysiological techniques. (J Postgrad Med 2002;48:218-225) Key Words: Intracranial pressure, cerebral perfusion, cerebral oxygenation, electrophysiology, multimodal monitoring. The pathophysiological mechanisms which cause brain injury are complex.1 While continued research in the basic and clinical sciences is making these mechanisms more clearly understood, with current knowledge it is clear that there is little that we can do to reverse the primary damage caused by an insult. However, one of the major factors influencing outcome in patients with acute brain injury is the additional brain damage caused by secondary cerebral insults such as hypoxia and ischaemia.2,3 These secondary insults may cause permanent neurological damage and worsening of outcome if undetected and untreated. The purpose of continuous monitoring of the brain in the critical care unit is to detect these secondary insults, allowing for a more informed approach to treatment. Although serial cranial imaging such as computerised tomography (CT) or functional magnetic resonance imaging (fMRI)) provides useful information, they are neither continuous nor bedside monitors. Continuous invasive arterial blood pressure monitoring in addition to pulse oximetry, temperature, end tidal carbon dioxide and urine output should be included as part of standard general monitoring of brain injured patients. In addition, techniques specific to the central nervous system are also required. The most common and easily performed clinical monitor is the Glasgow Coma Score, which provides a universally adopted means of measuring central nervous system (CNS) depression. Brain specific methods of monitoring reflect pressure within the cranial cavity (intracranial pressure, ICP), changes in brain oxygenation and metabolism (jugular venous oxygen saturation, near infrared spectroscopy, brain tissue monitoring, cerebral haemodynamics (transcranial Doppler) and electrical activity of the CNS. This review will give an outline of these specific methods of monitoring.
Intracranial Pressure Monitoring Intracranial pressure (ICP) is defined as the pressure within the rigid cranial vault relative to atmospheric pressure. Normal intracranial pressure ranges between 5-15 mmHg, and has two components - a vasogenic (vascular) component and a cerebrospinal fluid (CSF) component. Measurement of ICP allows:
In the majority of centres, management of acute brain injury is CPP directed (pressure-driven) with some evidence suggesting that optimizing CPP improves outcome.6
Methods of Measurement The most common sites for ICP measurement are intraventricular and intraparenchymal, although extradural and subdural sensors are occasionally used. Intraventricular drains allow direct measurement of ICP by inserting a catheter into the ventricular system which is connected to an external pressure transducer. These may be inserted at the bedside in ICU or in the operating theatre and have the added advantage of allowing CSF withdrawal when ICP rises. However, insertion of the ventricular catheter may be difficult or impossible in case of advanced brain swelling, and after three days of monitoring the risk of infection increases significantly. In the case of continuous CSF drainage, continuous intraventricular measurement of ICP may become unreliable . Modern ventricular, subdural or intraparenchymal microtransducers reduce infection rates and have excellent metrical properties.7 The intraparenchymal systems may be inserted through a support bolt or tunnelled subcutaneously from a burr hole either at the bedside or post craniotomy. Subdural catheters are easily inserted following craniotomy but measurements are unreliable and liable to blockage. Extradural probes are less reliable and less specific due to uncertainty about the relationship between ICP and pressure in the extradural space. Intracranial pressure measurement has not been shown in a prospective controlled trial to improve outcome. However it would now be impossible to conduct such a study ethically. Although it is accepted that ICP is essential in management of CPP directed therapy, the appropriate threshold of CPP is still to be determined.
Jugular Venous Oximetry Blood from the venous sinuses of the brain drains into the internal jugular vein, and although it was traditionally believed that the majority of venous blood drained into the right internal jugular vein, there is some data to suggest that supratentorial venous drainage is less lateralised than previously thought.8 Monitoring of oxygen saturation in jugular venous blood gives an estimate of the balance of global oxygen delivery and cerebral metabolism (oxygen consumption). The technique involves inserting a retrograde catheter into the internal jugular vein and advancing it cephalad beyond the outlet of the common facial vein into the jugular bulb at the base of the skull (Figure 3). Correct placement is confirmed when the catheter tip is level with the mastoid air cells on the lateral neck radiograph (level with the bodies of C1/C2). Aspiration of blood from the jugular bulb should ideally be representative of mixed cerebral venous blood. Although there is no evidence that cannulation of the internal jugular vein on one side is any better than the other,9 it is common practice to cannulate the right internal jugular vein. Measurements of jugular venous oxygen saturation (SjvO2) can be made by intermittent sampling or continuous monitoring after insertion of a fibreoptic catheter. The normal range for SjvO2 is 60-75%, and desaturations (indicating potential cerebral ischemia) of less than 50% have been associated with a worsened outcome in head injury.10 Table 1 summarises the factors contributing to changes in SjvO2. Intermittent sampling allows estimation of arteriovenous oxygen difference and lactate, which will help give an indication of global cerebral oxygenation and metabolism. Increases in arteriojugular differences in oxygen content to greater than 9ml/dl also provides a useful marker of inadequate cerebral blood flow (CBF) and may help guide therapy.11 Continuous SjvO2 monitoring will detect episodes of desaturation associated with raised ICP, hyperventilation therapy, hypotension and cerebral vasospasm. However, up to half of measured desaturations below 50% may be false positives.10 The major limitation of SjvO2 monitoring is that it is a global measure of cerebral oxygenation. As a result, smaller areas of ischaemia may not be detected unless of sufficient magnitude to affect global brain saturation. Regional ischaemia may therefore be missed. Other inaccuracies may occur if the catheter is not accurately placed or if blood sampling is too rapid. The continuous fibreoptic catheters may give inaccurate readings if impacted against the vessel wall or if thrombosis occurs on the catheter tip and the sensor may need frequent recalibrations. Despite these limitations SjvO2 monitoring is an important tool both in the clinical management of acute brain injury and also for studying cerebral physiology.
Near Infrared Spectroscopy The principle of Near Infrared Spectroscopy (NIRS) is based upon the fact that light in the near infrared red range (700-1000 nm) can pass through the skin, bone and other tissues relatively easily. When a beam of light is passed through brain tissue, it is both scattered and absorbed (Figure 4). The absorption of near infrared light is proportional to the concentration of certain chromophores, notably iron in haemoglobin and copper in cytochrome aa3. Oxygenated haemoglobin (HbO2), deoxygenated haemoglobin (Hb) and cytochrome aa3 have different absorption spectra, depending on the substances' oxygenation status. Changes of concentration of near infrared light as it passes through these compounds can be quantified using a modified Beer-Lambert law, which describes optical attenuation. The main advantage of NIRS is that it is a non-invasive method of estimating regional changes in cerebral oxygenation. However, the clinical use of NIRS is limited by its inability to differentiate between intracranial and extracranial changes in blood flow and oxygenation which adversely affects the reliability of the readings.12 The validation of this technique in neuro intensive care still requires further work.
Brain Tissue Oximetry Insertion of sensors directly into brain tissue to continuously measure brain tissue oxygenation has gathered considerable interest over the last decade. With recent technological advances, two commercially available sensors have been produced. One sensor measures only brain tissue oxygen tension using a polarographic Clarke type electrode, whilst the other multiparameter sensor measures brain tissue oxygen (PbO2), carbon dioxide (PbCO2) and pH using fibreoptic technology (Figure 5). Both of these methods have the ability to measure brain temperature using a thermocouple. Both sensors are approximately 0.5 mm in diameter and can be inserted through a craniotomy intraoperatively or through a specially designed bolt allowing insertion and fixation to the skull in the intensive care unit. A recent study validating in vivo measurements of the multiparameter sensor against values of cerebral end capillary oxygen tension derived from Positron Emission Tomography found that absolute values of these two variables did not correlate, which was to be expected, although the changes in measured values in response to hyperventilation did correlate.13 Furthermore there is evidence to show that brain tissue sensors detect changes in regional oxygenation which would otherwise be missed using conventional jugular bulb oximetry.14 With a mounting body of clinical data from many centres and the limitations of jugular bulb oximetry described above, the use of implanted brain tissue sensors to give a continuous measure of regional brain oxygenation is increasingly regarded as a useful and reliable monitoring tool by many authorities. This technique is a focal method of monitoring tissue oxygenation, and although ideally should be placed in the penumbral area, it is often difficult to place it with such accuracy at the present time.
Microdialysis The technique of cerebral microdialysis allows continuous and on-line monitoring of changes in brain tissue chemistry. In common with brain tissue oxygenation monitoring, microdialysis involves inserting a fine catheter (diameter 0.62 mm) into the brain. The catheter is lined with a polyamide dialysis membrane and is perfused with a physiological solution (e.g. Ringer's) at ultra-low flow rates (0.1-2.0 mcl/min) using a precision pump, allowing measurement of the concentration of chemicals in the extracellular space of the brain. Molecules below the cut-off size of the semipermeable membrane (approximately 20000 Daltons) diffuse from the extracellular space into the perfusion fluid, which is then collected into vials that are changed every 10 to 60 minutes. The collected dialysate is then analysed by sensitive assays. In theory, any substance small enough to diffuse through the dialysis membrane can be measured,15 but the key substances can be categorised as follows: 1. Energy related metabolites e.g. glucose, lactate, pyruvate, adenosine, xanthine. The lactate/pyruvate ratio is a better marker of ischaemia, than lactate alone.16 2. Neurotransmitters - glutamate, aspartate, GABA 3. Markers of tissue damage and inflammation - glycerol, potassium, cytokines 4. Exogenous substances - administered drugs Continuous on line measurement of glucose, lactate, pyruvate, glutamate and glycerol can be achieved using a CMA600 microdialysis analyser (CMA Microdialysis, Stockholm, Sweden). Good correlation has been shown between the CMA600 analyser and the gold standard of High Performance Liquid Chromatography (HPLC).17 Cerebral microdialysis has been applied to patients in many different clinical situations including head injury, subarachnoid haemorrhage, epilepsy, ischaemic stroke, tumours and during neurosurgery.18 In patients with severe head injury derangements in metabolism have been associated with reductions in brain glucose and elevation of the lactate:pyruvate ratio during periods of intracranial hypertension and cerebral ischaemia. Wide variations in the concentration of the excitatory amino acids glutamate and aspartate have also been detected, with extremely high and toxic levels in secondary ischaemia and contusions. During aneurysm surgery, changes in concentration of glucose, lactate, pyruvate and glutamate have been demonstrated during cerebro-spinal fluid drainage, brain retraction and temporary clipping. Epileptic foci in the temporal lobe are associated with elevated glutamate and reduced g-amino-butyric acid levels prior to seizures and increases in both amino acids during seizures. An evolving application of microdialysis is its use in measuring drug concentrations in brain parenchyma, and potentially using this method to directly administer drugs into targeted areas.19 Although the use of microdialysis as a reliable tool for routine clinical practice in neuro intensive care is not established as yet, its role as a research tool is undeniable.
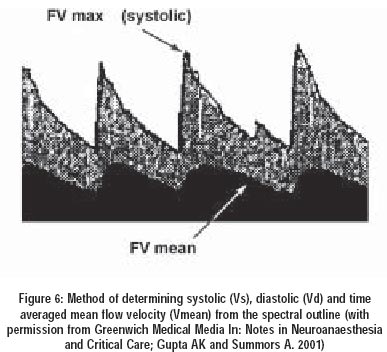
Transcranial Doppler Ultrasonography Transcranial Doppler Ultrasonography (TCD) is a non-invasive monitor providing indirect information of cerebral blood flow in one of the major arteries in the base of the brain. A 2 MHz pulsed ultrasound signal is transmitted through the skull (usually through the temporal bone) and using the Doppler shift principle measures red cell flow velocity (FV). Insonation of one of the arteries (most commonly the middle cerebral artery (MCA)) produces an arterial waveform giving information on systolic, diastolic and mean blood flow velocity (Figure 6). The mean flow velocity (FVmean) is a weighted mean velocity that takes into account the different velocities of the formed elements in the blood vessel insonated and normally has a mean value of 55 + 12cm/s in the MCA. Changes in FV correlate closely with changes in CBF provided the angle of insonation (the angle between the axis of the vessel and the ultrasound beam) and the diameter of the vessel insonated remain constant.20,21 The shape of the envelope of the Doppler spectrum from peak systolic flow to end diastolic flow with each cardiac cycle is known as the waveform pulsatility. In the absence of vessel stenosis or vasospasm or changes in arterial blood pressure or blood rheology, the pulsatility reflects the distal cerebrovascular resistance. This resistance is usually quantified by the Pulsatility Index (PI or Gosling index) = (FVsys - FVdias)/ FVmean. The PI (normal PI ranges from 0.6 to 1.1) has been shown to correlate better with CPP than ICP. One of the most useful applications of TCD in neurointensive care is in the diagnosis of high velocity states such as cerebral vasospasm or hyperaemia. The differentiation between the two conditions is important in order to target therapy more appropriately. Flow velocities of greater than 120 cm/s after insonating the MCA is considered significantly high.22 If the ratio of MCA flow velocity to extracranial internal carotid flow velocity (Lindegaard ratio) is greater than 3, vasospasm is the likely diagnosis,23 whereas if mean MCA FV >120cm/s and the Lindegaard ratio is less than 3, hyperaemia is diagnosed. TCD when compared with angiography for the middle cerebral artery shows high levels of specificity and positive predictive value for vasospasm. Following traumatic brain injury, TCD monitoring can be used to observe changes in FV, waveform pulsatility and for testing cerebral vascular reserve. Currently a lot of work is being done to investigate the application of TCD as a non-invasive estimation of ICP or CPP. Although this work is in its early stages there has been limited success in correlating CPP derived from TCD with invasive CPP measurement.24 In addition, by continuous recording of the FVmca, the autoregulatory `threshold' or `break point' (the CPP at which autoregulation fails) can be easily detected, providing a target CPP value for treatment.. Autoregulation can be tested by response of the TCD trace to vasopressor infusion (static autoregulation) or thigh tourniquet deflation (dynamic). Electrophysiology An electroencephalogram (EEG) represents spontaneous electrical activity of the cerebral cortex and is generated mainly by summation of excitatory and inhibitory post-synaptic potentials of cortical neurones. It does not reflect activity in subcortical levels, cranial nerves or the spinal cord. The electrical activity is recorded from scalp electrodes placed according to the 10-20 Electrode System (Figure 7) - where the interelectrode distances are either 10% or 20% of the patient's head circumference, interaural distance, or nasion-inion distance. The electrical signal is amplified, filtered and then displayed as either 8 or 16 channels (8 channels per hemisphere) to give an accurate representation of electrical activity throughout the cortex. EEG activity is usually interpreted in terms of frequency (Table 2), amplitude, and location (focal or generalised activity). To facilitate continuous EEG monitoring several automated EEG processing systems have been developed.
The EEG is an important and frequently used tool in the investigation and management of epilepsy which aids in confirming the diagnosis, classify the seizure disorder and identify a focal or lateralised epileptogenic source. Early detection of subclinical seizures with EEG in ICU may help reduce mortality and morbidity in status epilepticus.25 Continuous EEG monitoring is also useful in detecting ischaemic cerebral events, including vasospasm following sub-arachnoid haemorrhage (SAH) and intracranial hypertension after head injury.26 Certain EEG features are associated with a poor outcome and in some cases may be useful in predicting eventual survival. Various grading systems have been developed based on the presence or absence of these features (Table 3). Grades I and II are associated with a good outcome, grade III an intermediate prognosis, grades IV and V are associated with a very poor outcome. Specific conditions relevant to ICU can be diagnosed using EEG monitoring. For example, temporal paroxysmal lateralising electrical discharges are indicative of Herpes Simplex encephalitis, whilst paroxysmal bursts of 2-3 Hz indicate subacute sclerosing panencephalitis. In sedated patients, EEG may help in detection of focal neurological disease especially in those who cannot be examined fully and in patients too unwell to undergo neuroradiological imaging. Metabolic suppression using intravenous anaesthetic agents may be monitored using CFM, where burst suppression or isoelectricity is a useful endpoint to obtain maximal suppression of cortical electrical activity.
Multimodality Monitoring The concept of multimodal monitoring involves continuous monitoring of more than one parameter using two or more of the techniques described above. This helps to overcome the limitations of each individual method of monitoring thereby enabling more accurate analysis of changes in the measured parameters. For example, a detected rise in ICP may be due to a rise in cerebral blood volume due to hyperaemia or cytotoxic oedema as a result of ischaemia. Multimodal monitoring helps in differentiating the two causes of a rise in ICP as shown in Figure 8. Figure 8a demonstrates a rise in ICP associated with a rise in flow velocity measured by TCD, indicating hyperaemia. However, in figure 8b the rise in ICP is associated with a simultaneous fall in flow velocity and jugular bulb oximetry, indicating hypoperfusion. It can be seen that without the other modalities in addition to ICP, the primary cause of the ICP rise may have been misinterpreted resulting in inappropriate intervention. All of the monitoring systems described above have the potential to give artefactual data to a varying degree, which may be difficult to identify in isolation. Although the multimodal approach increases the complexity and the potential to generate artefacts in the system, since each modality measures independent variables, the artefacts are unlikely to occur at the same time in each modality. The use of more than one method of monitoring will therefore help differentiate real events from an artefact. The use of multimodal monitoring has a number of disadvantages. Firstly, the more monitors used, the more expensive the system becomes. Secondly, large amounts of data will be generated from each monitor. This makes the system complex, requiring a technician or highly trained nursing staff to maintain the various modalities and ensure that the monitors are correctly placed at all times. This may be difficult when monitoring for a number of days in the intensive care unit. In addition, the data generated needs to be acquired in a format that allows quick and easy analysis. Computer support for downloading the data is an essential part of the system, further adding to the cost and labour intensity. Multimodal monitoring undoubtedly enhances the accuracy of interpretation of events and may help in targeting treatment more appropriately. As experience in these techniques grow it will become apparent which of these modalities are required to provide the most accurate reflection of intracranial events and monitor subsequent therapy.27,28
References
This article is also available in full-text from http://www.jpgmonline.com/ © Copyright 2002 - Journal of Postgraduate Medicine The following images related to this document are available:Photo images[jp02076f8b.jpg] [jp02076f3.jpg] [jp02076f8a.jpg] [jp02076f6.jpg] [jp02076t1.jpg] [jp02076f7.jpg] [jp02076t3.jpg] [jp02076t2.jpg] [jp02076f5.jpg] [jp02076f2.jpg] [jp02076f4.jpg] [jp02076f1.jpg] |
| |||||||||
