 |
| About Bioline | All Journals | Testimonials | Membership | News |
|
||||||
|
||||||
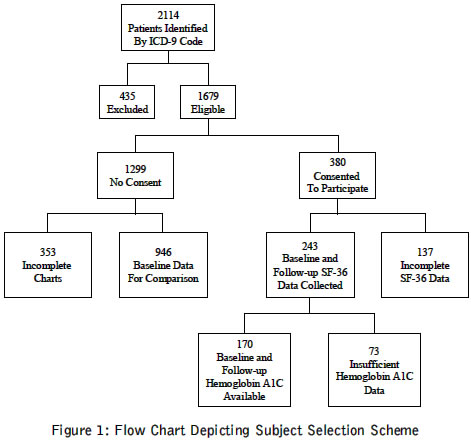
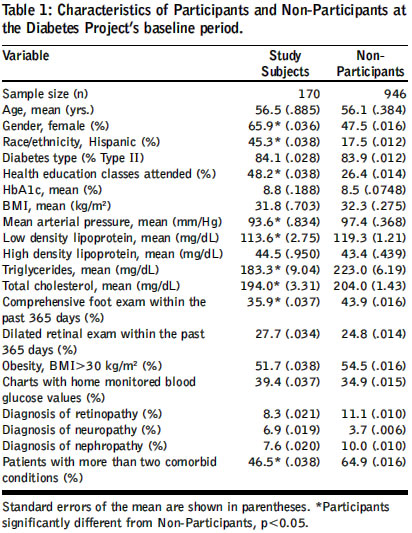
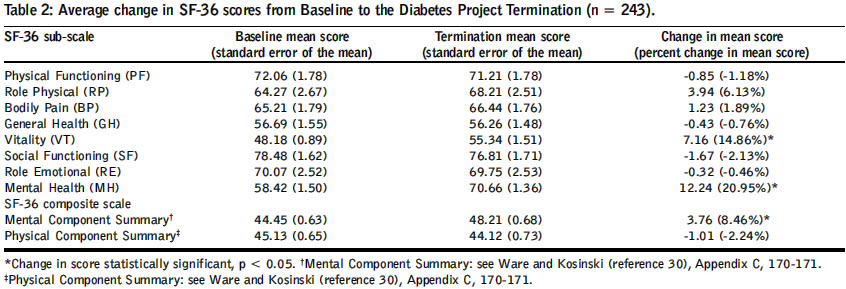
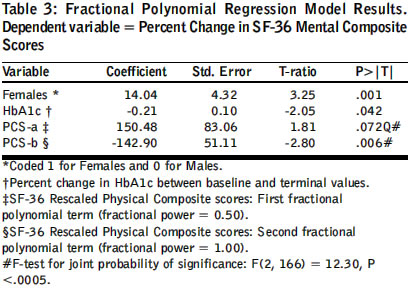
Journal of Postgraduate Medicine, Vol. 50, No. 3, July-September, 2004, pp. 189-194 Original Article Association between glycaemic control and quality of life in diabetes mellitus Lau Chuen-Yen, Qureshi AK, Scott SG Department of Epidemiology, University of California Los Angeles School of Public Health Code Number: jp04062 Abstract Background: Relationship between quality of life (QOL) and haemoglobin A1c (HbA1c) amongst diabetics in the community setting is unclear. Aims: Assess the association between QOL and change in HbA1c in diabetic patients over one year. Settings and Design: Cohort study of patients from four community clinics in California, USA. Methods: Diabetic patients identified from databases using International Classification of Disease (ICD-9) codes were asked to complete Short Form 36 (SF-36), which measures health-related QOL, and invited to attend monthly diabetes workshops. From December 2000 to December 2001, data were collected on multiple parameters, including HbA1c. SF-36 surveys were re-collected at project termination. Statistical Analysis: Regression analysis was used to correlate change in HbA1c with change in QOL physical component summary (PCS) and mental component summary (MCS) scores, while considering potential confounders. Results: Of 1679 eligible patients, 380 completed SF-36 at project initiation. 243 of those completed SF-36 at project termination. Pre and post HbA1c data were available for 170 of the 243 who completed SF-36 at both times. Average MCS increased by 8.46% and PCS decreased by 2.24%. After adjustment, a 5% decrease in HbA1c values was associated with a 1% increase in MCS. No association between changes in HbA1c and PCS was observed. Conclusions: Association between better HbA1c and improved mental, but not physical, QOL may reflect physical inconvenience of increased regimen complexity and mental empowerment from proactive disease management. Larger cohort studies with longer follow-up are needed to further elucidate the relationship between glycemic control and QOL. KEY WORDS: Glycemic control, Quality of life, SF-36, Diabetes Haemoglobin A1c (HbA1c) levels, which reflect diabetic control, are inversely correlated with diabetic complications.[1],[2] Directly quantifiable endpoints, such as microvascular disease, macrovascular disease and laboratory values, are typically assessed.[3],[4] However, these do not reflect patient′s quality of life (QOL). Furthermore, physician ratings of patient health do not correspond with patient ratings.[5] Since optimizing QOL is a major goal of treatment, the relationship between traditional measures of diabetic control and patient-perceived QOL should be elucidated.[6],[7] The relationship between glycemic control and QOL is unclear. A randomised controlled double-blind trial showed that improved HbA1c was associated with short-term improvement in QOL and economic benefits in Type II diabetes.[8] Several studies showed no association.[9],[10],[11],[12] The Diabetes Control and Complications Trial Research Group, which developed the Diabetes QOL measure (DQOL), showed no difference in QOL between intensive and conventional Type 1 Diabetes treatment groups, though the intensive treatment group had fewer microvascular complications and better HbA1c levels.[15],[16],[17] Studies using other measures have shown non-linear relationships or relationships within a subset of patients.[5],[16],[17],[18],[19],[20],[21],[22],[23] The calibrated difference in QOL between patients whose HbA1c decreases by 1.5 percentage points and those whose HbA1c increases by 1.5 percentage points may approach 50%.[24] Studies showing significant relationships tend to employ disease specific QOL measurements such as the DQOL, as opposed to general surveys like Short Form 36 (SF-36).[25] SF-36 provides more information about functional health status than DQOL, is appropriate for examining relationships between patient experience with diabetes, QOL and other chronic diseases, and is reliable and valid in assessment of diabetic health status.[26],[27],[28],[29] In this study, the relationship between glycemic control and QOL as measured by SF-36 was evaluated over one year. Since reduced symptoms of hyperglycemia may produce QOL benefits even over this short period, we hypothesised an inverse association between QOL and HbA1c over time. Materials and Methods The Institutional Review Board of St. Joseph Hospital, California, approved this study. Two proprietary databases were used to identify subjects. The first was that of the St. Joseph Heritage Medical Group, which consists of four clinics in Orange County, California, and the second was of La Amistad Family Health Center in Orange, California. Databases were searched for ICD-9 codes corresponding to a diagnosis of Diabetes Mellitus (DM) (250.0-250.9). 2114 patients with a diagnosis of DM were identified. Of the 2114, 435 patients were not eligible for various reasons: changed providers (106), died (31), disability (17), hospitalized (7), incorrect address (51), incorrect phone number (104), moved location (22), under 18 years of age (16), incorrect diagnosis (81). Consent letters were sent to the 1679 patients eligible for the study. 380 (22.6%) patients agreed to participate. [Figure - 1]. As part of the St. Joseph Health System′s Diabetes Disease Management Project, data were collected for subjects between December 2000 and December 2001. During this period, participants and non-participants were invited to monthly education workshops and providers attended monthly physician education conferences led by an endocrinologist. At initiation and completion of the project, QOL surveys (including SF-36) were collected from participants via phone. Medical chart abstraction of baseline data on the 380 participants was started in July 2000. To obtain comparative baseline data on non-participants, data on the 946 initially identified non-consenting patients (353 incomplete charts were rejected) were also abstracted. At project completion, percent change in QOL measures was correlated with percent change in HbA1c levels over the study course. Quality of Life: Health-related QOL for participants was measured using SF-36. SF-36 includes eight individual sub-scales (physical function, physical role, emotional role, social function, bodily pain, mental health, vitality and general health perceptions), one extra item (change in health status since last year) and two summary scales (physical summary and mental summary). A higher SF-36 score indicates better functioning. SF-36 was administered to project participants prior to initiation and at the completion of the project. Data obtained from SF-36 were scored via the instrument, authors′scoring algorithm, which does not simply average the domains, but involves several normalizations and transformations.[30] Due to attrition, paired (pre/post) SF-36 data on 243 (out of 380) project participants were available. Differences between pre and post SF-36 physical and mental composite scores (PCS and MCS) were computed and then converted into percent change scores for analysis. Glycosylated haemoglobin: Glycosylated haemoglobin was measured as HbA1c, the preferred standard for assessing glycemic control.[31] Data on all study patients who underwent HbA1c testing during calendar year 2001 were collected. These data were matched with HbA1c baseline data (extracted from charts) to identify patients with at least two available values: one at baseline (within 6 months before project initiation) and another during 2001. Chart extraction revealed that 243 (of 380) patients had a valid HbA1c value taken within six months of project initiation, while 264 (of 380) patients underwent HbA1c testing during the 12-month study period. Paired pre and post HbA1c values were available for 170 of the 243 patients with pre and post SF-36 data. Change in HbA1c values, the difference between the baseline and terminal value, were computed for each of these 170 patients. HbA1c change scores were converted into percent change scores for analysis. Other Factors: To compare the profiles of participants and non-participants, as well as to control for possible confounders, several other factors were measured. These were age, gender, ethnicity, diabetes type, health education class attendance, weight, body mass index, obesity (body mass index >30 kg/m2, mean arterial pressure, lipid profiles, home glucose monitoring, foot exam within one year, retinal exam within one year, retinopathy, neuropathy, and number of comorbidities.[32] To assess the number of comorbidities present, charts were evaluated for diagnoses or evidence of the following ten conditions: 1) Angioplasty, 2) Coronary artery bypass surgery, 3) Coronary artery disease, 4) Congestive heart failure, 5) Hypertension, 6) Peripheral vascular disease, 7) Obesity, 8) Stroke, 9) Erectile Dysfunction and 10) Dyslipidemia. Statistical Analysis Regression models were used to evaluate the impact of change in HbA1c and all other factors on change in SF-36 physical and mental component scores. To minimize ′regression to the mean effect′, a weighted regression model was used. The standard deviation of the SF-36 scores (computed from pre and post scores) was used to compute analytic weights for regression models. (Assigned weights were inversely proportional to standard deviation). Use of a Fractional Polynomial (FP) Regression model was required to accommodate the non-linear association between SF-36 PCS percent-change scores and MCS percent-change scores.[33],[34] The purpose of FP functions is to increase flexibility afforded by the family of conventional polynomial models. Although polynomials are popular in data analysis, linear and quadratic functions are severely limited in their range of curve shapes, whereas cubic and higher order curves often produce undesirable artifacts, such as "edge effects" and "waves." To find the best powers for the FP model, 44 model iterations were conducted. As a result, the variable representing percent-change scores(PCS) was rescaled and split into two FP terms: fractional powers equal 0.50 and 1.00, respectively. Rescaling is implemented to improve numerical stability when fitting FP models (details on rescaling are available from authors upon request). An F-test was used to evaluate the joint statistical significance of the two FP terms in the model. Finally, Ramsey′s Test[35] was used to check for model misspecification and Cook-Weisberg Test[36] for homogeneity of model variance. As the time intervals between pre and post HbA1c values varied over the study sample, a vector was included in the FP Regression model to control for this varying time interval between HbA1c testing. The time interval was measured as the number of calendar days between pre and post HbA1c testing. Results Participants and non-participants significantly differed on 9 of 20 indicators compared see [Table - 1]. Note that groups do not differ on baseline HbA1c, but that study subjects attended significantly more health education classes than non-participants. A total of 243 patients completed SF-36 at initiation and termination of the project. 137 patients who did not complete SF-36 at project termination showed no statistically significant differences in their baseline values for the following variables: age, gender, race/ethnicity, presence of microvascular diabetic complications (retinopathy, neuropathy, nephropathy), presence of more than two co-morbid conditions, HbA1c values, lipid panel values and baseline scores on SF-36 sub-scales or summary measures. Bias due to attrition is thus unlikely, at least with respect to the factors listed above. SF-36 Mental health composite and sub-scale scores increased significantly during the study period for the 243 patients with pre and post data. In contrast, no significant change was observed in the Physical health composite and sub-scale scores for these 243 patients. [Table - 2] shows results on summary-scales and sub-scales of SF-36. Note that SF-36 ′norms′established for the U.S. general population with diabetes report a mean score of 39.30 for the physical component and 47.90 for the mental component.[31] Comparison of means observed in this study with the U.S. norms show that the baseline MCS mean score of 44.45 is significantly lower than the U.S. norm of 47.90. In contrast, the baseline PCS mean score of 45.13 is significantly higher than the U.S. norm of 39.30. A salient result is that the mean change of 3.76 in MCS scores observed during this study is significantly higher than 0.18, the ′norm′for one-year MCS change scores reported for the U.S. general population with diabetes.[30] The mean change in SF-36 scores for the 170 patients with available data on pre and post HbA1c is not significantly different from the 73 patients who lack such matching data. Mean HbA1c values decreased significantly during the study period. For the 170 study patients with matching HbA1c data, mean HbA1c values decreased by 1.61 percentage points, from 8.81% at baseline to 7.20% at termination (p <.0005). Mean pre-study HbA1c values do not differ significantly between these 170 patients with matching data versus the 73 patients who lack such matching baseline data. Similarly, mean post-study HbA1c values do not differ significantly between these 170 patients with matching data versus the 73 patients who lack such data at project termination. Furthermore, there was no correlation between SF-36 scores and baseline HbA1c. Though HbA1c levels decreased on average, there was no significant change in PCS scores during the project. Therefore, no further analysis of change in PCS scores was undertaken. Comparison of initial and terminal SF-36 scores reveals significant improvements in the vitality and mental health sub-scales, as well as the MCS scores. Changes in HbA1c level, gender, percent-change in PCS scores, and QOL′s baseline MCS scores are significant predictors of percent-change in MCS scores. In contrast, age, race, presence of diabetic complications, number of co-morbidities and health education class attendance have no significant impact on percent-change in MCS scores. Similarly, time interval elapsed between pre and post HbA1c testing is not a significant predictor of percent change in MCS scores. The relationship between change in QOL and component SF-36 scores is consistent with these findings. For example, the mental health and vitality components of MCS are statistically significantly related to change in HbA1c. [Table - 3] shows detailed results of the FP Regression model used to accommodate the non-linear association between SF-36 PCS and MCS percent-change scores. After adjusting for baseline MCS scores via weighting, gender, and change in PCS scores, on average, a 5% (not percentage points) decrease in HbA1c is associated with a 1% increase in SF-36 MCS scores. On average, the difference between male and female subjects′ percent-change in MCS scores is 15%, with females showing greater improvement. The relationship between percent-change in PCS and MCS scores is non-linear, but generally positive in direction. For the most part, an increase in PCS percent change scores is associated with an increase in MCS percent change scores. Adjusted R-square for the FP Model equals 0.2452 [F (4,166)=14.48, p<0.0005], indicating that the model is well calibrated and fits better than what would be expected due to chance. Discussion As hypothesised, a decrease in HbA1c values was associated with a concomitant improvement in MCS scores over the study period. However, there is no evidence that a decrease in HbA1c values is associated with concomitant changes in PCS scores over one year. Increased regimen complexity required to achieve better glycemic control may negatively impact patients′perception of physical QOL. This may negate the potential for improvement in physical QOL due to better glycemic control over a one-year period, which is brief compared to the chronic course of diabetes. It is also plausible that an increased sense of empowerment, which facilitates coping, positively impacts the mental component of QOL.[37],[38] The significant and positive association between the change in PCS and MCS scores suggests that the concomitant improvement in mental QOL and decreased glycemic levels may be partially mediated through an improvement in physical QOL. Baseline PCS and MCS scores may impact the observed change in scores. Our sample′s mean baseline PCS score is significantly higher than that of the U.S. diabetic population, suggesting a possible ceiling effect. In contrast, the mean baseline MCS score is significantly lower than that of the U.S. diabetic population, availing it to catch-up growth. Nonetheless, reduction in symptoms of hyperglycemia, reflected by decreased HbA1c, might still increase PCS scores. Clinical significance of these findings is uncertain. Consistency with a previous randomised controlled trial suggests that they may be pertinent in the community clinic setting.[8] Patients with high initial HbA1c levels may, on average, realize greater improvements in MCS than those with a lower HbA1c level. However, study duration precludes formulation of long-term conclusions. Thus these findings provide stimulus for further research, rather than clinical recommendations. Due to observational design, causal interpretation of the results is not possible. Participants and non-participants differ significantly on half of the 20 indicators compared. For example, participants are more likely to be Hispanic than non-participants due to differential attrition amongst clinics. Though the model considered these factors, data are likely still insufficient to draw conclusions. Furthermore, co-morbidities affecting QOL, but independent of diabetes, were not considered in the model due to data limitations. Thus, although participants and non-participants are similar in some of the most important determinants of health related QOL, different populations may manifest a different relationship.[39] Furthermore, attrition or selection bias could bias results. Fortunately, this is unlikely since the analysis revealed no significant difference in pertinent factors between patients that completed SF-36 only at baseline compared to patients who completed SF-36 at both time points. The 137 patients who did not complete SF-36 at project termination show no statistically significant differences in their baseline values for: age, gender, race/ethnicity, presence of microvascular diabetic complications (retinopathy, neuropathy, nephropathy), presence of more than two co-morbiditites, attendance of health education classes, HbA1c values, lipid panel values and baseline scores on SF-36 sub-scales or summary measures. Finally, lack of a formal comparison group makes it difficult to attribute changes in QOL scores to changes in HbA1c levels. The observed relationship may be due to external environmental factors occurring contemporaneously. However, this study recruited patients from two very different clinical settings (managed care versus community clinic). Since the same statistical relationship between QOL and HbA1c was observed across these two groups, the chance of external environmental factors affecting the observed relationship is slight. A larger cohort study with minimal selection bias and longer follow-up would generate more clinically relevant findings and help elucidate the causal relationship between glycemic control, QOL and interventions. A larger sample facilitates more thorough consideration of confounders. Increased study duration might reveal a different relationship between QOL and diabetic control since benefit of fewer micro and macro-vascular complications takes many years to reap, while the inconveniences associated with tighter control are immediately apparent. Physical QOL parameters, which initially decreased, may actually improve with time. Mental QOL may manifest larger and more significant improvements. Conclusion Improved diabetic control is associated with improved mental, but not physical, QOL over a one year period in the community setting. This may reflect both mental empowerment garnered from proactive disease management and the burden of more complex anti-diabetic regimens. Larger, longer-term cohort studies are needed to further evaluate the relationship between glycemic control and QOL in the community. Since QOL has implications for productivity, psycho-social functioning and overall health, physicians must be cognizant of patient-perceived QOL when managing DM.[40],[41]Acknowledgements This work was funded via a grant sponsored by the UniHealth Foundation, Woodland Hills, CA. The authors thank Dennis Gauci, Patti Smith, Angela Acevedo, RNC, Mike Malouf, MD and Jeff Shafiroff, PhD who helped to obtain critical information; and the Staff of the La Amistad Family Health Center for their cooperation. References
Copyright 2004 - Journal of Postgraduate Medicine The following images related to this document are available:Photo images[jp04062t3.jpg] [jp04062t2.jpg] [jp04062t1.jpg] [jp04062f1.jpg] |
| |||||||||