 |
| About Bioline | All Journals | Testimonials | Membership | News |
|
||||||
|
||||||
Archivos Latinoamericanos de Produccion Animal, Vol. 15, No. 1, 2007, pp. 25-31 Mapping quantitative trait loci for performance traits on pigchromosome 6 (SSC6) Mapeamento de locos de características quantitativas no cromossomo seis suíno (SSC6) para características de desempenho A.V. Pires1,2, P.S. Lopes1, C.T. Guimarães3 and S.E. F. Guimarães1 1Departamento de Zootecnia, Universidade Federal de Viçosa, Av. PH Rolfs,
CEP: 36571-000, Viçosa – MG, Brasil. Recibido mayo 31, 2005 Aceptado junio 23, 2006 Code Number: la07004 ABSTRACT The objective of this study was to perform QTL mapping associated with performance traits on swine chromosome 6 (SSC6). The F2 population was produced by outcrossing using two native Brazilian breed Piau sires and 18 commercial dams. A total of 617 F2 animals were genotyped for 13 microsatellite markers. The traits evaluated in the F2 population were teat number (TN), birth weight (BW), weight at 21, 42, 63, 77 and 105 days of age (W21, W42, W63, W77, W105), weight at slaughter (WS), and average daily gain (ADG), feed intake (FI) and feed/gain ratio (FG) from 77 to 105 days of age. Data were analyzed by multiple regression developed for analysis of crosses between outbred lines, using the QTL Express software. A significant QTL was detected for FI at 99 cM. A suggestive QTL was detected for W42 located at 55 cM. A locus located at 100 cM seems to affect the traits FI and ADG. Evidence for loci affecting weight at the other ages was not found. Key words: Animal breeding, Molecular markers, Outbred cross, QTL, Sus scrofa RESUMO O objetivo deste estudo foi obter o mapeamento de QTL no cromossomo 6 suíno (SSC6) associado a características de desempenho. A população F2 foi produzida utilizando o cruzamento divergente de dois reprodutores da raça nativa brasileira Piau e 18 fêmeas comerciais. Um total de 617 animais F2 foram genotipados para 13 marcadores microssatélites. As características avaliadas na população F2 foram: número de tetas (TN), peso ao nascimento (BW), peso aos 21, 42, 63, 77 e 105 dias de idade (W21, W42, W63, W77, W105), peso ao abate (WS), e ganho de peso médio diário (ADG), consumo de ração (FI) e conversão alimentar (FG) dos 77 aos 105 dias de idade. Os dados foram analisados usando a metodologia de regressão múltipla desenvolvida para análises de cruzamentos entre linhas divergentes, usando o software QTL Express. Um QTL significativo foi detectado para FI em 99 cM. Um QTL sugestivo foi detectado para W42 localizado em 55 cM. As características FI e ADG parecem estar sob a influência de um loco situado em torno de 100 cM no cromossomo estudado. Não foram encontrados QTLs para peso em as outras diferentes idades. Palavras-chave: melhoramento animal, marcadores moleculares, cruzamento divergente, QTL, Sus scrofa IntroductionGrowth traits are economically important in animal production and have quantitative inheritance given that they present continuous variation and have a polygenic pattern of expression. The swine genetic map is one of the best studied among domestic animals. It´s length is about 2800 cM, distributed in 18 pairs of autosomoal chromosomes plus the sexual pair. Most genetic maps include 1000 markers spaced at an average distance of approximately 3 cM. This high degree in marker density has enabled researchers to search for QTL and candidate genes. It is an extremely important in QTL mapping strategy to choose the right experimental design when obtaining population founders for genotyping in order to make QTL detection easier. The use of a F2 population, obtained from outbred crossing, has some advantages such as easier QTL detection, mainly due to the large allele segregation as a result of the greater genetic variability. Most crosses in swine for divergent F2 population formation are obtained by mating between the wild boar or Chinese pig and the commercial breeds Landrace, Large White or Pietrain (Roslin Institute, 2003; Rothschild, 2003). Many studies have attempted to detect QTL that affect growth traits in pigs (Andersson et al., 1994; Rothschild et al., 1995; Casas-Carrillo et al., 1997; Wang et al., 1998; Nezer et al., 1999; Yu et al., 1999; Roher, 2000; Bidanel et al., 2001; de Koning et al., 2001; Malek et al., 2001), and most have reported QTL with significant or suggestive effects on the phenotypic variation of different traits. The Brazilian native pig Piau breed originated from breeds introduced by Portuguese settlers in the XVI century and has also some influence of Dutch and African pigs (Vianna, 1985). These animals were used for breeding in small farms, their main characteristics being rusticity, adaptability to poor conditions of management and feeding and resistance to diseases. All the old Brazilian pig breeds are considered as fat type, supplying farmers not only with meat, but also with a large amount of fat. However, in the last decades this fatness has become disadvantageous due to changes in consumer demand and the associated low production efficiency, thus these native pigs are on the way to extinction (Lopes et al., 2002). On the Sus scrofa chromosome 6 (SSC6) there are candidate genes related to growth, meat quality and body composition. As those candidate genes are relevant to fat deposition and muscle metabolism, the SSC6 was chosen for initial screening in this study (Guimarães et al., 2001). The objective was to use an F2 population to map QTL on swine chromosome 6 with associations to trais of body weight at various ages, feed intake, average daily gain and feed-gain ratio. Material and Methods2.1 Obtaining data and population designThe families were produced and data were obtained at the Pig Breeding Farm of the Department of Animal Science at the Universidade Federal de Vicosa (UFV) in Vicosa, MG, Brazil, from November 1998 to July 2001. The F2 design was used to obtain linkage disequilibrium between markers and QTL. To do so, two families were formed by crossing two Brazilian naturalized pig breed (Piau) sires with 18 dams from a line developed at UFV by mating animals of the commercial breeds Landrace x Large White x Pietrain that were selected for performance traits. The F1 generation was born between March and May 1999. Eleven F1 boars were randomly selected from different litters and were mated (natural service) with 54 F1 females to produce 617 F2 animals. F2 animals were divided into 5 contemporary groups using birth period as a criterion: (1 - 124 animals born between 20/06/00 and 03/07/00; 2 – 154 animals born between 03/08/00 and 23/08/00; 3 – 92 animals born between 16/09/00 and 01/11/ 00; 4 – 118 animals born between 30/11/00 and 25/ 12/00; and 5 – 129 animals born between 19/01/01 and 12/02/01). The males were castrated at 10 days of age and all the piglets weaned when 21 days old. All the F2 animals, males and females, from 77 to 105 days of age were submitted to individual testing to evaluate average daily gain, feed intake and feed:gain ratio. The animals were slaughtered at 64,83 kg mean liveweight and 147,83 days of age (Table 1). Initially it was planned to slaughter all the animals at the same weight (65 kg), but this was not possible because of the great variation between the weights of the animals in each contemporary group. 2.2 Measured traitsThe following phenotypic traits were measured in the F2 generation: teat number (TN), birth weight (BW), weight at 21 (W21), 42 (W42), 63 (W63), 77 (W77) and 105 (W105) days of age, weight at slaughter (WSX). From 77 to 105 days of age the average daily gain (ADG), feed intake (FI) and feed-gain ratio (FG) were evaluated. The number of observations, means and standard deviations of the traits are shown in Table 1. 2.3 Obtaining the genotype markersThe genotypic analysis was carried out at the Laboratory of Animal Biotechnology, Animal Science Department, Universidade Federal de Viçosa. DNA from the parental, F1 and F2 animals was extracted from blood collected immediately after slaughter. Microssatelite primers were donated by Dr. Max F Rothschild, coordinator of the US Pig Genome Project (Rothschild, 2003). Primers were used to cover swine chromosome 6 at an average interval of 12.7 cM (Table 2).
TN – teat number, BW – birth weight, W21, W42, W63, W77 and W105 = weight at 21, 42, 63, 77 and 105 day of age, WS weight at slaughter, ADG - mean daily gain from 77 to 105 days of age, FI - food intake from 77 to 105 days of age and FG – food gain ratio from 77 to 105 days of age. MJ Research Inc. Thermocyclers (model PTC-100/ 96), were used for the amplifications. The reactions consisted of 1 U Taq polymerase, 0.2 mM dNTPs, 0.2 µM of each forward and reverse primers, 20mM Tris-HCl pH 8.3, 50 mM KCl. The Mg concentrations ranged from 2 to 3 mM according to the primer amplification pattern and 25ng genomic DNA was used per reaction in a final volume of 10 µL.The amplification pattern of the markers was first observed in 5% polyacrylamide gels stained with silver nitrate. When the amplifications were confirmed, the products were frozen at -20ºC for later fragment analysis which included electrophoresis in 5% polyacrylamide gels using an ABI Prism 377 automatic sequencer at the Applied Biology Nucleus at Embrapa Milho e Sorgo, Sete Lagoas, MG, Brazil. The amplified polymorphic fragments were detected and discriminated by the GenScan program. Subsequently the data were extracted and converted into an exit file by the Genotyper program v.2.0, both from Applied Biosystems. 2.4 Statistical analysesConsensus distances from the swine linkage map were used (Rohrer et al., 1996) (Table 2). The QTL mapping was performed by the QTL Express program (Seaton et al., 2002) that uses the interval mapping by regression method developed for cross analysis among outbred breeds (Haley et al., 1994). The statistical model assumed the QTL is diallelic, with fixed alternative alleles in each parental breed (Haley et al., 1994). The QQ genotype was considered to correspond to the commercial animals with a effect, 99 to the native animals with –a effect, and Qq to the F1 animals with d effect. The probability of each F2 individual presenting each one of the three genotypes of the QTL was calculated according to the markers, at 1cM intervals along the chromosome. These probabilities were used to make the regression of the traits on the additive and dominance coefficients of the QTL under study for each animal. Table 2. Microssatelite markers used to scan swine chromosome 6
The F ratio values were plotted and the points with the greatest values for the statistics of the test were presented as the possible position of the probable QTL. The levels of chromosome-wise significance (a=0.10 and a=0.05) were obtained by the permutation test (Churchil and Doerge, 1994) using a total of 10000 permutations for each trait. The permutation test was performed by the QTL Express program (Seaton et al., 2002) and subsequently the SAS "Proc Univariate" (SAS, 1990) was used to obtain the levels of significance at 1 and 5% (significant QTL) and 10% (suggestive QTL) probability, from the data of all the traits simultaneously. The following statistical model was used: yijk = Si + Bj + (Cijk − C)b + caa + cdd + eijk where
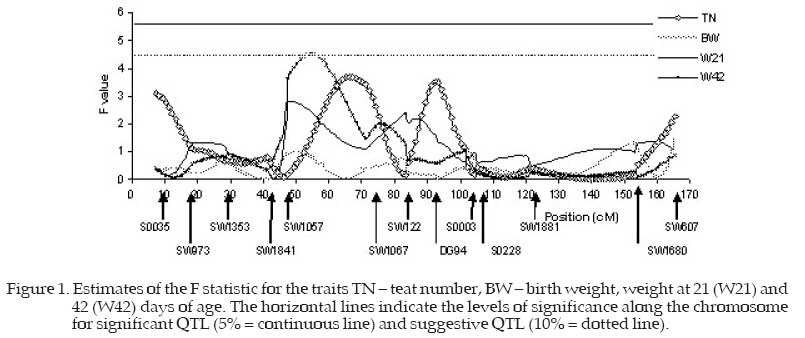
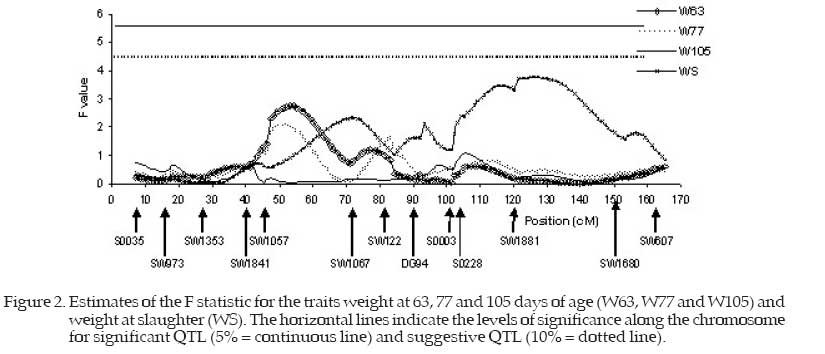
ca and cd were calculated as follows: ca =P(QQ)−P(qq) cd = P(Qq) where P(QQ) = probability of the QTL alleles being homozygote of commercial origin; P(qq) = probability of the QTL alleles being homozygote of native origin; P(Qq) = probability of the QTL alleles being heterozygote. The described model was used to estimate the regression of the phenotype on the ca and cd coefficients, varying the QTL position at each cM. An F value was calculated for each position, comparing the model that considers the QTL presence (complete model) to the model without QTL (reduced model). The estimates for a and d were calculated as the best estimated position with the greatest corresponding F value (Fmax). The significance levels along the chromosome were for significant QTL, α=5%, and suggestive QTL, α=10%. Results and DiscussionTable 3 shows a summary of the maximum F values and their positions (cM) for the putative QTL and the respective estimates of the additive and dominance effects with the respective standard errors. The F statistic values for all the traits are plotted in Figures 1, 2 and 3 respectively for the traits TN, BW, W21 and W42, for W63, W77, W105 and WS; and for FI, FG, and ADG, and the peaks correspond to the probable positions of the QTL under study. Table 3 and Figure 1 show that the teat number trait presented two F statistic peaks with close values, located at 66 and 92 cM and the maximum F value equal to 3.68. Although not significant, these peaks are high and should be investigated by saturating the linkage map or genotyping more animals to ascertain whether they are true QTL or only falsepositive associations (Hirooka et al., 2001). Observing the F statistic curve for the birth weight (BW) trait, it was found that this did not present high F values (Fmax 1.55) tus not showing a QTL for this trait. The F statistic peak obtained for weight at 21 days of age (W21) was 2.79 at the 48 cM position, indicating that there was no significant QTL for this trait on this chromosome. These results are similar to those reported by Wang et al. (1998) who did not report evidence of QTL for W21. The trait weight at 42 days of age (W42) presented a maximum F value equal to 4.52 (P<0.10) indicating a suggestive QTL in the 54 cM region. The marker density should be increased in these regions or the experiment repeated, assessing a larger number of animals to ascertain real QTL presence with greater precision. Data would then be obtained for more refined mapping of this region. Table 3 and Figure 2 show that the traits weight at 63 (W63), 77 (W77) and 105 (W105) days of age presented low peaks with maximum F values equal to 2.65, 2.07 and 1.11 positioned at 53, 51 and 105 cM, respectively, which does not indicate the presence of significant or suggestive QTL for these traits. Seaton et al. (2002) analyzing the SSC6 in 865 F2 (Meishan x Duroc) also found significant QTL for body weight at 30 days of age (102.7 cM) and for days from 30 to 90 kg (126.2 cM). Bidanel et al. (2001) found suggestive QTL for body weight at 10, 13, 17 and 22 weeks of age, and for average daily gain from birth to 3 weeks, from 3 to 10 weeks and from 10 to 22 weeks of age. They found significant QTL for backfat thickness at 13 and 17 weeks of age. The F statistic presented greater values for weight at slaughter (WS), although still not significant, but with a maximum F value equal to 3.77 at 126 cM. Table 3. Summary of maximum F statistics and their positions (cM) for the QTL and the respective estimates of the additive and dominance effects
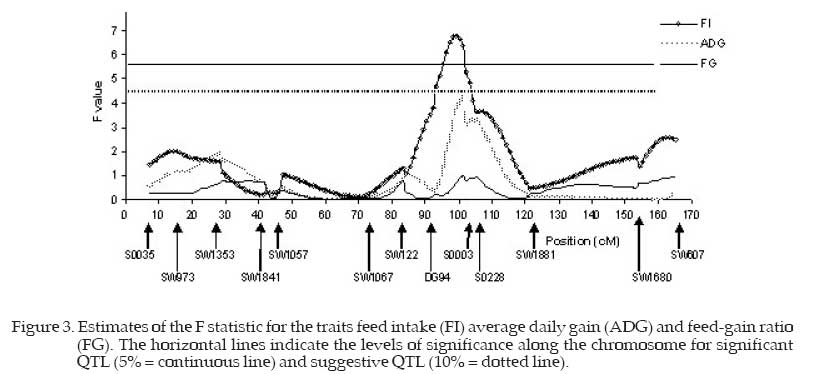
* , † = Significant at 5% and suggestive at 10% probability, respectively; 1 SE = standard error TN – teat number, BW – birth weight, W21, W42, W63, W77 and W105 = weight at 21, 42, 63, 77 and 105 day of age, WS weight at slaughter, ADG - average daily gain, FI - food intake, FG – food-gain ratio. This peak of the F statistic was obtained in a chromosome region poorly saturated by markers. Thus greater saturation of the region with markers is necessary to confirm QTL presence. Table 3 and Figure 3 show that the feed-gain ratio trait (FG) presented very low F values, the maximum being equal to 1.01 at 101 cM. Thus no QTL was shown for this trait. Yue et al. (2003) related QTL for feed conversion ratio in 127cM and for live weight at slaughter in 110 cM on the SSC6. Additionally, these authors reported numerous QTL for meat quality traits. A maximum F value of 4.22 was obtained for the ADG trait, a value close to the level of significance of 10% probability, and therefore there may be a suggestive QTL at 101 cM. Malek et al. (2001) reported five QTL for average daily gain when they worked with chromosome scanning that used 125 microsatellite markers while Casas-Carillo et al. (1997) reported one QTL for ADG on chromosome 3. The maximum F value equal to 6.80 was significant (P<0.05) for FI (Figure 3) indicating the presence of a QTL at 99 cM influencing this trait. These QTL may indicate the presence of appetite regulating genes that would be related to feed intake. It is emphasized that the animals received feed ad libitum, without any restriction so they could express all the FI potential. The maximum F value for ADG at 101 cM could be correlated with FI (QTL in 99 cM), as evidece of pleiotropic effects of this locus on those traits. On SSC6, at 103 cM, Ovillo et al. (2005) found a QTL for weight of ribs, and Sato et al. (2003) reported QTL for feed intake at 99 cM in a F2 (Meishan x Duroc) population. This same result in studies with animals of different genetic background could be due to the presence of an important gene at this position. The most likely candidate should be the Ryanodine Receptor (ryr-1) that maps to 100 cM at this chromosome and is known to affect meat quality, growth and body composition in pigs (Fisher et al., 2000; Bastos et al., 2001). Suggestive QTL for backfat thickness (180 cM) and intramuscular fat content (150 cM) were found by de Koning et al. (1999) on SSC6. Grindflek et al. (2001) reported QTL on SSC6 for intramuscular fat content (79 cM), intensity of smell (92 cM) and meat percentage (63 cM). The intramuscular fat content QTL position was confirmed by Uleberg et al. (2005).Ovillo et al. (2005) also found QTL for backfat thickness (130 cM), intramuscular fat percentage (132 cM), loin muscle area (131 cM), loin depth at thirdribs (130 cM), weight of belly bacon (130 cM) and average weight of shoulders (125 cM). These authors worked in fine mapping using multiple generations by intercrossing the Iberian with Landrace pigs. The F peaks for ADG and FI around 101 cM found in the present study were practically coincident. These results suggest that the same locus may be acting on these traits, exercising pleiotropic effect, or there may be genetic linkage, where different loci, closely linked around 100 cM, may be influencing the traits or no QTL may be present, justifying partially the existence of positive correlation between FI and ADG. Acknowledgement We thank the CNPq (National Council of and Graduate Training) and Dr. Max F. Rothschild, Research), FAPEMIG (Minas Gerais State Research coordinator of the US Pig Genome Project, for Foundation) CAPES (Cordination Higher Education donating the microsatellite primers. Literature Cited
© 2007 ALPA. Arch. Latinoam. Prod. Anim. The following images related to this document are available:Photo images[la07004f1.jpg] [la07004f2.jpg] [la07004f3.jpg] | |||||||||||||||||||||||||||||||||||||||||||||||||||||||||||||||||||||||||||||||||||||||||||||||||||||||||||||||||||||||||||||||||||||||||||||||||||||||||||||||||||||||||||||||||||||||||||||||||||||||||||||||||||||||||
| |||||||||