 |
| About Bioline | All Journals | Testimonials | Membership | News |
|
||||||
|
||||||
East African Journal of Public Heath, Vol. 5, No. 3, December, 2008, pp. 133-141 “Delivering” on the MDGs?: Equity and Maternal Health in Ghana, Ethiopia and Kenya Meg Wirth1, Emma Sacks* 2, Enrique Delamonica3, Adam Storeygard2, Alberto Minujin4 and Deborah Balk2 1Independent Global Health Consultant to Center for International Earth Science Information Network
(CIESIN), Code Number: lp08025 Abstract Objective(s): The Millennium Development Goals (MDGs) have put
maternal health in the mainstream, but there is a need to go beyond the MDGs to
address equity within countries. We argue that MDG focus on maternal health is
necessary but not sufficient. This paper uses Demographic and Health Survey
(DHS) data from Kenya, Ethiopia and Ghana to examine a set of maternal health
indicators stratified along five different dimensions. The study highlights the
interactive and multiple forms of disadvantage and demonstrates that equity
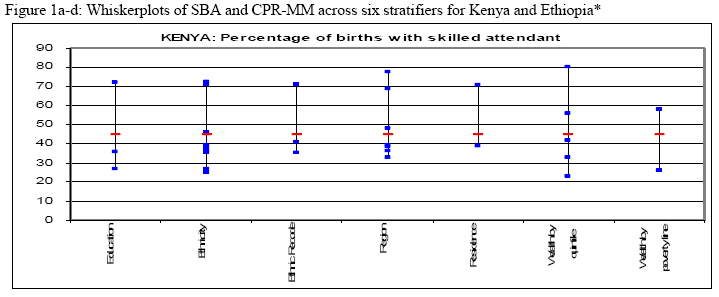
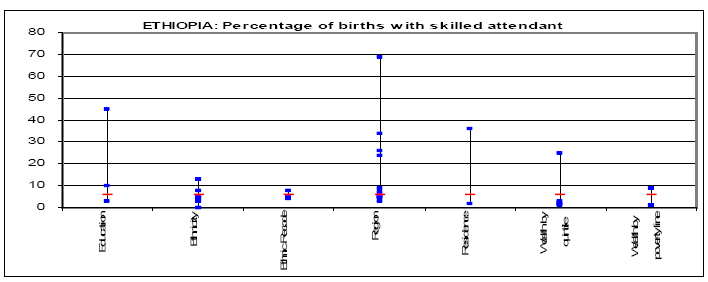
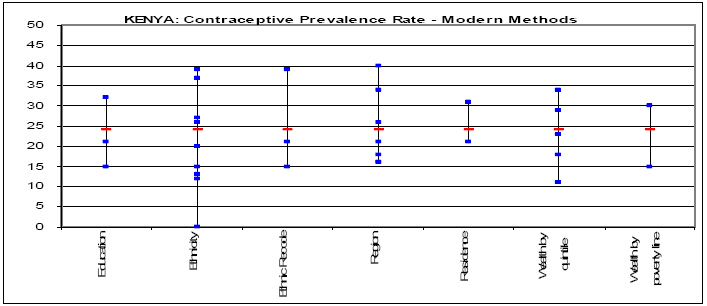
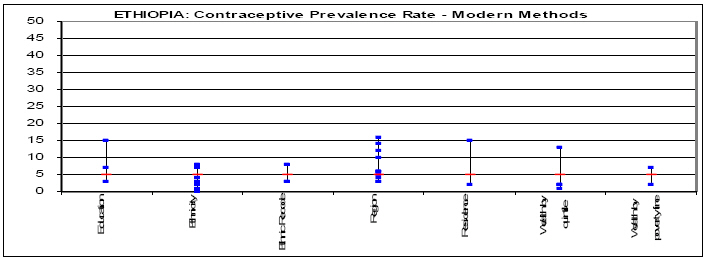
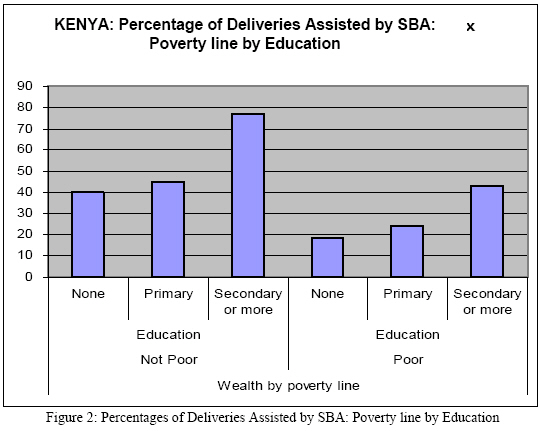
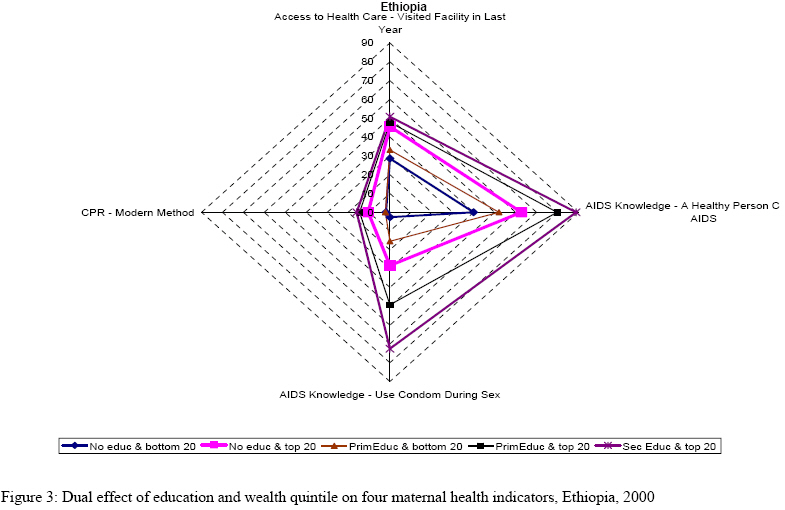
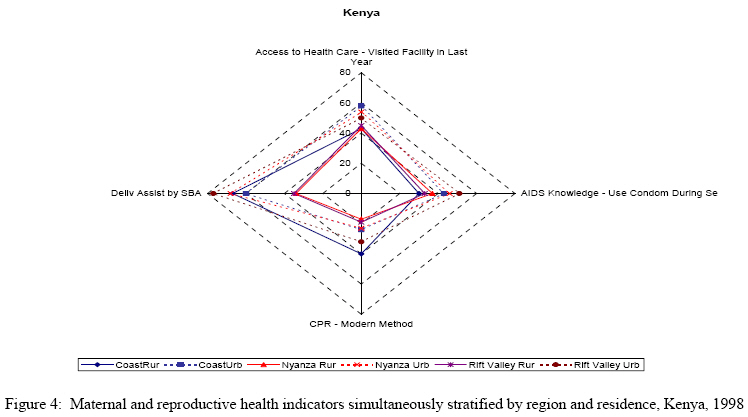
monitoring for the MDGs is possible, even given current data limitations. Conflict of Interest: The authors declare that there are no conflicts of interest. The lead author had full access to the data used in this paper and the final responsibility for the decision to submit for publication. Introduction The fifth Millennium Development Goals (MDG) places the improvement of maternal health in the mainstream development agenda. Such attention to maternal health is long overdue, as progress in recent decades has been shamefully limited. In sub-Saharan Africa, maternal mortality increased from 1990 to 2000 in many countries, in large part due to health system collapse, increasing poverty among women, lack of access to skilled care for delivery, weak national human resource management and lack of political will and financial commitment (1-3). Currently, the African region accounts for 48% of the global annual toll of 529,000 maternal deaths (3). At the same time that the MDGs are gaining traction, the international health community is grappling with the importance of going beyond country averages, documenting socio-economic differences in health and ensuring that programs ‘reach the poor’ (4-8). Maternal health, and in particular access to skilled birth attendants, is highly stratified by poverty and other social determinants of health (9-13). And maternal mortality is a sensitive marker of disadvantage (9,14-15). Nevertheless, the equity dimension of the maternal health MDG, indeed many of the health MDGs, has not influenced the main instruments of development policy—the Poverty Reduction Strategy Papers (PRSPs), Medium Term Expenditure Frameworks (MTEFs), and MDG reports. We argue that MDG focus on maternal health is necessary but not sufficient. It is critical that the MDGs incorporate a focus on equity—for practical as well as ethical reasons, including human rights (16-18). In practice, an equity focus means that monitoring of the MDGs and designing policies to meet them should ensure that the worst-off groups benefit at the same or greater rate as the better-off groups. But who are the worst-off groups? We know that poor women usually fare worse than rich (3,7,9), but too often the determination “worst-off” stops there. The focus on wealth quintiles reflects a conception of poverty as largely a function of material deprivation rather than as a function of “powerlessness and vulnerability linked to systemic discrimination” (4,19). Inequity is a concept that is broader than poverty. Operationally we use the WHO definition of health equity: “the absence of unfair and avoidable or remediable differences in health among populations or groups defined socially, economically, demographically or geographically” (20). A full analysis of inequity will have important policy implications. A more nuanced picture of inequity could capture avoidable disparities between identifiably different population groups. These approaches could have significant bearing on the priorities and policies identified in key development agendas including the rate of progress in reaching the MDGs. Some countries have adopted approaches to the PRSPs or MDGs that define vulnerable groups and make their welfare an explicit policy focus.19,21 For example, in Ghana, a PRSP focus on poverty reduction resulted in Highly Indebted Poor Countries (HIPC) relief funds being specifically allocated to the health sector in keeping with an equity resource allocation formula that focuses on the four poorest regions of the country and that offers free delivery services for mothers in these regions, training human resources for the poorest areas of the country, a health insurance initiative for the poor (21). Unfortunately, it is too early to assess the impact of these changes. A similar approach in Bolivia has not had much of an impact yet. (22). In this article we focus on three countries in sub-Saharan Africa—Ghana, Ethiopia and Kenya—and use DHS data to explore equity in reproductive and maternal health in these settings. We look at several indicators and examine the distribution of these across five social stratifiers. The set of indicators is purposefully broad in order to highlight a range of factors which are related to reproductive risk and maternal health. First, simple bivariate analysis is used to determine which stratifiers are significant. Next, we undertake simultaneous stratification to determine the dual effect of two kinds of social stratification, e.g. poverty and education. The article highlights the following key points about inequities and maternal health: 1) measuring and monitoring inequity in access to maternal health is possible even in low resource settings—using current data 2) statistically significant health gaps exist not just between rich and poor, but across other population groups as well, and multiple forms of disadvantage confer greater risk and 3) policies must be aligned with reducing health gaps in access to key maternal health services. Methodology We consider four indicators of reproductive and maternal health along five social dimensions. First, the percentage of births attended by skilled birth attendant (SBA) is a key intermediate indicator linked to the MDG target on maternal mortality, which cannot be directly measured for population subgroups in most data poor settings.9 Though highly imperfect, the SBA indicator captures an important dimension of the health system—the distribution of human resources appropriately skilled in delivery care and accessible at a health facility or in the community. The second indicator, contraceptive prevalence rate (modern method; CPR-MM) is also critical to the reduction of maternal mortality. Access to contraception allows limiting and spacing pregnancies which thereby lowers each woman’s lifetime risk of unsafe abortion and obstetric mortality. Third, ‘Access to a health facility’ is derived from a question in the family planning section of the DHS module and indicates whether a woman has used the services of a health facility in the last year. Emergency obstetric care facilities (EmOC), another key health systems indicator, are not measured by standard DHS surveys and so the ‘access’ indicator is an imperfect but important substitute for the EmOC indicator.16 Finally, we consider one AIDS knowledge indicator which measures the percentage of women aged 15-24 who know that a person can protect herself from HIV infection by consistent condom use. Though not comprehensive, this set of indicators covers access to the health system, health knowledge and prevention. For Ethiopia and Kenya, the social stratifiers are education (mother's highest level, grouped into None, Primary and Secondary with Non-formal curricula and strictly religious education excluded), residence (urban or rural), region, ethnicity, wealth by quintile and wealth by poverty line. Ghana’s 1998 DHS does not allow creation of a wealth index because it does not contain information about the appropriate household assets. Ethnicities were recoded into dominant, not dominant, and secondary dominant categories based on relevant literature to create larger classes of stratifiers called the ‘ethnicity recode’ variable (26). A "wealth by poverty line" variable was created using existing wealth indices to complement the stratification by wealth quintile with a simple policy-relevant distinction between rich and poor (27-28). World Development Indicators data for percentage of population living below the poverty line were applied to the wealth index data. In order to create a more policy-friendly indicator, we used external data on the percentage of the population living below the national poverty line. This group below the national poverty line was labelled ‘poor’ while those above the poverty line were labelled ‘non-poor.’ Data are drawn from DHS surveys of Ethiopia (2000), Ghana (1998), and Kenya (1998) (23-25). Measures are calculated from individual level data or recorded from DHS reports and website. Indicator definitions were harmonized across countries when possible. Some of our indicators differ from those in the DHS reports. For example, values of “Don’t Know” or “Missing” were excluded from our analysis, whereas in DHS reports these categories are sometimes explicitly reported, or considered equivalent to “No”. DHS reports contraceptive prevalence rates for women currently in union, whereas we report for all women. We present simple bivariate analysis as well as ‘simultaneous stratification’ wherein each health indicator is calculated each for all possible joint categories of all pairs of stratifiers.* Through simple stratification, or bivariate analysis, we determined how the values for each health indicator are distributed across population groups, taking each stratifier in turn (e.g. ethnic group, educational group, etc). Then, in order to assess the combined effect of two forms of stratification, each pair of stratifiers underwent simultaneous stratification (trivariate analysis). For example, we calculate the CPR-MM for women with secondary education in the dominant ethnic group in Kenya, or rate of skilled birth attendance among urban women in the poorest quintile in Ghana. Results 1. Bivariate Analysis Despite continued attention to reproductive health issues, maternal and reproductive health status in much of the world remains dismal. For example, in Ghana and Kenya access to a skilled birth attendant stood at just under 45 % while in Ethiopia it was only 5.6%. Yet for almost every stratifier studied across the four indicators, there are statistically significant disparities. In Ethiopia, despite this 5.6% national average, SBA is accessible to women with a secondary education at 45%, women of Tigray ethnicity at 45%, women in Addis at 69.3% and women in the highest wealth quintile at 25.4%. SBA and CPR-MM Figures 1a, 1b, 1c, 1d displays whiskerplots for two key indicators: SBA and CPR-MM in Kenya and Ethiopia. At a glance, it’s clear that regional variation in SBA in Ethiopia is quite large. This is skewed due to Addis Ababa (the capital, where about 5% of the population resides), where access to an SBA covers more than two thirds of the women. Secondary education and membership in the highest wealth quintile have enormous benefits in terms of access to a SBA (3% for no formal education versus 45% for secondary) (see Figures 1a, 1b, 1c, 1d). In Kenya, analysis by wealth quintile yields a stepwise gradient for SBA—with a range that is greater than occurs across regions. Secondary education also makes a substantial difference for delivery assistance by SBA (72%, as opposed to 27% for those with ’none’ and 36% for those with ‘primary’). A similar range exists for ethnicity, where 27% of the Mijikenda/Swahili deliver with an SBA and 71% of the Kikuyu deliver with an SBA. In Ghana (not shown) SBA is most unevenly distributed across regions and ethnicities, though education yields a 2.5-fold difference in access at the extremes. Comparing CPR-MM, in Ethiopia, we see less striking regional variation than with SBA, which is expected, given the extremely low absolute level of coverage (5%). Yet still we see inequities across educational group, region, residence and wealth quintile. In Kenya, access to CPR-MM is lower than access to a SBA. Ethnicity seems to matter more while education matters less in terms of distribution of access across these population groups. Although there is a relatively small difference in CPR-MM for urban- and rural-dwellers (20% vs. 30%), there is a larger differential by region with 40% coverage in the Central region and only 16% along the Coast and Western regions. In Ghana (not shown in Figure 1a, 1b, 1c, 1d), the national average for CPR-MM is quite low (11%), and though disparities do exist, they are far less pronounced than was the case for SBA. For CPR-MM disparities across region and ethnicity appear to be the greatest. Access to a health facility The ‘access to a health facility’ indicator reveals a different set of disparities. In Kenya, about half of all women sought health care services for themselves or their children within the past year, a statistic that does not vary much by level of education (47% to 55%) or by type of residence (50% to 53%). The differences between the women in the lowest and highest quintiles also ranged only from 45% to 52%, with the main difference being between the two lowest quintiles. But both region and ethnicity do dramatically stratify ‘access’ in Kenya with a twofold difference between groups having the highest and lowest percentages with access to a health facility (significant at 5%). In Ethiopia, nationwide, 36 % of women visited a health facility in the year previous to the survey. This ‘access’ indicator varies far more by educational level (from 34 to 51%) and by poverty status than it did in Kenya. In Ethiopia, access to health care among the wealthiest quintile is a third higher than the national average. The ethnic group with the highest access is also just a third above the national average (similar to the advantage enjoyed by urban women). By contrast, the variation across regions and ethnic groups is not as pronounced as in Kenya. AIDS Knowledge AIDS knowledge is inequitably distributed across all analyzed population groupings in Kenya, Ghana and Ethiopia. In Ghana, the greatest disparities, in this indicator are between regions (a four-fold differential between the extremes) followed by education and ethnicity (three-fold differentials). In Kenya, the greatest disparity is found in education, though wealth quintile and region as well as residence are not far behind. In Kenya, this indicator is a bit more equitably distributed, with ethnicity, residence and wealth by poverty line showing gaps of 1.5 fold at the extremes. Education is the greatest stratifier in Kenya for this AIDS knowledge indicator. In Ethiopia, however, the low national average of 17% is striated by astounding disparities: a nine-fold difference in AIDS knowledge between mothers with no education and those with secondary education, 20-fold across extremes of ethnic groups; 12-fold across wealth quintile extremes; six-fold across urban/rural residence. In Ethiopia, the national average of condom utilization is zero (modern contraception use stands at 5%) Thus, the bivariate analysis yields a picture of the level and range of disparities across different indicators and stratifiers—and allows testing for level of statistical significance. 2. Simultaneous stratification Simultaneous stratification yields surprising results indicating importance of dual forms of marginalization and complexity of inequity. Space does not permit a full analysis of each pair of stratifiers for each indicator. This section highlights a few striking findings with relevance to policy. Substratifying poverty status: Even amongst the poor there are enormous inequities in access to care. As Figure 2 indicates for Kenya, access to an SBA is significantly different by level of education amongst both the ‘poor’ and the ‘not poor’. Non-poor women with no education use SBAs 40% of the time while women with the highest educational levels access a SBA for 77% of deliveries. For the poor, on the other hand, only 19% women with no education access a SBA while women with secondary or more education access SBA at 43%. Importantly, the most highly educated poor women have access to SBA at a rate only equivalent to the rates attained by the ‘not poor’ with no education. It seems that in access to SBA, education is helpful, but still dramatically constrained by poverty status. Figure 3 is a spidergraph of four different maternal health indicators in Ethiopia with different combinations of wealth quintile and education as the ‘strands’ of the web. The Figure depicts the way that membership in the lowest versus the highest quintile is ‘mediated’ by level of education for each of the maternal health indicators depicted. Substratifying Educational Groups: The dual effect of education and other stratifiers (e.g. poverty status, ethnicity or residence) is highlighted through simultaneous stratification. In Kenya, within each educational group, there is a clear, stepwise gradient across wealth quintiles in access to skilled birth attendant. CPR-MM amongst women with no education ranges from 10 and 11% respectively in the lowest two quintiles to 22% in the highest quintile. CPR-MM for women with primary and secondary education is similarly stratified across wealth quintiles. On the other hand, for the ‘access to a health facility” indicator, even amongst those with no education, access ranges from 44% in the poorest quintile to 56% in the richest. Surprisingly, in the primary and secondary education groups, the poorest quintile is similar to or higher than the richest quintile among the non-educated for access to a health facility. Similarly, in Ghana, within each level of education ethnicity groupings reveal disparities. Amongst those with “no education”, the three ethnic groupings exhibit an increasing level of access to SBA—though ethnic differentials seem to decrease as the level of education increases. In Ethiopia, CPR-MM use is relatively low among all groups, but is especially low for women with either no or only primary education who are also in the poorest wealth quintile (see Figure 3). Not unexpectedly, the highest usage belongs to women with secondary education and in the wealthiest quintile. The range for knowledge about condoms and AIDS is quite substantial. About 75% of wealthy and educated women know that condoms prevent AIDS, while almost none of the poorest uneducated women are aware of that fact. Amongst the top and bottom quintiles, education has a significant effect, but wealth appears more important than education. When comparing the three countries’ CPR-MM rate in terms of education substratified by urban/rural residence, Kenya has both the best aggregate results but also the largest disparities. In Ethiopia, access to education makes a much bigger difference in use of CPR-MM for urban dwellers as opposed to rural, while in Kenya, this urban/rural distinction makes very little difference. Substratifying region: Allocation of national budgets, particularly in the context of decentralization, is one way to prioritize marginalized geographic areas. However, results from simultaneous stratification show that allocation to a region as a whole will not necessarily reach the most needy. For example, in Ghana, with a national average for access to a SBA of 44%, the Greater Accra region’s rate of 73% might indicate that it should be bypassed for regions of greater need. However, by simultaneously stratifying region by residence, the urban rate for SBA in Greater Accra is 86% and the rural is 23%. In the far more marginalized Northern region, additional stratification shows that SBA is 40% for urban dwellers and 6% for rural dwellers. Likewise, in Kenya, Nyanza is one of the regions with the lowest levels of SBA, yet simultaneous stratification reveals a statistically significant urban advantage over rural areas (see Figure 4). In about half of the regions, education is also a highly significant stratifier of access to SBA. Turning to CPR-MM, and substratification by education, in Greater Accra 7% of women with no education had access to modern methods compared to 14% for those with secondary education. In Ethiopia, while access to health services in rural areas stands at 33%, in urban areas it is 49 % (the national average is 36%), higher by a factor of 1.5. However, the gap between the ‘worst-off’ region’s rural population and the ‘best-off’ region’s urban population is 2.4. In Greater Accra 7 % of women with no education had access to modern methods compared to 14% for those with secondary education. While, the relative importance of education and residence are not the same in every country, these results are consistent with the queuing hypothesis29 whereby the better-off benefit first from improvements in access and the worse-off must “wait in line” for their turn. Discussion Part of the power of the Millennium Development Goals lies in their parsimony—eight succinct goals summarize the development aspirations for much of humanity. And yet, the MDGs are complemented by a list of targets which are often augmented by competing national priorities. To some, adding the equity dimension to the goals is just that—an unwelcome addition to an agenda many countries are hard-pressed to meet. This analysis sought to document some techniques for developing a more nuanced understanding of inequities in maternal and reproductive health in three African countries. As shown here in examples from Ghana, Kenya and Ethiopia, the ramifications of the stratified data on maternal and reproductive health from poor countries deserve serious attention. And though adding an equity dimension to the MDGs may complicate the course toward meeting them, it seems a systemic reduction in poverty, in all its forms, requires just such an endeavour. Certainly, oversimplifying our approach to poverty reduction and to maternal health is not the answer. First, it is important to note that basic data on reproductive and maternal health is available in countries such as Ghana, Ethiopia and Kenya and amenable to fairly simple statistical equity analysis. In the last several years, analysis of DHS data by wealth quintile has both pushed and supported the growing interest in ‘reaching the poorest (8). And for almost every maternal or reproductive health indicator in each country studied here, wealth quintiles are a strong, statistically significant stratifier. But other stratifiers—ethnicity, maternal education, region and residence—are similarly significant and often more pronounced. Second, the technique of simultaneous stratification used allows a quantitative assessment of how dual forms of marginalization affect key health indicators. As one might expect, multiple forms of marginalization often confer greater risk. We present some results based upon substratifying poverty, education and region. These results suggest that in order to fine-tune policies to reach the most marginalized, simple allocation formulas targeting a particular region or ‘the poor’ are not be sufficiently nuanced. In a full country-level analysis, other indicators and stratifiers (including age) could enhance the utility of this exercise. And other indicators such as antenatal care, postnatal care, place of delivery and age at first marriage (10,30,31), are important components of a full suite of reproductive health indicators. The use of the Sisterhood Method to stratify MMR by poverty level is an important methodological advance that could be replicated (9), and better indicators could be constructed to get at harder issues related to access to Emergency obstetric care (EmOC) (16). Though inequities abound, the patterns and breadth of the disparities are varied depending upon which indicator and which country is studied. This large variability in the magnitude of inequities reveals that they are not somehow fixed or natural (12). The results for Kenya show that the present patterns of development are able to ensure equity in the process of improvement. Our findings have direct implications for policies as well as broader conceptual ramifications. The primary policy implication is that policies such as the PRSPs and MDG-focused development could and should become more equity-focused. Policies must be aligned with reducing health gaps in access to key maternal health services. The MDG targets themselves can be framed in terms of the precise health gaps that need to be closed while reaching the MDG, and indicators can be monitored for trends over time (16). The information on disparity could help to modify the ‘top down’ pattern so often seen. In order to ensure that equity remains on the radar screen, the MDG targets should be worded so as to explicitly reference the health gaps that should be remediated (16). Other MDGs are also determinants of health—notably, education (MDG 2) and poverty (MDG 1). Overt attention to these links between the MDGs is also critical. Poverty is multi-dimensional—the wealth quintile focus must be complemented by a broader conception of marginalization that includes ethnicity, geography and educational level. The link between women’s education and health is reinforced by the data presented here. In Ghana, for example, education is one way in which ethnic disparities are mediated—and another reason to embrace women’s education as a key input to the development process. Admittedly, choices must be made—direct intervention to reduce health disparities would perhaps more quickly close the health gap between educational groups as action on these gaps can’t wait a generation for all women to reach secondary education. Ethnicity is politically fraught and sometimes coupled with other forms of disadvantage. Some countries are tackling the issues of indigenous populations head on by specifying new MDGs or targets that prioritize certain ethnic groups.19 For others, such an approach would be politically risky. Conceptually, the variation in the degree of inequities across indicators and by country may call for innovative approaches and a more calibrated approach to equity. For example, some countries have considered an index which takes into account multiple dimensions of deprivation including geographic location, income poverty and ethnicity. In every case, these measures should act only as a starting point and in-depth qualitative research should be used to compliment the numerical findings. Countries can use simple statistics to begin this process, but must tailor their programs to fit the specific needs of their population. In addition, special attention must be paid to conflict-laden regions, where the most affected populations may also be the least likely to be included in demographic surveys. Though equity analysis does highlight particular groups of the population that are marginalized, this finding in itself does not lead to a policy recommendation for targeting of health programs. Indeed, the complexity and variation in inequities may suggest universal coverage as a more efficient, effective means of improving maternal health. Conflict of interest statements The authors declare that there are no conflicts of interest. All authors had full access to the data used in this paper and the responsibility for the decision to submit for publication. Role of funding source This work was undertaken as a partnership between UNICEF and CIESIN, part of the Earth Institute at Columbia University. The original data analysis was funded by the UN Millennium Project’s Task Force 4 on Child health and maternal health and later by the World Bank Poverty Mapping Project of the Japan PHRD. This work resulted in a large data set encompassing six countries and this paper is a separate outgrowth of that original dataset and the associated background paper. M Wirth was an independent consultant to CIESIN . E. Delamonica was employed by the Research Division at UNICEF. A. Minujin was at the New School for Social Research. D. Balk, A. Storeygard and E. Sacks were employed by CIESIN, The Earth Institute for the bulk of the time during which this work was undertaken. This paper was presented in various stages at the UNU-WIDER Conference on Health Equity in Helsinki, Finland, October 2006 (E.S.); the Women eliver Conference in London, UK, October 2007 (E.S.); the IUSSP International Seminar on Health Inequities, Cairo, Egypt, February 2008 (E.S.); and the Unite for Sight Global Health and Development Conference at Yale University, Connecticut, US, April 2008 (M.W. and E.S.). References
Copyright 2008 - East African Journal of Public Heath The following images related to this document are available:Photo images[lp08025f1d.jpg] [lp08025f4.jpg] [lp08025f3.jpg] [lp08025f1a.jpg] [lp08025f2.jpg] [lp08025f1c.jpg] [lp08025f1b.jpg] |
| |||||||||