search
for
 About Bioline  All Journals  Testimonials  Membership  News


Indian Journal of Medical Microbiology
Medknow Publications on behalf of Indian Association of Medical Microbiology
ISSN: 0255-0857 EISSN: 1998-3646
Vol. 26, Num. 2, 2008, pp. 138-142

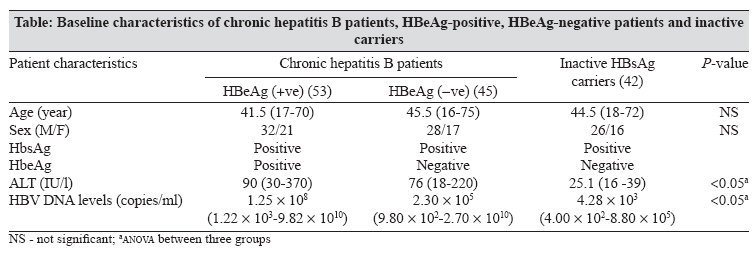
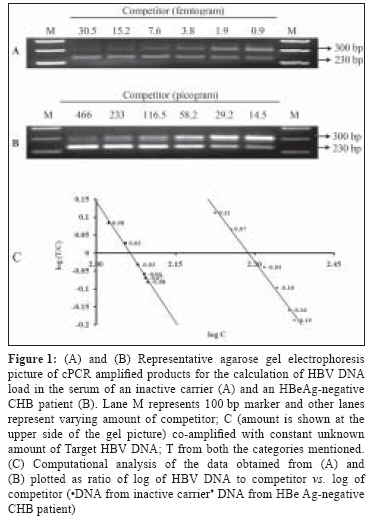
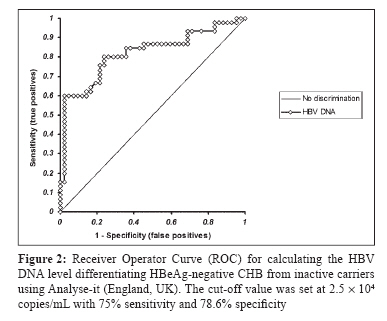
Indian Journal of Medical Microbiology, Vol. 26, No. 2, April-June, 2008, pp. 138-142

Original Article

Diagnosing different stages of hepatitis B infection using a competitive polymerase chain reaction assay

Molecular Diagnostic Laboratory, Department of Molecular Biology and Biochemistry, Guru Nanak Dev University, Amritsar - 143 005
Correspondence Address:Molecular Diagnostic Laboratory, Department of Molecular Biology and Biochemistry, Guru Nanak Dev University, Amritsar - 143 005
sehajpalpk@yahoo.com

Date of Submission: 14-May-2007
Date of Acceptance: 26-Jun-2007

Code Number: mb08040

Abstract

Purpose: Different stages of hepatitis B virus (HBV) infection can be defined by serum HBV DNA levels. This study attempts to (1) investigate serum HBV DNA levels in inactive carriers and patients with chronic HBV (CHB) infection and (2) define cut-off value between inactive carriers and HBeAg (precore antigen of HBV) negative CHB patients in Indian population.
Methods:
One hundred and forty samples encompassing 42 inactive HBsAg carriers and 98 CHB patients (53 HBeAg-positive and 45 HBeAg-negative) were analysed. Serum HBV DNA levels were determined employing an in-house competitive polymerase chain reaction (cPCR) assay.
Results:
The HBeAg-positive patients were found to have the maximum median HBV DNA load, which was significantly higher than the HBeAg-negative ones (median; 1.25 × 10 8 vs. 2.30 × 10 5 copies/mL ; P < 0.05). Interestingly, the latter group has significantly higher HBV DNA levels than the inactive carriers (median; 2.30 × 10 5 vs. 4.28 × 10 3 copies/mL ; P < 0.05). The 2.5 × 10 4 copies/ml HBV DNA levels were optimal for discriminating CHB patients (HBeAg-negative) from inactive carriers with 75.6 and 78.6% sensitivity and specificity, respectively.
Conclusions:
Despite the extensive overlapping of HBV DNA levels in inactive carriers and HBeAg negative CHB patients, 2.5 × 10 4 copies/mL is the most favourable cut-off value to classify these individuals and would be imperative in the better management of this dreadful disease.

Keywords: Chronic hepatitis B, HBeAg, HBsAg, HBV DNA, inactive carriers, quantitation

Approximately, one-third of the world population has serological evidence of the past or present Hepatitis B virus (HBV) infection resulting in 400 million chronically infected people. [1] This could lead to a variety of clinical outcomes ranging from an apparently healthy asymptomatic carrier state to acute or chronic liver disease, including cirrhosis and hepatocellular carcinoma. [1],[2] Persistent presence of hepatitis B surface antigen (HBsAg) for at least six months defines the chronic hepatitis B (CHB) carrier state. Conventionally, presence of secretory version of a HBV core protein, the e antigen (HBeAg), is associated with high viral load and serves as a marker for viral replication. [3] HBeAg seroconversion (HBeAg negative and anti-HBe) is associated with liver disease remission and marks the transition from chronic hepatitis B to the asymptomatic HBsAg carrier state, which does not show the clinical symptoms of the disease. At the time of HBeAg seroconversion, a small percentage of patients continue to show raised alanine aminotransferase (ALT) and serum HBV DNA levels. [3] This group of patients is called as HBeAg negative CHB which continues to have liver damage but due to frequent changes of ALT levels, becomes difficult to differentiate from inactive carriers. [1],[4] In the past decade, detection and quantification of HBV infection in patients has drastically evolved due to the advent of molecular tools. This has immensely helped in understanding the pathogenesis and the natural course of HBV infection [3] and simultaneously, raised new predicaments and clinically relevant questions.

To address some of the issues, a research workshop held at National Institute of Health (NIH), USA, on hepatitis B recommended the use of a new term "inactive HBsAg carrier state" instead of healthy asymptomatic carriers. Additionally, it was proposed that this class of HBV carriers is better defined by an arbitrary HBV DNA level below 10 5 copies/mL of the serum [5] and the patients having levels more than this value should undergo antiviral treatment (AVT), irrespective of the HBeAg status contrary to earlier belief. Following this, various investigators have attempted to validate the proposed cut-off limits for differentiating these two groups of carriers and found that a lower threshold value might be more relevant in their populations. [6],[7],[8],[9] Such a study turns out to be imperative in a country like India where no such data exists and the burden of this virus is second highest in the world. [10] The present study attempts to fill this void.

Materials and Methods

Patients, liver function tests and viral markers
Serum samples from the HBV infected patients as well as normal healthy individuals were collected from the Guru Nanak Hospital, Amritsar, Ram Saran Das Kishori Lal Charitable Trust Hospital, Amritsar and Dr. Ram Manohar Lohia Hospital, New Delhi, India. All the patients or their legal representative gave informed consent. The samples included in the study met the following criteria: Age between 16 and 75 years, hepatitis B surface antigen positive for at least six months, no history of malignancy, alcohol intake, and human immunodeficiency virus (HIV) or hepatitis C virus infection and had not undergone antiviral treatment during the past six months. During the past six months, the serum alanine aminotransferase (ALT) levels were persistently within and at least once above the normal range among the inactive and chronic carriers, respectively. The latter category of patients was further classified based on core antigen (HBeAg) as HBeAg-negative and HBeAg-positive CHB patients, thus resulting in three groups i.e., inactive carriers (42; HBeAg-negative; normal ALT levels), HBeAg-negative CHB patients (45; HBeAg-negative; ALT elevated) and HBeAg-positive CHB patients (53; HBeAg-positive; ALT elevated).

Collected serum samples were screened for the presence of HBsAg and HBeAg serological markers using commercially available kits (Abbott Laboratories, North Chicago, IL). Serum ALT levels were measured using a commercial kit (Bayer Diagnostics, USA) for which the upper normal limit is 40 IU/l.

HBV DNA isolation
Fifty microlitre of microwaved serum [11] diluted with 350 μl of TE buffer (10 mM Tris, 1mM EDTA; pH 8.0), was incubated at 56°C for two hours in the presence of proteinase K (1 mg/mL) and SDS (0.66%). Subsequently, the proteins were removed employing 3.4 mM ammonium acetate at room temperature. The DNA precipitated from the supernatant with 2.5 volumes of chilled ethanol (95%) in the presence of 2.5 μg glycogen (Ambion, Austin, Texas) was then washed with 70% ethanol, air-dried and finally dissolved in 20 μL of TE buffer. The DNA solution was stored at -20°C until further use.

Quantitative detection of HBV DNA
HBV DNA levels were quantified in all the collected 140 samples using an S gene based novel in-house competitive-polymerase chain reaction (cPCR) assay. [12] This assay enables the quantitative detection of HBV DNA ranging from 10 2 through 10 12 copies/mL of HBV DNA from human serum. Briefly, a constant amount of unknown HBV DNA was co-amplified with known concentration of competitor DNA construct (mimic). This resulted in the amplification of two products; one corresponding to target (300 bp) and other to competitor (230 bp) employing the same primer pair. The amplification mixture (30 μL) contained 3 U of Taq polymerase (Bangalore Genei, India), 200 μm of dNTPs mixture (dATP, dCTP, dGTP and dTTP), 0.2 μM of each primer (FW1; 5′-GGT ATG TTG CCC GTT TGT CC-3′ and RW1; 5′-CCC AAT ACC ACA TCA TCC AT-3′), 50 mM KCl, 10 mM Tris-HCl (pH 9.0), 1.5 mM MgCl 2 and 0.01% gelatin. The DNA sample and mimic were added in the last. The reaction was amplified in a programmable thermal cycler (MJR Research Products, USA). The amplification profile consisted of initial 3 minute denaturation at 94°C, followed by 35 cycles of (1) denaturation at 94°C for 30 seconds, (2) annealing at 57°C for 30 seconds and (3) extension at 72°C for 30 seconds with a final extension at 72°C for 3 minutes. The PCR products were electrophoresed in 2.5% agarose gel inTris-Acetate-EDTA (TAE) buffer; pH 8.0. The ethidium bromide stained gel was visualised and photographed using UV transilluminator and digital imaging system (Ultralum Inc, USA). Following agarose gel electrophoresis, the PCR products of two targets were densitometrically quantified (ImageJ1.33u, NIH, USA; http://rsb.info.nih.gov/ij) and the point of equivalence was determined leading to the quantification of serum HBV DNA levels. [13]

Statistical analysis
Statistical analysis was carried out using the SPSS ver. 7.5 for windows software (SPSS Inc, Chicago, IL, USA). The HBV DNA levels and other clinical/laboratory parameters were expressed as the median value and range. The differences between the groups were analysed using the Chi-square test and ANOVA. Receiver operator curve (ROC) curve was used to determine the cut-off levels of HBV DNA that differentiated HBeAg-negative CHB patients and inactive HBsAg carriers. Results were considered statistically significant at P < 0.05.

Results

The demographic and clinical data of the three studied groups were compared with respect to sex, age, ALT and HBV DNA levels [Table - 1]. HBV DNA levels were estimated employing cPCR assay as described in the section, materials and methods. [Figure - 1] depicts a representative agarose gel electrophoresis picture of the co-amplified products in case of an inactive carrier (A) and an HBeAg-negative CHB patient (B) and its computational analysis (C) for the calculation of viral load, which was observed to be 7.55 x 10 3 copies/mL in case of (A) and 2.27 x 10 8 copies/mL in (B).

The three studied groups had predominantly male population with similar median age. ALT levels differed statistically in these groups (ANOVA; P < 0.05). Baseline serum HBV DNA levels among the HBeAg-negative patients were significantly lower than the HBeAg-positive patients (median; 2.30 x 10 5 vs. 1.25 x 10 8 copies/mL; P < 0.05) and significantly higher than the inactive carriers (median; 2.30 x 10 5 vs. 4.28 x 10 3 copies/mL ; P < 0.05).

HBV DNA levels overlapped extensively between HBeAg-negative CHB patients and inactive carriers; despite this the levels between the two groups differed statistically. The optimal HBV DNA cut-off level on Receiver Operator Curve discriminating HBeAg-negative CHB and inactive carriers was 2.50 x 10 4 copies/mL, with 75.60% sensitivity and 78.60% specificity [Figure - 2]. Nine out of forty-two (21.42%) of inactive carriers were above and 24.44% (11/45) of HBeAg-negative CHB patients were below this value. However, 1/42 (2.38%) of the inactive carriers and 27/45 (60.00%) HBeAg negative CHB were respectively, above and below the NIH cut-off value of 10 5 copies/mL .

Discussion

HBV-infected patients show variety of clinical symptoms ranging from an apparently healthy inactive carrier state to fulminant hepatitis or chronic liver disease, including cirrhosis and hepatocellular carcinoma. [1],[2] Inactive carriers have lower risk of progression to liver cirrhosis as well as to liver cancer compared to chronic hepatitis B patients with the latter benefiting from the anti-viral treatment. [4] One of the most common ironies in case of chronic hepatitis B patients is the differentiation between HBeAg-negative CHB cases from the inactive carriers as they share their serological profile. [14] Viral load quantification plays a vital role in the better management of this dreadful pathogen [15] as it is helpful in defining the state of infection, [16] designing drug regimen [17] as well as in monitoring antiviral treatment. [18] Consequently, the present study was attempted to define the serum HBV DNA cut off levels differentiating the three studied states of HBV infection relating to Indian population.

In our study, the observed median HBV DNA levels in different stages of HBV infection were different from the ones reported earlier on other populations of the world. [6],[7],[8],[9] However, the median HBV DNA level for the HBeAg-positive patients was statistically higher than the HBeAg-negative ones and similar trend was observed between the HBeAg-negative CHB patients and the inactive carriers [Table - 1]. Various studies on different populations of the world suggest that a lower cut-off value appears to be a better marker for differentiating HBeAg-negative CHB patients from the inactive carriers [6],[7],[8],[9] as compared to NIH recommended value of 10 5 copies/mL . In the present study also, we found 2.5 x 10 4 copies/mL [Figure - 2] as a better limit to differentiate the said categories of individuals. On categorising the patients according to NIH guidelines, 60.0% of HBeAg-negative-CHB patients were below and 2.4% of inactive carriers were above the cut off value. Similarly, according to 2.5 x 10 4 copies/mL value, 24.4% of HBeAg-negative CHB and 21.4% of inactive carriers were below and above this value, respectively. The data of inactive carriers in this study is in accord with earlier report by Martinot-Peignoux et al. , [19] according to which 98% of the inactive carriers have HBV DNA levels below the NIH cut-off level and 97% of them were found to be stable during follow-up. HBV DNA levels of HBeAg-negative CHB patients could not be compared, as they were not included in their study. However, according to a study by Chu et al. , [6] NIH recommended value excluded 45.0% of HBeAg-negative CHB patients in their population. Similarly, Hoe et al. , [7] observed while studying Korean population, that NIH value exclude 40.4% HBeAg-negative CHB patients and additionally, 20.0% of the inactive carriers were above this value. Evidently, HBV DNA levels in Indian HBsAg-positive population are lower in both the cases. These variations may be attributed to ethnic differences [20] between the population studied and/or an outcome related to the prevalent genotypes in the respective parts of the world. [21] So far, eight HBV genotypes (A through H) have been identified which vary in their pathogenicity and geographical distribution. [21]

In conclusion, HBV DNA levels vary significantly in different states of the infection, which is helpful in diagnosing the state of infection and in turn help in designing the drug regimen. Cut-off value to classify HBeAg-negative CHB patients and inactive carriers was set at 2.5 x 10 4 copies/mL for Indian population though there was enormous overlapping of HBV DNA levels. Furthermore, such studies on large samples are needed to validate this value. This value shall be imperative in the better management of this dreadful disease in our part of the world.

Acknowledgements

HC is thankful to Council of Scientific and Industrial Research, New Delhi, India, for the award of a Senior Research Fellowship.

References

1.Lee WM. Hepatitis B virus infection. N Engl J Med 1997;337:1733-45.  Back to cited text no. 1  [PUBMED]  [FULLTEXT]
2.Parkin DM, Pisani P, Munoz N, Ferlay J. The global heath burden of incidence of infection associated cancers. Cancer Surv 1999;33:25-33.  Back to cited text no. 2    
3.Gitlin N. Hepatitis B: Diagnosis, prevention and treatment. Clin Chem 1997;43:1500-6.  Back to cited text no. 3  [PUBMED]  [FULLTEXT]
4.Hadziyannis SJ, Vassilopoulos D. Hepatitis Be antigen-negative chronic hepatitis B. Hepatology 2001;34:617-24.  Back to cited text no. 4  [PUBMED]  [FULLTEXT]
5.Lok AS, Heathcote EJ, Hoofnagle JH. Management of Hepatitis B: 2000- summary of a workshop. Gastroenterology 2001;120:1828-53.  Back to cited text no. 5  [PUBMED]  [FULLTEXT]
6.Chu CJ, Hussain M, Lok AS. Quantitative serum HBV DNA levels during different stages of chronic hepatitis B infection. Hepatology 2002;36:1408-15.  Back to cited text no. 6  [PUBMED]  [FULLTEXT]
7.Heo J, Baik TH, Kim HH, Kim GH, Kang DH, Song GA, et al . Serum hepatitis B virus (HBV) DNA levels at different stages of clinical course in patients with chronic HBV infection in an endemic area. J Korean Med Sci 2003;18:686-90.  Back to cited text no. 7  [PUBMED]  [FULLTEXT]
8.Jardi R, Rodriguez F, Buti M, Costa X, Cotrina M, Valdes A, et al . Quantitation detection of hepatitis B DNA in serum by a new rapid real time fluorescence PCR assay. J Viral Hepatitis 2001;8:465-71.  Back to cited text no. 8    
9.Manesis EK, Papatheodoridis GV, Sevastianos V, Cholongitas E, Papaioannou C, Hadziyannis SJ. Significance of hepatitis B viremia levels determined by a quantitative polymerase chain reaction assay in patients with Hepatitis B e antigen-negative chronic Hepatitis B Virus infection. Am J Gastroentrol 2003;98:2261-7.  Back to cited text no. 9    
10.Tandon BN. Viral hepatitis in tropics and its management. JAMA 2001;4:102-6.  Back to cited text no. 10    
11.Costa J, Lopez-Labrador FX, Sanchez-Tapias JM, Mas A, Vilella A, Olmedo E, et al . Microwave treatment of serum facilitates detection of hepatitis B virus DNA by the polymerase chain reaction: Results of a study in anti-HBe positive chronic hepatitis B. J Hepatol 1995;22:35-42.  Back to cited text no. 11    
12.Changotra H, Sehajpal PK. Quantitative detection of serum HBV DNA levels employing a new S gene based cPCR assay. Arch Virol 2005;150:481-91.  Back to cited text no. 12  [PUBMED]  [FULLTEXT]
13.Raeymaekers L. Quantitative PCR: Theoretical considerations with practical implications. Anal Biochem 1993;214:582-5.  Back to cited text no. 13  [PUBMED]  [FULLTEXT]
14.Papatheodoridis GV, Hadziyannis SJ. Diagnosis and management of pre-core mutant chronic hepatitis B. J Viral Hep 2001;8:311-21.  Back to cited text no. 14    
15.Zoulim F. Quantification and genotyping in management of chronic hepatitis B and C. Virus Res 2002;82:45-52.  Back to cited text no. 15  [PUBMED]  
16.Kessler HH, Preininger S, Stelzl E, Daghofer, Santner BI, Marth E, et al . Identification of different states of hepatitis B virus infection with a quantitative PCR assay. Clin Diagn Lab Immunol 2000;7:298-300.  Back to cited text no. 16    
17.Marcellin P, lau GK, Bonino F, Farci P, Hadziyannis S, Jin R, et al . Peginterferon alfa-2a alone, lamivudine alone and the two in combination in patients with HBeAg-negative chronic hepatitis B. N Engl J Med 2004;351:1206-17.  Back to cited text no. 17  [PUBMED]  [FULLTEXT]
18.Buti M, Sαnchez F, Cotrina M, Jardi R, Rodriguez F, Esteban R, et al . Quantitaive hepatitis B virus testing for the early prediction of the maintenance of response during lamivudine therapy patients with chronic hepatitis B. J Infect Dis 2001;183:1277-80.  Back to cited text no. 18    
19.Martinot-Peignoux M, Boyer N, Colombat M, Akrem R, Pham BN, Ollivier S, et al . Serum hepatitis B virus DNA levels and liver histology in inactive HBsAg carriers. J Hepatol 2002;36:543-6.  Back to cited text no. 19    
20.Wang FS. Current status and prospects of studies on human genetic alleles associated with hepatitis B virus infection. World J Gastroenterol 2003;9:641-4.  Back to cited text no. 20  [PUBMED]  [FULLTEXT]
21.Norder H, Courouce AM, Coursaget P, Echevarria JM, Lee SD, Mushahwar IK, et al . genetic diversity of hepatitis B virus strains derived worldwide: Genotypes, subgenotypes and HBsAg subtypes. Intervirology 2004;47:289-309.  Back to cited text no. 21    

Copyright 2008 - Indian Journal of Medical Microbiology


The following images related to this document are available:

Photo images

[mb08040f2.jpg] [mb08040f1.jpg] [mb08040t1.jpg]
Home Faq Resources Email Bioline
© Bioline International, 1989 - 2024, Site last up-dated on 01-Sep-2022.
Site created and maintained by the Reference Center on Environmental Information, CRIA, Brazil
System hosted by the Google Cloud Platform, GCP, Brazil