 |
| About Bioline | All Journals | Testimonials | Membership | News |
|
||||||
|
||||||
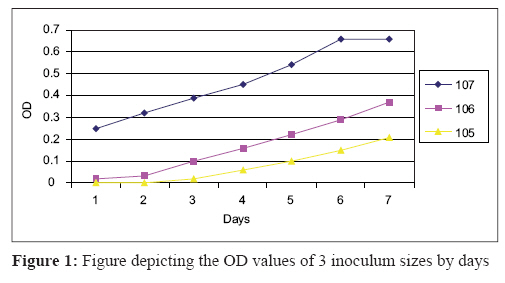
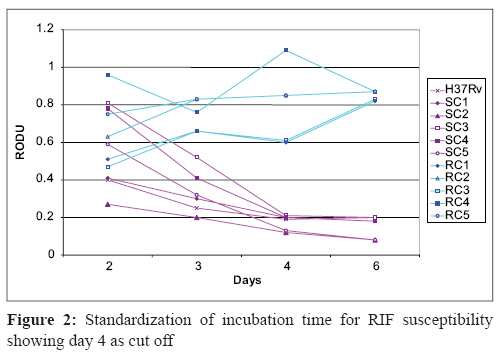
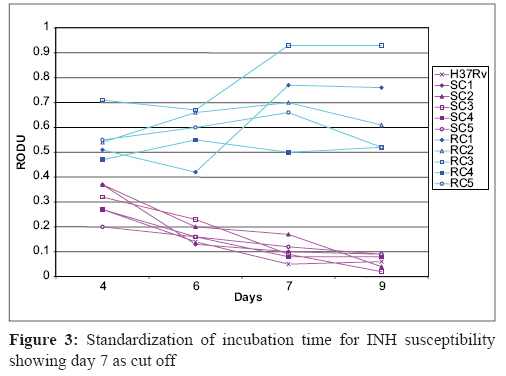
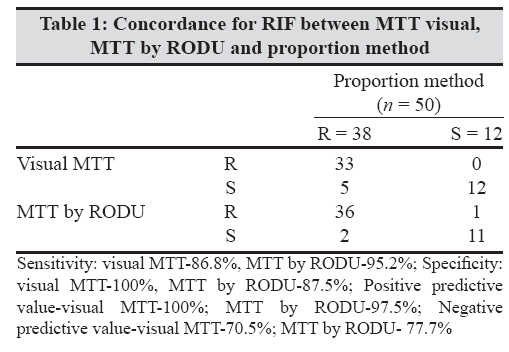
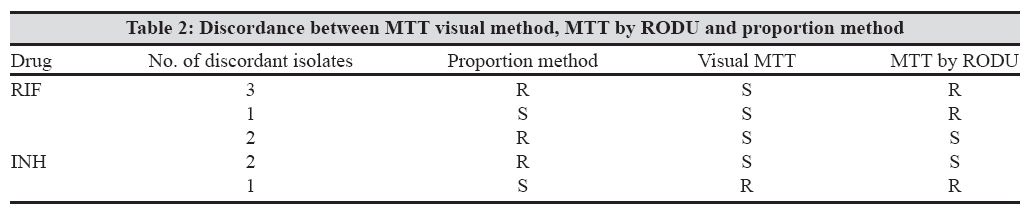
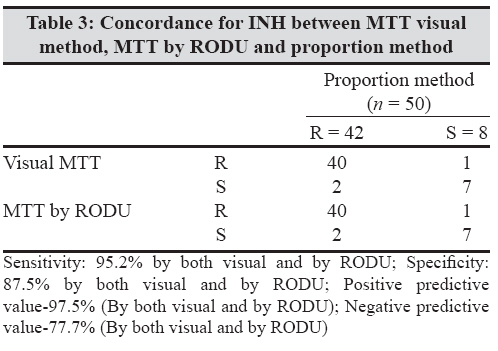
Indian Journal of Medical Microbiology, Vol. 26, No. 3, July-September, 2008, pp. 222-227 Original Article Evaluation of rapid MTT tube method for detection of drug susceptibility of mycobacterium tuberculosis to rifampicin and isoniazid Raut U, Narang P, Mendiratta DK, Narang R, Deotale V Department of Microbiology, Mahatma Gandhi Institute of Medical Sciences, Sevagram, Wardha - 442 102, Maharashtra Date of Submission: 09-Apr-2007 Code Number: mb08070 Abstract Purpose: To evaluate MTT method for detection of drug resistance to rifampicin and isoniazid in M.tuberculosis . This method utilises the ability of viable mycobacterial cells to reduce MTT( 3-4,5-dimethylthiazol-2-yl-2, 5-diphenyl tetrazolium bromide).Methods: The method was standardised with known resistant and sensitive strains of M.tuberculosis and was then extended to 50 clinical isolates. An inoculum of 10 7 cfu/mL was prepared in Middlebrook 7H9 medium supplemented with oleic acid, albumin, dextrose and catalase. For each drug three tubes were used, one with INH(0.2μg/mL) or RIF(1μg/mL), another as inoculum control and third as blank control. These were incubated at 37°C for four and seven days respectively for RIF and INH after which MTT assay was performed. Results were read visually and by colorimeter at 570 nm. Relative optical density unit (RODU) of 0.2 was taken as cut off. Results were compared with drug sensitivity obtained by proportion method using LJ medium. Results: For rifampicin, concordance with proportion method was 90% by visual and 94% by RODU. Sensitivity and specificity was 86.8% and 100% respectively by visual method and 95.2% and 87.5% respectively by RODU. For Isoniazid, concordance was 94% and sensitivity and specificity was 94.7 and 91.7% respectively by both visual and RODU. Conclusions: MTT assay proved to be rapid and cheap method for performing drug sensitivity of M.tuberculosis Keywords: Drug susceptibility, M. tuberculosis, MTT tube method Tuberculosis (TB) is a major public health problem all around the world. India alone accounts for nearly one third of the global TB burden. [1] The condition in India is worsened because of the emergence of multi-drug resistant (MDR) strains of M.tuberculosis . MDR strains can be defined as the strains of M.tuberculosis exhibiting resistance to both rifampicin (RIF) and isoniazid (INH) with or without resistance to another first line drug. [2] The outcome of treatment of patients harbouring such strains of M.tuberculosis is poor and mortality rate is also high. Their chance of being cured is very low and they require significant expenditure of health care resources. They remain infectious for a prolonged period and may therefore be more likely to infect others. [3] Moreover, patients with HIV infection are known to have high risk of developing tuberculosis and the case fatality rate is even higher among the patients with AIDS, who are infected with MDR strains. Thus, the HIV epidemic can rapidly increase the incidence of TB especially of MDR TB. [1] In this situation, rapid demonstration and prevention of spread of MDR strains of M.tuberculosis is the need of the hour. The traditional methods of culture and susceptibility testing using Lowenstein- Jensen (LJ) medium or Middlebrook agar takes 7-12 weeks. The other rapid methods available for detection of MDR TB such as BACTEC 460 TB ® , MGIT 960 ® and other phenotypic or genotypic methods are not affordable for routine use in low income countries like India. So, for developing countries it would be useful to have a simple and inexpensive test that can rapidly detect the MDR TB strains. The colorimetric assay using, 3-4,5-dimethylthiazol-2-yl-2,5-diphenyl tetrazolium bromide (MTT) was introduced by Mossman in 1983 to assess the mammalian cell survival and proliferation, based on the metabolic activity of the cell. MTT is a yellow tetrazolium dye which is cleaved by dehydrogenase enzyme of only the metabolically active cells, and a purple coloured product called formazan is produced which can be read both visually and by a spectrophotometer at 570 nm. The amount of formazan generated is directly proportional to the number of viable cells. [4] The reduction of the dye by the bacteria when incubated in the presence of the drug indicates that the bacteria are viable which in turn indicates that the isolate is resistant to the given drug and vice versa. This principle has been utilized by many authors [5],[6],[7],[8],[9],[10],[11],[12],[13],[14],[15] to assess the susceptibility of the mycobacterial cells in the presence of anti-TB drugs, as well as for susceptibility testing of certain fungi and bacteria. This kind of study has not been reported so far from India where it is indeed necessary as India has a large population of MDR strains. [16] In some of the previous studies, [7],[11],[12],[14] this assay was performed in the microtitre plates posing risk to the laboratory personnel as the open wells of the plate used lead to easy spillage and generation of aerosols. [8],[9] The present study has performed the assay in tubes which not only decreased the hazard but is most appropriate for routine use in the simpler laboratory settings. Fifty isolates of M. tuberculosis were tested by this assay and the results were compared to those obtained by the proportion method on LJ medium. Materials and Methods The study was conducted in the Microbiology department of Mahatma Gandhi Institute of Medical Sciences (MGIMS), Sevagram. As the first step, the test was standardised with respect to the inoculum size and optimum incubation period required for sensitivity testing of both RIF and INH. For this, 10 known M.tuberculosis strains tested by proportion method (5 sensitive i.e., sensitive control-SC and 5 resistant i.e., resistant control-RC to both the drugs) and one standard sensitive (SS) H 37 Rv strain revived from the stock cultures were used. Once standardised, the results were applied to 50 consecutive isolates from suspected TB patients referred from various departments which formed the study subject. They were first identified as M.tuberculosis using standard biochemical tests, [17] were tested for susceptibility to RIF and INH both by Proportion and MTT methods considering proportion method as the gold standard. Medium used Drug solutions Standardisation of inoculum size Standardisation of the incubation time MTT assay Testing of prospective isolates Results In the first part of the study, parameters like optimum inoculum size and optimum incubation period for each of the drug was standardised. It was observed that the lowest OD at which the colour change was visually appreciable was 0.12. With inoculum size of 10 7 cfu/mL (OD 0.21-0.28), visible colour change was seen on day one, with 10 6 cfu/mL (OD 0.12-0.20) it was seen on day three and with 10 5 cfu/mL (OD 0.12-0.17) on day five [Figure - 1]. Therefore the concentration of 10 7 cfu/mL was taken as the standard inoculum size for further testing.As already mentioned in materials and methods, for standardising incubation time, testing was done on day 2, 3, 4 and 6 for RIF and 4, 6, 7 and 9 for INH in order to get the maximum bactericidal activity of the drug. In RIF containing tubes the SC strains and H 37 Rv strain (SS) showed colour change till day three indicating viability but on the fourth day of incubation all showed no colour change (OD = 0.4-0.10) indicating nonviable organisms and sensitivity to the drug. At the same time, colour change in the control drug free tubes continued to show gradual increase in the intensity of colour and the OD values indicating viability of the organisms. The RODU of these SC on the optimum day four was always ≤0.2 [Figure - 2]. In RIF resistant RC isolates the OD and colour change in the drug containing tubes continuously increased till day six thereby indicating metabolic activity and viability of the strains and hence resistance to the drug. On day four, all of them had RODU of> 0.6 (0.60-1.09) [Figure - 2]. Hence for RIF the optimum incubation time was taken as four days. While standardising the incubation time for INH, the colour change to purple in drug free tubes was observed on day four and this gradually deepened till day seven. In drug containing tubes, out of the total 6 INH sensitive strains, 4 strains (SC 1 , SC 2 , SC 4 and SS H 37 Rv) showed slight colour change to purple on day four, but by day six all of them became colourless indicating nonviable organisms. While on the same day significant colour change was present in the control tube indicating viable bacteria. The RODU values when calculated for that day i.e., day six were found to be ≤0.2, which were much lower than the RODU values calculated for the earlier days. Tube with SC 5 , strain was colourless on day four and continued to be so on day nine also indicating viability. However, tube with strain SC 3 showed light purple colour change on day six but became colourless on day seven. RODU values of strain SC 5 were always ≤0.2 while that of strain SC 3 was 0.23 on day six but ≤0.2 on day seven. With INH RC isolates, the OD in the drug containing tubes continuously increased till day seven with the RODU always remaining> 0.2, as was observed with these strains when incubated without the drug. After day seven the RODU values either decreased (RC2, RC5) or remained constant (RC 3 , RC1) or increased (RC4), but never came down to < 0.2 [Figure - 3]. In the second part of the study, 50 prospective clinical isolates after being identified as M. tuberculosis by standard biochemical tests, were subjected to susceptibility testing by proportion method on LJ as well as by MTT method as per the results of standardisation. The readings were taken by both visual and by colourimeter at 570 nm. The two methods were then compared with proportion method which was taken as gold standard. By proportion method, out of the total 50 isolates, 38 were RIF resistant and 12 were RIF sensitive. When compared with MTT, visual reading could identify all the 12 sensitive isolates but only 33 out of 38 resistant isolates could be detected giving the overall concordance of visual MTT as 90%. However, with respect to detection of resistant isolates colourimetric reading was more sensitive as it could detect 36 out of 38 resistant isolates and 11 out of 12 sensitive isolates giving the overall concordance of MTT by RODU as 94% [Table - 1]. Among the discordant results, five isolates which were resistant by proportion method were identified as sensitive by visual MTT and two out of these five were also sensitive by RODU colorimetric method. One isolate which was sensitive by proportion method as well as by visual MTT was found resistant by colorimetric reading [Table - 2]. In case of INH, the results of both MTT methods, visual and colourimetric matched perfectly with each other with respect to not only the numbers but also the strains. For INH eight isolates were sensitive and 42 were resistant by proportion method. The MTT methods detected seven out of them as sensitive and 40 resistant giving the overall concordance of 94 % [Table - 3]. The sensitivity, specificity, positive predictive value and negative predictive value for both MTT methods were calculated as shown in [Table - 1] and [Table - 3]. Discussion MDR TB is fast becoming an important problem particularly in AIDS infected populations. In order to control and prevent the spread early diagnosis and prompt treatment are of paramount importance. Moreover, MDR TB increases the morbidity and mortality in tuberculosis patients as these patients do not easily respond to the re-treatment regimens recommended by WHO. [3] Further, the cost associated with management is also very high. [3] Therefore there is a need to develop newer mycobacterial drug sensitivity tests, which can give the results faster and are less expensive. MTT assay described in the present study could prove to be one such test.In the laboratory, the MTT assay was standardised using the screw capped test tubes instead of microtitre plates which have been tried by some other authors with good results. [7],[11],[12],[14] However, since M. tuberculosis is a conventional pathogen and many of the isolates could also be MDR, performing the test in microtitre plates could pose a grave laboratory hazard because of the generation of aerosols. Abate et al in 1998 and Foongladda et al, in 2002 had therefore used screw cap test tubes for their experiments. [8],[9] Though use of tubes increased the cost of the reagents marginally, the results were better as more amount of medium used in the tubes provided better nutrition for the growth of the organisms. Moreover, according to Abate G et al , change in colour was also better appreciated in the test tubes. [8] In the present study, the results of the MTT assay were read in two ways, visually by observing for the colour change and by measuring the colourimetric OD values of the tubes and both were evaluated by comparison with the results obtained by proportion method taken as the gold standard. Most of the studies based on colourimetry have used spectrophotometer for assessing the OD values. We preferred to use colorimeter as this is much cheaper and is easily available even in developing countries in most of the reasonably equipped laboratories. Since we were measuring only the colour change and not the turbidity, colourimeter was considered to be an equally sensitive instrument. Moreover, the results were expressed in relative OD unit (RODU) which is the ratio of OD of drug containing tube with that of drug free control tubes. During the preliminary tests, when the isolates were inoculated directly from the stock culture with only few days of incubation or when cultures of more than seven to eight weeks of incubation were used to set up the experiment, the results obtained were extremely erratic. The reason for such kind of observation was that MTT assay requires metabolically active cells because only such cells can produce dehydrogenase enzyme which causes reduction of the tetrazolium dye. It was thus inferred that young and fresh cultures of two to four weeks old should only be used for the test. Similar observation has been made in the literature [18] in case of another dye, resazurin therefore when subsequently subcultures on LJ with four weeks old growth were used for the test, consistent and acceptable results were obtained. Standardisation of the size of inoculum is of utmost importance as there is a large difference from culture to culture in the number of colonies that grow from a similar inoculum, specified by weight or opacity. [19] This can be attributed to the difference in the number of susceptible or resistant organisms in the inoculum and to some degree to clumping of the bacilli. [20] In our study, out of the three different dilutions used we found an inoculum of 10 7 cfu/mL (equivalent to McFarland No. 1)[7],[9],[10] to give the visual colour change, showing reduction of MTT as early as day 1 i.e., much before the other dilutions. Hence, this concentration was taken as the standard inoculum size for further testing as used by other authors as well. [9],[10],[13],[14] It was also found that the visible amount of colour change indicative of metabolic activity of the bacteria could be detected only when the OD values were> 0.11 and the OD values increased with the increase in intensity of colour change. In the next step, in order to standardise the time that would be needed for getting the optimum activity of RIF and INH on the sensitive control (SC) isolates in our setting, we incubated the tubes at 37°C for 2, 3, 4 and 6 days for RIF and for 4, 6, 7 and 9 days for INH. The incubation time for INH was kept more than that of the RIF because INH acts only on the actively multiplying bacteria and that stage is reached only by seven to ten days. [21] Since the incubation period for INH was prolonged, the inoculum size was reduced so that by the time the drug acted on the bacteria the number would have reached the optimum required for the test. We used the RODU (Relative Optical Density Unit) values for the interpretation of the test instead of using only colour change because based on the principles of Canetti et al, variations between the clinical isolates to reduce the MTT is due to the in vitro differences in the growth characteristics and the differences in the proportion of drug sensitive and resistant strains within the total population of the mycobacteria. To balance for strain differences in the ability to reduce MTT, RODU, which is a ratio between the OD of the drug containing tube and the OD of the drug free control tube, is considered more relevant. In the study we found that the value of RODU as 0.2 could be used as a cut off for differentiating drug sensitive from resistant isolates. The cut off used for both RIF and INH was ≤0.2 to label the strain as sensitive while,> 0.2 was indicative of resistance. This cut off was fixed as on day four for RIF when all the known RIF sensitive control strains (SC) visually showed a sensitive result (i.e.,no change in the RIF containing tube), and the RODU values for these strains were all ≤0.2 [Figure - 1]. In case of all the known RIF resistant strains the RODU values were> 0.2 from day two onwards [Figure - 1]. For INH testing, as shown in [Figure - 2], all the known sensitive control strains showed optimum activity in INH containing tubes (i.e., no change in the colour) on day seven and on this day RODU value of all the sensitive strains was < 0.2. While in case of all the INH resistant strains RODU values were always> 0.2. These results were further confirmed on repeat experiments. When the prospective strains were tested by MTT method, in case of detecting RIF resistance, colorimetric method of calculating RODU was found to be superior to visual reading and concordance with proportion method was also high for the former than for the latter. However, the findings by visual readings also had their own advantage. All the 33 isolates recorded as resistant by visual reading were also resistant by proportion method. This indicated that if a strain is read as resistant by visual method it is most likely to be resistant but the vice versa is not true. This inference is important for small laboratories which can use this test for rapid screening of the resistant isolates. If the isolate turns out to be visually resistant it can be safely reported as resistant but if it turns out to be sensitive it must be referred to better laboratories to be tested by proportion method for it may or may not be a sensitive isolate. There is very little literature on INH susceptibility testing. Further studies for evaluation of this test for the susceptibility need to be done with larger number of susceptible strains. As far as the detection of drug resistance was concerned, MTT method, both visual and by colourimetry, was found to be an efficient tool for INH also. One of the objectives of the study was also to evaluate the cost effectiveness of the method. We calculated the approximate cost for the drug susceptibility test of M. tuberculosis for both RIF and INH by Proportion method on LJ; by MTT method and also by BACTEC method. Taking the cost of both RIF and INH together, amongst the three methods, proportion method on LJ was found to be the cheapest, costing only Rupees 10 while BACTEC was the costliest method requiring Rs. 560. The cost of MTT method for the two drugs was only Rs. 60/-. This is well within the affordable range of the patients and looking into the rapidity of the turn around time of four days for RIF and seven days for INH, it is worth using in the laboratories. Therefore, MTT method can prove useful for diagnosis and treatment of TB patients in limited resource countries like India. References
Copyright 2008 - Indian Journal of Medical Microbiology The following images related to this document are available:Photo images[mb08070f2.jpg] [mb08070f1.jpg] [mb08070t3.jpg] [mb08070t1.jpg] [mb08070t2.jpg] [mb08070f3.jpg] |
| |||||||||