 |
| About Bioline | All Journals | Testimonials | Membership | News |
|
||||||
|
||||||
African Journal of Biomedical Research, Vol. 3, No. 2, May, 2000, pp. 135 - 137 Short communication BLOOD AND PLASMA VOLUMES IN NORMAL WEST AFRICAN DWARF SHEEP L.A. DUROTOYE[1] AND J.O. OYEWALE Department of Veterinary
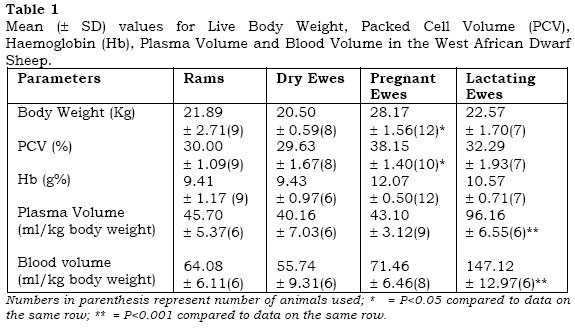
Physiology and Pharmacology, University of Ibadan, Ibadan, Nigeria. Received: September 1999 Code Number: md00037 SUMMARY Blood and plasma volumes were determined using T-1824 in 36 normal adult West African Dwarf sheep. In the rams, dry ewes, pregnant ewes and lactating ewes, the mean values for the blood volume (ml/kg body weight) were 64.08 ± 6.11, 55.74 ± 9.31, 71.46 ± 6.46 and 147.12 ± 12.79 respectively, while the mean values for the plasma volume (ml/kg body weight) were 45.70 ± 6.37, 40.16 ± 7.03, 43.10 ± 3.12 and 96.16 ± 6.55 respectively. Anaemia during pregnancy was not observed in these sheep, while as lactation advanced, the strain of lactation reduced the body weight in the lactating ewes and caused a progressive reduction in the blood and plasma volumes in these animals. The primary index of metabolic activity in any organ is the blood flow through the organ. In this regard, some investigators favour the opinion that blood volume in an adult animal remains unaltered as body weight increases with fat deposition and therefore blood volume and body weight correlate poorly in adult animals. (Meyer et al., 1953). The total blood volume has been shown to be a function of the lean body weight (Schalm et al., 1975). Barcroft et al., (1939) measured the changes in blood Volume and plasma volume in the sheep, and found increases during gestation. The inference of lactation was not investigated. Macfarlane et al., (1959) measured the plasma volume in lactating and non-lactating ewes. They found that lactating ewes had a larger plasma volume per unit weight than non-lactating ewes, but the influence of pregnancy on the results was not evaluated. The blood and plasma volumes in the normal adult West African Dwarf (WAD) sheep have not been reported before and this study was aimed at providing an information on these parameters in the dry ewes, lactating ewes, pregnant ewes and rams in this breed. MATERIALS AND METHODS. Experimental Animals. Thirty six normal West African Dwarf (WAD) sheep consisting of 19 rams, 12 pregnant ewes, 9 dry ewes and 7 lactating ewes, with ages between 2 and 4 years and belonging to The Ministry of Agriculture, Iwo Road, Ibadan, Nigeria, were housed in peins at night and allowed grazing on grass/legume pastures during the day. The grazing was supplemented by a commercial brewers grains (International Breweries Limited, Ilesha, Nigeria) and tap was given ad libitum. Blood collection. Each sheep was weighed and about 10 ml of blood was collected from the external jugular vein into a dry bijou bottle containing disodium salt of ethylene diamine tetra acetic acid (EDTA). The packed cell volume (PCV) and haemoglobin (Hb) values were determined as descried by Benjamin (1978) using the microhaematocrit and Cyanmethaemoglobin methods respectively. The remaining blood was centrifuged at 3,000 r.p.m. for 30 minutes to obtain plasma and the plasma volume was determined by the methods of Kennedy et al., (1938) using the Evans blue dye (T1824) with some modifications. A 1-% solution of T-1824 was injected into the jugular vein at 1 mg/kg body weight and about 10 ml of blood was collected 6 minutes after the injection from the opposite jugular vein. The dye-containing blood sample was centrifuged and the plasma obtained. The optical density of the dye-containing plasma was determined in a Colorimeter, Model CE404 (Cecil Instruments, England) at 625mm against the dye-free plasma, which was used as the blank. Standard dye concentration of 20 mg/ml was used for determining the dye concentration in plasma. The plasma and total blood volumes were calculated as described by Schalm et al., (1975) without correction for the trapped plasma in the haematocrit. RESULT As expected, pregnant ewes in this study were heavier than lactating and dry ones as indicated by the mean live body weight of 28.17 ± 1.567 kg, 22.57 ± 1.7 kg and 20.50 ± 0.59 kg respectively for the pregnant, lactating and dry ewes. These differences in weight are significant (P<0.05>0.02, Table 1). Among the female ewes used in this study, higher mean PCV was recorded for the lactating ewes than for the dry ones (32.29 ± 1.93% versus 29.63 ± 1.67%). This difference is however not significant. However, a significantly (P<0.05) higher mean PCV value was observed for the pregnant ewes relative to either the dry or the lactating ones. (Table 1). In addition, the mean PCV for the female sheep in three different physiological states (dry, pregnant and lactating) in this study is 33.36. Although this value is slightly higher than that of the rams used in this study (30.00%), this difference did not attain statistical significance. The means of Hb values observed in the four groups of sheep used in this study expectedly followed the pattern observed for the PCV, being highest in the pregnant, than in the lactating ewes, the dry ewes and the rams. However, only the difference in PCV between the pregnant and dry ewes are significant (P<0.05>0.02). When compared to the pregnant and dry ewes, mean plasma volume in the lactating ewes is highly significant (P<0.001), being 240% and 224% higher than in the dry and pregnant ewes respectively. Plasma volume did not differ significantly between the rams and dry ewes (45.70 versus 40.16, Table 1). The pattern of the variation in this study is similar to that observed for the plasma volume in other animals. The mean value for the blood volume observed for the lactating ewes 147.12 ± 12.79 was 263% and 206% higher than in the dry and pregnant ewes respectively. The mean values for the total blood volume for the three groups of female ewes in this study is 91.44-ml/kg body weight. This is significantly (P<0.05) higher than the mean value of same parameter (164.08 ml/kg body weight observed for the rams in this study. In both the pregnant and lactating ewes in this study, increasing body weight was associated with increased with increasing plasma and blood volumes. The situation is however different in the case of the dry ewes in which both the plasma and blood volumes fall with increasing body weight. DISCUSSION The higher live body weight recorded in this study for the pregnant ewes than for the dry and lactating ewes is not unexpected as it represents similar situation in all mammals. The increase in body weight experienced during pregnancy is primarily due to the weight of the developing fetus, and sometimes to body weight growth and storage in animals which have not attained maximum growth before becoming pregnant. In a study in which 35 first pregnancy Guernsey cows were used (Morgan et al., 1936), a 35% increase in initial body weight was observed throughout pregnancy. The mean PCV and Hb values of 29.63 ± 1.67% and 9.43 ± 0.97% respectively observed in the dry ewes are lower than the corresponding values of 35% and 10.78% respectively reported in the Suffolk ewes by Hackett et al., (1957). Our values are similar to those of Oduye (1976) who suggested a low intake of iron as one of the possible causes of the observed lower PCV and Hb values in the W.A.D. sheep. Also, in the study by Reynolds (1953) using pregnant Guernsey cows, haematocrit values remained within control range of non-reproducing cows. In the present study, the highest PCV and Hb values were found in the pregnant ewes. This indicates that contrary to the common situation in humans, pregnancy does not exert any negative influence on the PCV and Hb values in the sheep. Fieldman et al., (1936) and Reynold, (1953), have reported the development of hydremia and anaemia in women during pregnancy. A similar report of non-development of anaemia in local breeds of cattle and goat has earlier been made (Reynold, 1953, Durotoye, 1987). We also observed a significantly higher PCV and Hb values in the pregnant ewes than in rams in this study. This represents a significant departure from the situation in most mammals including man under normal situations. In humans, PCV and Hb values in non-pregnant women are lower than in man. The situation is opposite to this as observed in the sheep in the present study. No satisfactory explanation can be advanced for this at the moment, apart from being a species-specific phenomenon. The blood volume increased as a straight-line function with body weight in the pregnant ewes (figure not shown). This corroborated the findings of Bancroft et al. (1953) that body weight, plasma and blood volumes increased throughout pregnant in ewes and cows respectively. This suggests that the increases in the blood volume and body weight may be caused by the increases in the plasma volume and size of the foetus (and cotyledons) respectively as pregnant advanced. This change may however also be due substantially to normal maturing growth and may not be related specifically to gestation (Reynolds, 1953). The values in table 1 indicated that the blood and plasma volumes increased during pregnancy and since these volumes were determined as volumes per unit body weight, the obligatory weight loss following parturition, resulted in an increase in the values of the plasma and blood volumes, and these increased values were maintained during lactation. This agreed with the observation of Reynolds, (1953), and Macfarlane et al., (1959). In this study, as lactation advanced, the strain of lactation reduced the body weight in the lactating ewes Macfarlane et al., (1959), and caused a progressive fall in the blood and plasma volumes, so that when lactation ceased, both blood and plasma volumes had fallen to the levels in the dry animals. However, the mean blood volume of 55.74 ± 9.31 ml/kg observed in the dry ewes is similar to the mean value of 58 ml/kg reported in the 3-year-old Hampshire ewes by Hansard et al., (1953). In the present study, lower values were observed for plasma volume and blood volume in the dry ewes as compared to the rams (Table 1). Panaretto et al., (1965) attributed the increase in body weight in the adult dry ewes to an increase in the amount of adipose tissue in the body. Huff et al., (1956), observed that the adipose tissue had a low blood content, since the ewes and rams used in this study were weight matched, it is possible that the dry ewes had greater proportion of fat to body weight than the rams, hence the lower plasma and blood volumes as the amount of body adipose tissue increases. Thus had been reported earlier, (Swenson, 1984). The blood volume in the rams increased as a straight-line function with body weight, suggesting that they were growing and not depositing as much as the Dry ewes. This is in accordance with the findings of Courtice (1943), Who suggested an increase in the bulk of the animal tissue especially muscle as a cause of the increase in blood volume when the body weight increased. A similar relationship between body weight and blood volume has been demonstrated in adult male domestic chicken (Neewell et al., 1950). However, this study has indicated the mean blood and plasma volumes in normal W.A.D. sheep against which alterations in disease conditions can be compared. REFERENCES.
© 2000 - Ibadan Biomedical Communications Group
The following images related to this document are available:Photo images[md00037t1.jpg] |
| |||||||||