 |
| About Bioline | All Journals | Testimonials | Membership | News |
|
||||||
|
||||||
African Journal of Biomedical Research, Vol. 5, No. 1-2, Jan & May, 2002, pp. 73-76 DETERMINATION OF INDIGENOUS AND FOREIGN ALCOHOLIC BEVERAGES’ LEVELS IN URINE BY QUANTITATIVE INFRARED SPECTROSCOPY 1OLADEINDE, F.O; 2NWANKWO, E.I; 2MORONKOLA, O.A; 3AMOSU, M.A., AND 1FARAYOLA, B. 1Department of Pharmaceutical Chemistry,
Faculty of Pharmacy and Received: December
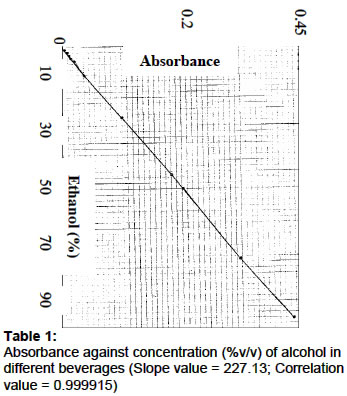
2001 Code Number: md02014 The comparative levels of indigenous and foreign alcoholic beverages in the urine of 24 University students after drinking a cup or shot of the beverages have been reported. The Fourier Transform infrared spectroscopy was used for the analysis. From the results, the percentage content of alcohol (%v/v) in burukutu, palmwine, beer, Ogogoro, gin and ethanol (standard) were 3.2, 6.8, 7.0, 40.0, 41.0 and 96.0 respectively. Similarly, the average levels of alcoholic beverages in the urine (mg/dL) of the students were 120, 200, 210, 220 and 230mg/dL respectively. In conclusion, the present work has shown that there is a relationship between the levels of alcohol consumed and those excreted. Secondly, the study has provided a scientific basis that some of our local beverages such as palmwine, and ogogoro can serve as good substitutes for some of the foreign beverages such as beer and gin respectively. Keywords: Indigenous and Foreign; Alcoholic beverages; Quantitative IR. ** Due to technical difficulties, some figures and images associated with this article may not be available. ** INTRODUCTION Alcoholic beverages have been used since the landing of the Pilgrims (Indiana, 1992). They are non-therapeutic drugs that occupy a distinct place in our society. There are three main varieties of alcohol (Jones, 1978). Methyl alcohol (wood alcohol), isopropyl alcohol (rubbing alcohol) and ethyl alcohol (grain alcohol). Ethyl alcohol is the only type of alcohol that can be consumed. Commercial ethanol for consumption is prepared from various forms of starches and sugar by fermentation (palm wine is an exception, being obtained naturally from the sap of palm tree). The percentage content of alcohol in different alcoholic beverages vary, ranging from 2-4% in burukutu, 2-8% in beer and palmwine, and 30-60% in ogogoro, gin and brandy (Ababio, 1990). Alcoholic beverages have almost no food value except calories(2) It is a clear, colorless, mobile volatile liquid that undergoes the following reactions: oxidation, dehydration, reaction with metals, halogen acids or inorganic halides and esterification (Ababio, 1990). Ethanol affects the central nervous system, gastro-intestinal tract, cardiovascular system, endocrine, liver, lipid metabolism, fetal development and has immunosuppression activity. Alcohol is absorbed into blood via the stomach and/or intestine depending on the amount of alcohol consumed. About 90-98% is metabolised in the liver to acetic acid and 2-10% is excreted unchanged. Effects of blood ethanol levels range from none to mild euphoria in 10-50 mg/dL blood concentrations to deep, possibly coma in 250-400 mg/dL blood concentrations. There are several damaging effects of alcoholism such as mental problems, job trouble, frequent blackouts, loss of control etc. Alcoholism can be treated by aversion therapy, psychotherapy, medical treatment and group discussion. There are three different types of alcohol determination methods: dichromate reduction, alcohol dehydrogenase, and gas chromatography. The only specific chromatographic method of the three is quite time consuming. Blood, plasma or serum and urine samples are commonly used for analysis. In a group of volunteers giving ethanol, average urine to blood ratio was found to be 1.35 (Lundquist, 1961). This is so because kidneys do not have the ability to concentrate ethanol. In some European Countries the determination of ethanol in urine is legal evidence (Howanitz et al, 1979). The aim of this research is to determine the alcohol levels in the urine and blood (estimation) of Physical Education Students, University of Ibadan by Quantitative Fourier Transform Infra-red Spectroscopy and work out if any, scientific basis to support the relationship between our indigenous and foreign alcoholic beverages. METHODS Subjects: 24 healthy subjects from University of Ibadan, Ibadan Nigeria between the age of 25 and 42 years took part in the study. The volunteers gave their written consent. Health status of each participant was quite normal. Study Design: The study design is a pre-post test control group design. The volunteers were divided into six groups of four. The first group served as the control without alcohol. Groups 2, 3 and 4 took one cup of beer, palmwine and burukutu respectively. The last two groups, 5 and 6 took one shot (50mL) of gin and ogogoro respectively. The volunteers observed overnight fasts and remained one hour fasted after alcoholic drinks. The subjects were put to motor function.10mL of urine samples were collected before and after alcohol drinks. Preparation of Samples: 5ml each of 96, 45, 25, 10, 9, 8,7,6,5,4,3,2, and 1% ethanol standards were prepared by serial dilution, transferred to clinical tubes and tightly sealed. Similarly, 5ml each of burukutu, palmwine, beer, ogogoro and gin was transferred to clinical tubes and tightly sealed. The urine samples were centrifuged, and the supernatant fluid transferred to five tubes and quickly sealed to prevent evaporation. The samples were kept in the refrigerator until the day of analysis. Storage period was within one month. Quantitative Analysis: Each sample was transferred to the trough attenuated total reflectance cell of the GENESIS II, Fourier Transform Infra-red spectrophotometer. Here the sample molecules interacted with the IR radiation after absorption. The computer was controlled at the keyboard to perform Fourier Transform calculation to obtain an analog signal of absorbance of alcohol against wave numbers, described as an infrared spectrum. Further control at the keyboard produced a digital signal of absorbance at a wave number of maximum absorption of 1043.04cm-1.Standard curves were prepared with different concentrations of ethanol (96%) standard against absorbance and later used to confirm the concentrations determined electronically. A spectrum of absorbance against wavelength was also obtained for each of the beverages.RESULTSA straight-line graph was obtained when absorbances of ethanol standards were plotted against concentrations of between 0-96% (Fig.1) with a slope of 227.13 and a correlation value of 0.999. Table 1 shows the % v/v of alcohol in each of the beverages: burukutu (3.2), palmwine (6.8), beer (7.0), ogogoro (40.0) and dry gin (41.0). A spectrum of absorbance against wavelengths was obtained for each of the beverages (Fig.2). Table 2 shows the average levels of alcohol in urine and blood after consumption of the beverages. The blood concentrations were estimated by dividing all urine values by 1.35 (Lunquist, 1961). The table shows that the average levels of alcohol in urine after consuming burukutu, palmwine, beer, ogogoro and gin were 120,200,210,220, and 230mg/dL respectively. Table 1: Absorbance against concentration (%v/v) of alcohol in different beverages (Slope value = 227.13; Correlation value = 0.999915) Table 1; Absorbance against concentration (%v/v) of alcohol in different Beverages
Table 2 : Average levels of alcohol in urine and blood
DISCUSSION The levels of alcohol in the urine of 24 University of Ibadan students have been determined after consuming alcoholic beverages. Table 1 shows alcoholic levels of 3.2, 6.8, 7.0 %v/v in burukutu, palmwine and beer respectively. These are weak alcoholic beverages, which are not distilled. Ogogoro and gin contained 40.0% and 41.0% v/v alcohol respectively (Table 1). These are hard liquors with higher alcoholic levels because they are produced by distillation of the weak beverages. From these results, our local beverages: palmwine and ogogoro can serve as good substitutes for foreign beverages such as beer and gin respectively. The concentrations (%v/v) of alcohol in the urine of individuals who consumed similar beverages vary slightly. This was due to variations in the rate of absorption and metabolism in the subjects. The rates of metabolism and absorption are usually affected by several factors such as body and liver weight, gastric emptying time, blood flow etc (Jones, 1978). When alcohol is ingested, it has been reported by many researchers that 90-98% will be metabolised in the liver while the remaining will be excreted in the urine, sweat and breadth (Hall, 1985). In this study 4.69, 3.68, 3.71, 0.68 and 0.68% of the administered doses of burukutu, palmwine, beer, ogogoro, and gin respectively were excreted in urine. The levels of alcohol in the urine were high when compared to the volume of alcohol consumed (Table 2). This was because the beverages were taken on empty stomach and within a short period, therefore absorption was rapid (Rang et al, 1999). When the levels of alcohol in the urine and blood (Table 2) were related to the standard behavioral pattern (Howanitz et al, 1979; Girdwood, 1979; British Pharmaceutical Codex, 1979), those who ingested burukutu would have a mild influence on stereoscopic vision and lack of adaptation. While those who drank palmwine would be expected to experience euphoria, disappearance of inhibition and prolonged reaction time, those who ingested beer, ogogoro, and gin would undergo moderately severe poisoning with greatly prolonged reaction time, loss of inhibition and slight disturbance in equilibrium and coordination However, in chronic alcoholics, there is a remarkable degree of tolerance to potentially lethal ethanol levels ranging from 500-780mg/dL (Howanitz, 1979). In most countries, a blood alcohol level greater than 100mg/dL means that an individual is legally drunk. The importance of such legislation is emphasized on the fact that the average person with a blood alcohol level of 100-150mg/dL is 7-25 times more likely to have a fatal accident while driving. (Jones, 1978). All the subjects in this study were legally drunk except for the consumers of burukutu. Acknowledgement: Our thanks go to the Research and Development officer of the PZ, Ikorodu, Lagos State, Nigeria for his technical assistance. REFERENCES
© 2002 - Ibadan Biomedical Communications Group The following images related to this document are available:Photo images[md02014f1.jpg] | |||||||||||||||||||||||
| |||||||||
