 |
| About Bioline | All Journals | Testimonials | Membership | News |
|
||||||
|
||||||
African Journal of Biomedical Research, Vol. 6, No. 2, May, 2003, pp. 95-100 THE EFFECT OF MEMBRANE DIFFUSION POTENTIAL CHANGE ON ANIONIC DRUGS INDOMETHACIN AND BARBITONE INDUCED HUMAN RED BLOOD CELL SHAPE CHANGE AND ON CELLULAR UPTAKE OF DRUGS.NWAFOR A. AND COAKLEY W. T. Department of Human Physiology, Faculty of Basic Medical Sciences, College
of Health Sciences, University of Port Harcourt, Nigeria Code Number: md03018 The effect of membrane potential change on anionic drugs Indomethacin and barbitone induced human erythrocyte shape change and red cell uptake of drug has been studied using microscopy and spectrophotometry techniques respectively. The membrane potential was changed by reducing the extracellular chloride concentration while maintaining the ionic strength and the osmolarity of the cell suspending solutions constant. At indomethacin and barbitone concentractions necessary to cause marked cell crenation membrane diffusion potential change from - 7.1 mV to 16 . 4niV, led to the reversal of the shape changing properly of the drugs to cup formers. The cellular uptake of drug increased with increasing membrane potential. The membrane potential dependent shape change was also reversible on revering the membrane potential. The results suggest that cellular uptake of drug and drug induced cell shape change was strongly dependent on changes in the extracellular chloride concentration which alter the potential across the erythrocyte membrane. These findings may be of medical significance such as in the design of drugs, for example, for sickle cell diseases, malarial diseases, since knowledge of the concentration and location of the molecules with respect to the membrane surface is required. Key words: Membrane potential anionic drugs, uptake, human erythrocyte. Membrane potential is an important diffusion potential and drug membrane characteristic of the biological interaction (Glaser 1979, 1982, Nwafor membrane. Previous studies of cell-drug and Coakley 1985, 1991). It has been associations (Mohandas & Feo, 1975, shown that at the drug concentrations Kanaho et al 1981; Sheetz and Singer necessary to cause marked cell shape 1974) at membrane potential, E, -7.imV, changes for cationic drugs (Fuji et at suggest that membrane potential of the 1979), membrane diffusion potential human erythrocytes was not of primary change influenced the partitioning of the importance in drug membrane drugs across the membrane (Nwafor and interaction. Further studies have linked Coakley, 2003). The membrane potential crenation of erythrocytes with’ negatively of the human erythrocyte was changed charged drugs and cup formers with by reducing the extracellular chloride positively changed drugs (Denticke 1969, concentration from -7.1mV (145mM Fuji et al 1979) for studies carried out at NaCl) to 16.4mV (60mM NaCl) while extracellular chloride ion concentration maintaining the ionic strength and the around 145mM NaCl (membrane Osmolarity of the red cell suspending potential, E =-7. lmV). Available evidence medium constant (Nwafor and Coakley in the literature now suggest that 1991). In the present study we report on correlation exist between membrane membrane potential change effects on anionic drugs indomethacin and barbitone (Fujii et al 1979) induced erythrocyte shape change and on cellular uptake of drug according to the standard methods (Nwafor and Coakley, 1986, 1991) from which the contributions that membrane potential make to drug membrane interaction will emerge. MATERIALS AND METHODSThe compositions of the erythrocyte suspending solutions of sodium chloride with sorbitol/sodium gluonate buffered with 5m1V1 Hepes at pH calculated to keep the intracellular chloride ion concentrations and cell volume constant has been described in the accompanying paper and elsewhere (Nwafor and Coakley 1991). In addition, the preparation of the buffered solutions of drugs and the ultraviolet absorption maximum measurement were as described in the accompanying paper (Nwafor and Coakley, in press). The absorption maximum (nm) for barbitone was 244 and for indomethacine, 320, Microscopy analysis of the samples were as described in the accompany paper and as in previous studies (Nwafor and Coakley 1991, 1985). RESULTS
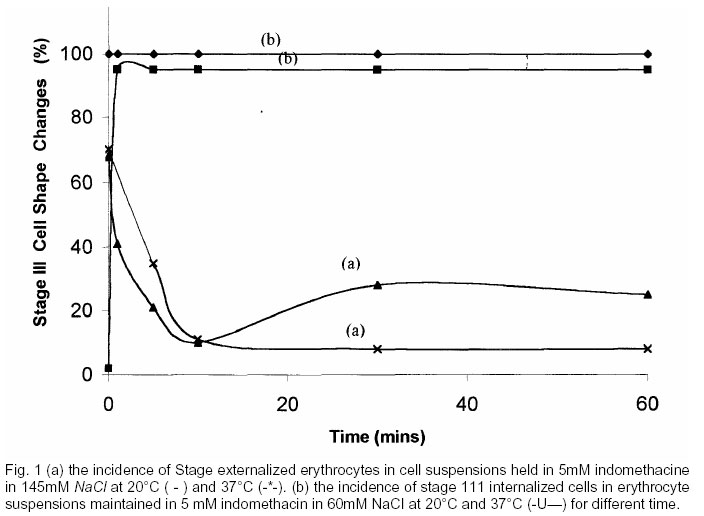
Indomethacin Cells in 60m1 NaCl 5mM Hepes 85mM Na gluconate (E= 16.4mV) with 5mm indomethacin, pH 6.94 internalized membrane. Over 80% of the cells became stomatcoytes (stage III internalization) within 2 mins of exposure to the drug at both 20°C and 37°C (Fig. 1). The cells maintained a constant shape during a one hour exposure to the drug of the two temperatures. At E = -7.1mV (145mM NaCl) the cells showed stage III external cells at both 20°C and 37°C (Fig. 1) in 5mM indomethacin. Cells exposed to 1.0mM indomethacin in 60mM NaCl showed a mixture of discocytes and stage I internalized shapes, whereas cells in 145mM NaCl with 1.0mM of the drug showed mixtures of stage I and II externalized shapes consistent with those previously described for cells in 145mV NaCl, pH 7.32. Cells in 1.0ml\4 indomethancin did not detectably change their shape during a one hour exposure to the drug at 20°C and 3 7°C. Table 1: Time-dependent shape change of human erythrocytes which have been exposed to 5mM indornethacin in 60mM NaCl 85 mM Na. Gluconate 5mM Hepes, Ph 6.94 for 30 mins at 37°C and after centrifugation, the cells were resuspended in (a) 1 45mlVl NaCl 5 mlvi Hepes with the drug, pH 7.32, and (b) 60mM NaCl 85 mM Na gluconate 5 mlvi Hepes with the drug, pH 6.94, at 37°C. The results shown are the average of five experiments at each membrane potential.
Table 2: Time-dependent shape change of human erythrocytes which have been exposed to 5.0 mM indomethacin in 145 mM NaCl 5.0 mlvi Hepes, pH 7.32 for 30 mins at 37°C and after centrifugation, the cells were resuspended in (A) 145mM NaCI 5,0mM Hepes with the drug, pH 7.32, and (B) 60mM NaCl 85 mlvi Na gluconate 5.0 mM Hepes with the drug, pH 6.94, at 37°C. The results shown are the average of five experiments at each membrane potential.
Table 3: Time-dependent shape change of human erythrocytes exposed to (a) 120 mM NaCl 25mM NaCl 25mM Na gluconate 5mM Hepes with 5mM indomethacin, pH 7.11, at 37°C. The results shown are the average of five experiments at each chloride concentration
Table 4 : The dependent of the shape of human erythrocytes in 5mM indomethacin, for 30 mins at 37°C as a function of both membrane potential and extracellular chloride ion concentration.
Erythrocyte membrane potential influence drug uptake and drug induced shape change. Tables 1 and 2 show the scores of the morphological changes in erythrocytes exposed to indomethacin sequentially at two membrane potentials. Tables 3 and 4 show the dependence of the shape of erythrocytes in 5mM indomethacin as a function of extracellular chloride ion concentration and membrane potential. The membrane potential for a maximum in biconcave form after 30 mm lies between E = -2.lmV and 5.6mV. The maximum lies between E -7.1lmV and -2.1mV for erythrocytes held at 20°C for 30mm (data not shown). If the initial (0 mm) change were taken as the most relevant change then table 4 and fig. 1 would place the potential for maximum discocyte forms between 5.6mV and 16.mV (probably closer to 5 .6mV) for cells at 37°C in the drugs at the two temperatures. At E = - 7. imV the cells showed stage III externalized cells at both 20°C and 37°C in 5mM indomethacin. Barbitone: Cells in 60mM NaCl with 50mM barbitone had an initial low incidence of stage III internalized cells at 20°C and 37°C. After 10mins cells held at 20°C slowly grew towards high incidence of stage III stomatocytic shapes with time while cells at 37°C retained a low incidence of stage III internalized forms. pH did not influence the observed effect of membrane potential change on drug induced erythrocyte shape changes. Erythrocytes shape change induced by added drug in low extracellular chloride ion concentration and low extracellular pH. (such as 6OmM NaCl,5mM Hepes, 85mM Na gluconate, pH 6.94) was similar to that in low extracellular chloride ion concentration and high extracellular pH (such as 60mM NaCl, 5mM Hepes 85mM Na gluconate, pH 7.82). Erythrocytes maintained in 60mM NaCI 5mM Hepes 170mM sorbitol, pH 6.94 or pH 7.32, with added drug had similar shape change to those described for cells held in 6OmM NaCI with gluconate anion, suggesting that extracellular ionic strength and other surface potentials did not influence the shape change. Table 5: The Influence of Membrane Potential on Drug Membrane Association. A) The influence of membrane potential on cellular uptake of drugs B) Shape changes of human erythrocytes induced by drugs in buffered 60mM NaCl 5mM Hepes 85mM Na gluconate, pH 6.94 at 20°C and 37°C A
B
? not relevant (a) the reciprocal of the ratio for the anionic drugs Table 5(a) shows the effect of different extracellular chloride concentration on cellular uptake of indomethacin and barbitone. The association of anionic drugs indomethacin and barbitone with erythrocytes at membrane diffusion potential, E, 16.4mV were greater than was the case for cells at E = - 7.lmV. The partitioning of the negatively charged drugs increased with increasing membrane potential. The ratio of cellular uptake of drug for a constant extracellular chloride concentration by erythrocytes in 145mM NaCl and 60mM NaCl for indomethacin and barbitone and haematocrit has the valves given by column 5 of table 5(a). The ratio of the values for the distribution of indomethacine, barbitone across the membrane calculated at 145mM NaCl and 60mM NaCI at constant haematocrit gave the relative change in interacellular concentration of drug for constant extracellular chloride. The reciprocal of the ratio is also calculated for indomethacine and barbitone. A similar value to the ratio indomethacine was also observed for indomethacine concentration of 0.125mM below the insoluble concentration rage of the drug. DISCUSSIONIn the present study at indomethacin and barbitone concentrations necessary to cause marked red blood cell shape change (Fujii et al 1979), membrane diffusion potential change from E = - 7. lmV to 16.4mV led to the reversal of the shape changing property of these crenators to cup — formers at both 20°C and 3 7°C. While cationic drugs on decreasing the extracellular chloride ion concentration led to the reduction of their cup forming property to crenators (Nwafor and Coakley, 2003). These findings are in contrast to the previous studies in which crenators of erythrocytes have been linked with negatively charge drugs and cup formers with positively charged drugs (Denticke, 1968, Fujii et al 1979) as well as studies of cell — drug associations (Mohandas and Feo 1975, Kanaho et al 1981) carried out at extracellular chloride concentration of 130mM NaCl (E = -4.2mV) and above. If the distribution of charged drugs across the erythrocyte’ membrane is in equilibrium with the distribution, of the chloride ions then. for cells in 145mM NaCl,
for cells in 60mM NaCl
Since the intracellular chloride ion concentrations were kept constant for cells in either 145mM NaCl or 60 mM NaCl, from equations 1.0 and 0.2 we have
For constant haematocrit and constant cell volume the right hand side of equation 3.0 for the positive charged drugs is equal to and for negatively charged drugs it would be equal to The ratios obtained for the influence of membrane potential on cellular uptake of indomethacin and barbitone by the erythrocyte is consistent with the view that membrane potential alter the partitioning of indomethacin and barbitone across the human eiythrocyte membrane in manner which is strongly dependent on the chloride ion distribution, Measurements of amphipath concentration in model and biological membrane using the technique of hygroscopic desorption, suggest that amphipathi molecules are taken up by red cells in such smaller amounts than model membrane (Conrad and Singer 1979, 1981). The binding of the small amphipathic molecules to the lipid phase of erythrocyte membrane has been attributed to some “type of micelle formation between the amphipath from the membrane”, the mixed micelles being loosely associated with the cell membrane. Recent electron spin resonance (EPR) experiments suggest that amphipathic molecules do probe the hydrophobic regions of both model and biological membranes and do not form micelles on the membrane surface (Moules et al 1982, GafThey et all 983). It is therefore concluded that there is a strong influence of extracellular chloride ion concentration on cellular uptake of drug and drug induced cells shape change. The effect on shape change of altering membrane potential from —7. lmV to 1 6.mV at 37°C was ranked in the order anionic > cationic > neutral drug. The observation that transmembrane potential can modif the partitioning of drugs tested across the erythrocyte membrane may be of medical significance such as in the design of drugs, for example, for sickle cell diseases, malarial diseases or useful in the design of chemical reagents that interact with biological membrane (such as proble), since a knowledge of the orientation and location of the molecules with respect to the membrane surface is required. REFERENCES
© Ibadan Biomedical Communications Group The following images related to this document are available:Photo images[md03018f1.jpg] | |||||||||||||||||||||||||||||||||||||||||||||||||||||||||||||||||||||||||||||||||||||||||||||||||||||||||||||||||||||||||||||||||||||||||||||||||||||||||||||||||||||||||||||||||||||||||||||||||||||||||||||||||||||||||||||||||||||||||||||||||||||||||||||||||||||||||||||||||||||||||||||||||||||||||||||||||||||||||||||||||||||||||||||||||||||||||
| |||||||||

