 |
| About Bioline | All Journals | Testimonials | Membership | News |
|
||||||
|
||||||
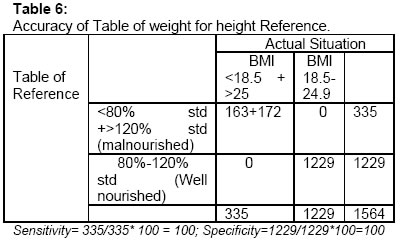
African Journal of Biomedical Research, Vol. 6, No. 3, Sept, 2003, pp. 133-136 DEVELOPMENT AND EVALUATION OF WEIGHT AND HEIGHT REFERENCE STANDARD FOR YOUNG ADULTS (18-24yrs) IN IBADAN , NIGERIA . R. A. SANUSI Department of Human Nutrition, College of Medicine , University of Ibadan . Ibadan , NIGERIA . Code Number: md03054 The extent and severity of malnutrition in a study population cannot be estimated unless it is compared with a reference standard accepted as normal. While international reference standard exists, it has been suggested that locally generated norms would be more realistic and appropriate, especially in adults where great variations in stature among nations exist. This study was undertaken to develop a table of reference standard for weight and height for young adults in Nigeria . Data were obtained from two thousand, six hundred and sixty-five (2,665) Nigerians aged between 18 and 25years. Weight and height data from the well-nourished using the body mass index (BMI 18.5-24.9) were used to develop predictive models/equations using regression analysis. These regression models were used to generate a table of reference standard for weight and height for young adult Nigerians. This table of reference was evaluated using another set of data generated from the same locality. The sensitivity and specificity of the table was 100%. This table of reference standard therefore provides norms for weight and height of well-nourished adult Nigerians in Ibadan . It is also user-friendly since it obviates the calculations involved in body mass index. Keywords: reference standard, weight for height, INTRODUCTION The extent and severity of malnutrition in a study group cannot be estimated or assessed unless it is compared with a reference data. Furthermore, in clinical settings, anthropometric indices are used to monitor growth of individuals, identify protein energy malnutrition and monitor changes after intervention (Gibson, 1990). In developed countries, population specific anthropometric data are used to identify individuals with growth disorders as well as to assess the nutritional status of the healthy and sick individuals. In Africa where famine, wars and other natural disasters and food insecurity are not uncommon, anthropometric data are of great value in the evaluation of biologic impact of food deprivation (Balogun, et al, 1994). The NCHS/CDC/WHO reference data for weight and height is recommended for international use (WHO, 1983) because it satisfies several of the criteria expected of a reference data. It has been suggested, however, that locally generated norms would be more realistic (Goldstein and Tanner, 1980). Since collection and collation of local reference data is difficult, time-consuming and expensive, only few countries have generated their local reference standards (Gopalan and Chatterjee, 1982). An international reference standard may be a good approximation for use for children 0-5years old because there is little difference between growth curves of children of the elite group in less developed countries and those in industrialized nations(Stephenson, et al 1983). This is not valid for adults since adult size and stature vary greatly (Gopalan 1993, Gibson 1990). In a study of nutritional status of pregnant women and pregnancy outcomes (Sanusi et al, 2002), there arose a need for a locality-specific weight and height reference data. The absence of this data necessitated this study, to provide in the interim, predictive equations for weight and height derived from young adults aged 18-24 years in Ibadan . METHODOLOGY The study design was prospective, descriptive and cross-sectional. It was undertaken in Ibadan , the capital city of Oyo state, Nigeria . The period of data collection was from January 1999 to April 1999 and August to November 2000. The selection of subjects for this study was in two phases. The criteria for inclusion in both phases were age and nationality. All the subjects who participated in the study were young Nigerian adults aged between 18 and 25years. All were apparently healthy and the females were neither pregnant nor lactating. The data collection was undertaken by trained personnel and supervised by the author. Measurement of body weight was taken in kilogrammes using portable bathroom scales, height was taken using measuring rods marked in centimetres, mid-upper arm circumference (MUAC)was measured in centimetres using a flexible non-stretch fibre-glass tapes according to Jelliffe (1966), and WHO (1983). Other data collected include age, sex, and state of origin of the subjects.The data collected in 1999 were used to generate predictive equations for weight and height. Only BMI that fall within the normal range (BMI 18.5-24.9) were used. The data collected in 2000 were used to evaluate the table of reference. Analysis of data was accomplished using MS-Excel and the statistical package for the social sciences (SPSS for windows) version 10. The Data quality was assured by using trained data collectors, standardizing equipment and techniques and supervision. RESULTS The table of reference standard of weight and height for young Nigerian adults is presented as Table 1. Generating predictive models;In the first phase, 2,665 individuals were assessed, 1468 (55%) were females while 1197 (44.9%) were males. The age and sex distribution are presented in Table 2. The subjects were classified according to BMI. Equal proportion of male and female subjects had acceptable BMI values. Likewise the distribution of underweight and overweight subjects was similar for both sexes (Table 3). Table 1: Generated Reference Weight For Height For Young Nigerian Adults, In Ibadan .
Predictive models: The data of subjects with normal or acceptable BMI (18.5-24.9) were used for regression analysis. The predictive model obtained is shown in Equation 1. Equation I: Predictive models for weight in young adults: Weight= {(61.302*height)-43.199} (females) Weight = {(66.636*height)-51.368} (males) According to regression equation Y = a + bx Where: Y = the dependent variable, These models were employed to generate the table of reference standard (Table 1). Evaluating the reference table : The data used for evaluation of the derived reference table were obtained from 1564 young Nigerians adults, resident in Ibadan . More than half of the subjects (56%) were from the six South-Western States of Nigeria . A summary of their weight and heights is shown in Table 4.Table 2: Age and Sex Distribution
TABLE 3: Nutritional status of young Adult Nigerians by Body mass index (BMI).
DISCUSSIONS : There is a need for locality-specific reference standards (Gopalan et al, 1993), especially in anthropometric parameters. Although it was not the intention of the study to find out the degree and extent of malnutrition in young adults, this was revealed with about 10% prevalence of underweight in both males and females. Table 4: Descriptive statistics of subjects used in validation of Table of Reference.
Table 5: Percentage of weight for height of subjects whose Body Mass Index (BMI) were normal.
The benefit of dietary intake and biochemical method would be needed to adequately explain this finding (Gibson, 1990). While the data for generating reference data (WHO,1978) may take up to ten years to be collected, to allow for the full growth potential of that population to be been attained, it is desirable to have a predictive equation for use meanwhile in specific situations, where the international standard lacks the desired precision (Stephenson et al,1983). The predictive equation for young adults aged 18-24 years showed that weight can be predicted using the equation with a known height. This table of reference values generated in the present study, will be useful in clinical settings and also for on the spot assessment of nutritional status of individuals and groups. It is equally important to be able to use a simple instrument like a bathroom scale to take weights in order for individuals to recognize recent-onset weight loss. While the table cannot satisfy all the criteria required for reference data generation, it provides a readily available tool for use. The advantage or otherwise of this table over the international reference data for weight and height for young Nigerian adults would be the focus of another study. Acknowledgement This work was partly supported from funds from the Senate research grant SRG/COM/1996/10A of the University of Ibadan . The author wishes to thank Professor I.O. Akinyele, of the Department of Human nutrition, University of Ibadan and Professor E.B. Oguntona of the University of Agriculture , Abeokuta , for their useful technical advice. REFERENCES
© Ibadan Biomedical Communications Group The following images related to this document are available:Photo images[md03054t6.jpg] | ||||||||||||||||||||||||||||||||||||||||||||||||||||||||||||||||||||||||||||||||||||||||||||||||||||||||||||||||||||||||||||||||||||||||||||||||||||||||||||||||||||||||||||||||||||||||||||||||||||||||||||||||||||||||||||||||||||||||||||||||||||||||||||||||||||||||||||||||||||||||||||||||||||||||||||||||||||||||||||||||||||||||||||||||||||||||||||||||||||||||||||||||||||||||||||||
| |||||||||