 |
| About Bioline | All Journals | Testimonials | Membership | News |
|
||||||
|
||||||
African Journal of Biomedical Research, Vol. 7, No. 2, May, 2004, pp. 65-70 LETHAL AND SUB-LETHAL EFFECTS OF COPPER TO THE AFRICAN CATFISH (CLARIAS GARIEPINUS) JUVENILES OLAIFA, F.E1*. OLAIFA A.K**, AND ONWUDE, T.E.* *Department of Wildlife
and
Fisheries Management, University of Ibadan. Code Number: md04015 Lethal and sub-lethal effects of copper on Clarias gariepinus were studied using a 96-hour static bioassay. Copper (as copper chloride, CuCl2 . H2O) was used to prepare the stock solution from which five standard concentrations 0.0, 1.8, 3.2, 5.6, and 10.0 mg/L were prepared (coded A – E). 15 juvenile C. gariepinus fish having a mean weight and length 5.8g and 18 cm respectively were used. The 96-hour LC50 estimated using the logarithm method were 0.6, 0.71 and 0.7 mg/l for replicates 1, 2 and 3 respectively with mean as 0.67mg/l. Haematological changes were generally not significant (P> 0.05). Copper concentrations in bone and muscle-tissues were also determined. The mean copper concentration in bone ranged from 1.86 (treatment A) to 17.04 ppm (Treatment E) and muscle 1.29 (treatment A) to 55.5 ppm (treatment E). There were significant differences (p<0.05) in mortality among treatments. Keywords: Lethal, Copper, Catfish juvenile. INTRODUCTION Copper, though essential in diet can be harmful when large single or daily intake occurs. The harmful effects increase with both the concentration and length of exposure. Copper is a common pollutant in surface waters and its toxicity is largely attributable to its cupric (Cu2+) form, which is the species commonly found or readily complexed by inorganic and organic substances and adsorbed onto particulate matter. Complexed copper is biologically unavailable but plants and animals may absorb some copper in the environment. In the unpolluted water, copper may be less than 5 µL/L (Alabaster and Lloyd, 1982). Copper compounds are used for prophylactic purposes to control fish diseases and parasites (Moore et al., 1984). Copper compounds are also used to control algae, kill slugs and snails in irrigation water systems and municipal water treatment systems. The United States Environmental Protection Agency (U.S.E.P.A.) classifies copper sulphate as a pesticide. Elevated levels of copper may become acutely or chronically toxic to aquatic lives. While acute effects may be death, chronic effects could be reduced growth, shorter lifespan, reproductive problems, reduced fertility and behavioural changes. The toxicity of copper to aquatic life varies with the physical and chemical conditions of the water. Factors like water hardness, alkalinity, pH, dissolved oxygen (D.O) and temperature affect the toxicity of copper. Increasing hardness of water from 10 to 400 mg/L in water containing Ictalarus punctatus showed a decreased mortality from 90% to 5% (Pershbacher and Wurts, 1999). Vera et al. (1998) also reported that the liming agent (CaCO3) tends to protect tilapia (Oreochromis mossambicus) against copper hepatoxicity. Fat head minnow (Pimephales promelas exposed previously to copper were observed to be less tolerant to low D.O. concentrations than unexposed fish (Benneth et al., 1995). The toxicity of copper has also been found to reduce in the presence of organic or inorganic substances like suspended solids since complexes adsorption occur with these substances (Oronsaye and Ogunbor, 1998). At low concentrations, copper is an essential element for both plants and animals since it is an important component of enzymes and carries oxygen in crustaceans such as shrimps and lobsters (COPPERINFO,2001). Higher concentrations of copper have however been introduced into the environment due to anthropogenic activities such as mining, electroplating, paint and pigment industries, textile factory effluents and pesticides. Clarias gariepinus is used for this experiment because of its hardy nature, commercial importance and wide acceptability in Nigeria. It is also important to assess at what level copper becomes toxic to juvenile catfish. This work is therefore to determine the lethal concentration of copper to C. gariepinus juveniles, the concentrations of copper in bone and muscle tissues of C. gariepinus juveniles over a 96-hours period and study the haematological responses of C. gariepinus exposed to varying concentrations of copper. MATERIALS AND METHODSJuvenile Clarias gariepinus measuring 58.5g and 18cm mean weight and length respectively were purchased from a fish farm in Ibadan in April 2002. They were acclimatized in de-chlorinated water (tap water exposed to air for greater than 24 hours) in 20L capacity plastic bowl for 5 weeks. 15 fish were kept per bowl and the water in each bowl was changed daily. The fish were fed twice daily at 3% of their body weight with a feed containing 40% of crude protein and those in poor condition replaced. The experiment was conducted in 5 treatments. 4 of the treatments contained varying concentrations of copper 1.8, 3.2, 5.6 and 10.0 mg/L (Reish and Oshida, 1987). The control group contained 0 mg/L copper. Each treatment had two replicates. Physico-chemical parameters of the water. The physico-chemical parameters of the water measured were: dissolved oxygen, temperature, pH and hardness. The temperature of the water was measured using a Gold Cross mercury- in- glass thermometer. This was dipped into the water for two minutes with the mercury bulb fully immersed and the reading recorded. The dissolved oxygen concentration of the water was measured with a Griffin oxygen meter (model 40). The total hardness of the water was calculated using the formula: Total hardness (mg/L) = 20 X titre value / 96 Preparation of the toxicant. Hydrated copper chloride (CuCl2. 2H2O) was used as toxicant and prepared as shown in Table 1. The different concentrations used for the experiment were 0.0, 1.8, 3.2, 5.6, and 10.0 mg/l (Reish and Oshida, 1987). The Copper for each treatment group was weighed out, diluted in de-ionized water and later diluted with 8 litres (the volume of water required to accommodate fish per bowl). Introduction of the toxicant: Feeding of fish was stopped 24 hours before the introduction of the toxicant. The water in each treatment was aerated for 15 minutes per hour during the 96-hour period and the bowls were covered with mosquito mesh – sized nets to prevent fish from jumping out. The set up was monitored hourly to observe changes in fish behaviour and remove dead fish. Table 1 Preparation of the Toxicant Concentrations Used
Preservation fish Sample All dead fish were removed as soon as observed, wrapped in nylon bag and stored in a freezer. A fish was considered dead when it was totally immobile and there was no respiratory / opercula movement. Digestion of Samples. The samples were thawed. 2 and 10 g of bone and muscle respectively were weighed and placed in beakers. 10 ml of freshly prepared nitric acid and hydrogen peroxide (1:1) were added to the samples, covered with a watch glass and set aside till the initial reactions subsided. Each beaker was placed in a water bath on a hot plate and gently boiled at a temperature not exceeding 1600C for about 2 hours to reduce the volume to 3-4 mls. It was cooled and transferred to a 25 ml volumetric flask and made up to volume with de-ionised water (FAO/ SIDA, 1993). The digests were later tested for copper using an atomic absorption spectrophotometer (AAS). The actual concentrations of the copper in the bone and muscle tissues were calculated from the formula: PPMR X Dilution factor Where PPMR = AAS reading of digest Dilution factor = Volume
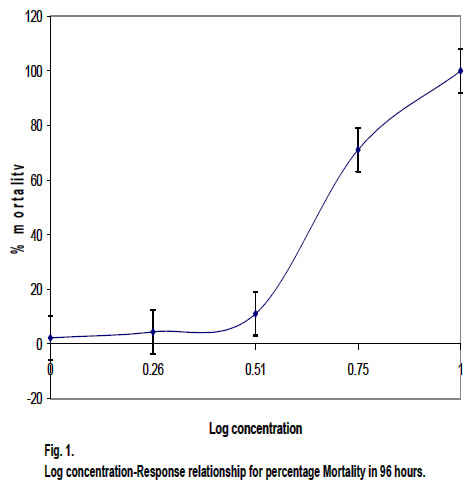
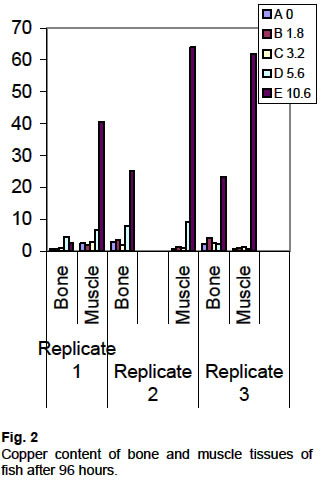
of digest used Estimation of 96 hour LC 50 The Lc50 for copper on juvenile C. gariepinus was determined using the logarithmic method (Litchfield and Wilcoxon,1949, Odiete, 1999). Collection of blood Samples: Blood samples were collected using methods described by Bhagwant and Bhikaje (2000). The blood samples were collected from the survivors at the end of the 96-hour period. Blood was collected using disposable sterile syringe fitted with an insulin needle (0.5 diameter). Blood samples were collected in duplicates for each treatment and the control in sterile bottles containing potassium EDTA (K2 EDTA). All the bottles were properly labeled. Determination of hematological parameters Packed Cell Volume (PCV) was determined in quadruplicate using Hawksley microcapillary tubes and centrifuge at 1,100g for 5 minutes (Abudu and Sofola,, 1994). Red and white blood cell counts and hemoglobin (Hb) were determined using standard methods described by Dacie (1984). The Mean Corpuscular Volume (MCV = PCV/RBC), Mean Corpuscular Haemoglobin (MCH = Hb/RBC), and Mean Corpuscular haemoglobin Concentration (MCHC = Hb/PCV x 100) were all derived from the primary indices as indicated. RESULTS The Physico-chemical Parameters The experiment was conducted at a mean water temperature of 26 +2oC, D.O was 7.22 mg/L while the pH and total hardness were 7.01 and 10.42 mg/L respectively. Mortality The 96-hour Lc50s obtained were 0.6, 0.71 and 0.70 mg/L for replicates 1, 2 and 3 respectively. The percentage mortality of fish are shown in Fig 1. Observed fish behaviour: An hour after the introduction of the toxicant, fish in treatments D and E (5.6 and 10.0 mg/L) exhibited reduced activity, weakness and were covered in thick mucus. Mortality started in treatment E three hours after introduction of toxicant and all fish in the same treatment died within six hours of the bioassay. Foam was observed on the water for all treatments except the control during aeration after the first 24 hours. The fish exposed to copper appeared irritable and showed frenzied swimming activity when the bowls were approached. The fish swam upside down and died with mouths opened. There were significant differences (p<0.05) among treatments in fish mortality. The fish remaining after 96 hours continued to live for two weeks when the experiment was terminated. Chemical Analysis. The Copper content of the bones and muscle tissues of C. gariepinus are shown in figure 2. The fish exposed to high copper concentrations contained more copper than the control. The mean haematological values recorded at the end of 96 hours are presented on table 2. The red blood cells increased in treatment B (1.8 mg/L Cu) when compared to the control. There were however decreases in other treatments (3.2 and 5.6 mg/L). The haemogloblin and haematocrit (PCV) values also showed similar trends. The mean corpuscular volume exhibited a decrease with increasing concentration of Copper and the mean corpuscular haemoglobin for all treatments were lower than the control. The mean corpuscular concentration was highest in treatment E (5.6 mg/L Cu). Table 2: Mean haematological indices of C. gariepinus which survived 96 hours.
The results were subjected to a one – way analysis of variance (ANOVA).No significant differences(p>0.05) were observed among the different treatments. DISCUSSION AND CONCLUSION Copper occurs naturally within the environment. At low concentrations, it is an essential element both for plants and animals. However, large doses can be harmful. Long-term exposure to copper can cause liver and kidney damage and effects on blood. Studies with animals have shown stomach and developmental abnormalities when excess copper is included in diet (Agency for toxic substance and Disease Registry 1999). In fish, copper is a classical limiting factor as it is both essential and toxic. As a micronutrient, it is necessary for haemaglobin synthesis and a component of Cytochrome oxidase (Benneth et al, 1995). In this study, the fish exposed to copper were observed to be highly irritable and displayed frenzied swimming when approached, they swam upside down, their bodies were covered with thick mucus and finally died with mouths opened. These observations were similar to those of Oronsaye and Ogbebo (1995) who worked with adult C. gariepinus exposed to copper in soft water. The chemical analyses of tissues (bone and muscle) showed the accumulation of copper in fish tissues as fish exposed to high copper concentrations contained more copper than the control. The 96 hours LC50 estimated during this study: 0.6, 0.71 and 0.70 mg/L for replicate, 1, 2, and 3 respectively at pH 7.01 and 10.42 mg/L hardness were higher than 0.42 mg/L obtained by Oronsaye and Ogbebor (1995) with 7.2 mg/L hardness and pH 4.8 for adult C. gariepinus. The finding during this study supports the notion that the toxicity of copper decreases with increasing hardness of water (Extension Toxicology Network, 1999) Hamatological indices were also used to study patterns of response of C. gariepinus to exposure to Copper. The red blood cells increased at 1.8 mg/L above control but reductions were observed in treatments C and D (3.2 and 5.6 mg/L) respectively below the control. This suggests that at higher concentrations, there could have been destruction of red blood cells. Similar patterns were also observed for haemoglobin (Hb) values which suggested haemodilution which could lead to anaemia. The swelling of erythrocytes can be inferred from the increase in the MCV values, which is an indicator of the size or state of the red blood cells. Larsson et al.(1985) attributed the increase in MCV to swelling of the red blood cells due to hypoxic conditions or impaired water balance (Osmotic stress) and this may be related to macrocytic anaemia in fishes exposed to metal pollution. In conclusion, although is essential to fish, it needs to be treated with caution. It is therefore necessary to conduct further research on this subject so as to establish standards for tropical fish such as C. gariepinus. This will also help to regulate the discharge of copper in effluents from domestic and industrial sources into aquatic systems. REFERENCES
© 2004 - Ibadan Biomedical Communications Group
The following images related to this document are available:Photo images[md04015f2.jpg] [md04015f1.jpg] | ||||||||||||||||||||||||||||||||||||||||||||||||||||||||||||||||
| |||||||||