 |
| About Bioline | All Journals | Testimonials | Membership | News |
|
||||||
|
||||||
African Journal of Biomedical Research, Vol. 11, No. 2, May, 2008, pp. 145-153 Full Length Research Article HIV/AIDS and Farms’ Production Efficiency in Benue State, Nigeria 1Adeoti, A.I. and 2Adeoti J.O 1Dept. of
Agricultural Economics, University of Ibadan, Ibadan, Nigeria Received: December
2007 Code Number: md08020 ABSTRACT The paper evaluates the impact of the health status of farm households with respect to HIV/AIDS on their cropping patterns, incomes and technical efficiencies in Benue State of Nigeria. Primary data was collected from 155 farm households made up of 55 HIV/AIDS and related sicknesses infected households and 100 non- infected households. The results demonstrated that HIV/AIDS has led to decreased farm size and reduction in the variety of crops cultivated on HIV farms. The average gross revenue, average gross margin and farm profit on non-HIV farms were higher than on HIV farms. The average gross margins for the two farm groups are statistically different at 1 percent level. The significant variables that affect output levels on HIV farms are farm size, hired labour and fertilizer. On non-HIV farms, output levels are affected by farm size, family labour and fertilizer. The technical efficiencies for the two farm groups are statistically different at 1 percent level. Generally, non-HIV farms are more technically efficient with a mean of 0.70 as compared with 0.52 on HIV farms. Increase in the years of schooling reduces the technical inefficiencies of farms in both groups. Keywords: HIV/AIDS, technical efficiency, farm income, Nigeria INTRODUCTION The HIV/AIDS epidemic is one of the greatest health problems confronting the world today. In Nigeria, the first case was reported in 1986 and ever since, there has been a consistent increase in HIV prevalence rate, from 1.8 percent in 1993 to 3.8 percent in 1994. The rate increased to 4.5 percent in 1996, 5.4 percent in 1999 and 5.8 percent in 2001 (FMOH, 2001). Though by 2006, it was reported that the prevalence rate has marginally declined to 5%, the target of reducing the number of infected persons remains a major challenge (NACA, 2006). Although, HIV prevalence rate is lower in Nigeria than in some other African countries like Malawi, Zimbabwe, Botswana, Namibia and Zambia (Kambewa et. al., 2006; Mano and Chipfupa, 2006), the absolute number of people infected is however larger. Furthermore, there are significant differences in the rates of infection within the country, among different sectors of the population living in different parts of the country. The Nigerian economy is predominantly agricultural and the agricultural sector is a major contributor to the country’s Gross Domestic Product (GDP). For example, in 2005, the sector contributed about 40 percent to the GDP (CBN, 2005) and it employed over 60 percent of the total labour force in the country. With the increasing incidence and spread of HIV/AIDS in Nigeria, the supply of labour to agriculture may be threatened. Studies show that youths between the ages of 15 and 35 are the most affected. The average rate of infection among the youth population is 5.7 percent, and the rate is as high as 21 percent in some parts of the country (This Day, 2001). According to the national surveillance survey of the 36 states in the country conducted in 1999, Benue state ranked first with nearly 10 percent of youths in the age bracket 20-24 year old infected with HIV. These youths are the most productive in agriculture and provide much labour to their farm-families. They are mostly used for the hard tasks on the farm, like land clearing, crop planting, weeding and harvesting. The HIV/AIDS epidemic has adverse effects on life expectancy. Mortality rate is rising as a result of HIV/AIDS. It strikes people in their prime years, when they are most productive. It also disrupts the economic and social foundations of families. It has detrimental impact on rural households’ productive capacity. With specific regard to farming households, it has two direct impacts. Firstly, in farm production, labour quality and quantity are reduced. Labour quality, measured in terms of productivity, is reduced when the HIV-infected person is ill. The supply of such household labour falls when the person dies. Moreover, considerable productive time is devoted by other family members to the care of the sick; all these affect the availability of family labour. Secondly, the availability of cash to the family is affected as household financial reserves would be used for the medical treatment of the sick and for meeting funeral costs in case of death. This reduction in the farm-household’s financial resources may lead to a reduction in farm investments, an increase in household food insecurity, deteriorating standards of living and poverty. HIV/AIDS is no longer considered solely as a health problem but rather as a developmental one; which demands an holistic consideration of the problem. In view of this, this paper considers the economic impact of HIV/AIDS and specifically it’s effect on farms’ production efficiency. OBJECTIVES The main objective of the study reported in this paper is to determine the impact of HIV/AIDS on the cropping patterns and technical efficiency of farms in Benue State of Nigeria. The specific objectives are to: i) analyze the cropping patterns in the study area and the changes which have occurred due to HIV/AIDS infection; ii) carry out a comparative analysis of the outputs and incomes of households with and without HIV/AIDS infection; and iii) evaluate the comparative technical efficiencies of farms owned by households with and without HIV/AIDS infection. MATERIALS AND METHODS The study area and sampling procedure The study was conducted in Benue State, located in the middle belt region of Nigeria. The main tribes are the Tivs and Idomas and their main occupation is farming The crops commonly cultivated include yams, cassava, maize, soybeans, rice, guinea-corn, millet and beans. The sampling procedure involves multistage sampling. The sampled area in the state was selected using the approach of Barnett and Blaike (1992). They hypothesize that not all farming systems are equally vulnerable to the loss of labour. The extent of each farming system’s vulnerability to HIV/AIDS depends on its adaptations to the loss of labour. They opine that areas with favourable agro-ecological conditions which allow for the cultivation of a wide range of crops are less vulnerable than areas with marginal agro-ecological conditions. The seasonal demand for labour and the division of labour by gender and age can also affect the vulnerability of a farming system to the incidence of HIV/AIDS. The Benue State Agricultural Development Project (BNARDA) has divided the state into three zones namely northern, eastern and central zones. With a map of HIV incidence overlaid on the cropping system in the state, a vulnerability map for the state reveals the Idoma area to be more vulnerable to the disease, relative to the Tiv section of the state. A purposive sampling of the central zone where the Idomas live was made. Two local government areas (LGAs) were purposively selected in the zone, namely Otukpo and the adjoining Ohimini LGA due to high rate of HIV/AIDS morbidity and mortality cases. The last stage involved the selection of farm households with or without HIV/AIDS and related sicknesses with the assistance of agricultural extension workers, widows/widowers who had lost their spouses due to protracted sickness and/or had visible symptoms of HIV/AIDS and Farm families that were persistently spending money and/or disposing of family assets to get medical treatment for their members. In all, 155 farm households were interviewed made up of 55 with HIV/AIDS and related sicknesses while 100 were without HIV/AIDS. Data and analytical technique Primary data were collected on the health status of household members, the types of sicknesses commonly suffered from, and the number of sick days. Other data collected include farm sizes, types of crops grown and the quantities and prices of different farm outputs. The data was analyzed with the aid of descriptive statistics, budgetary analysis and the production frontier function. The budgetary analysis was employed to measure farm incomes. The gross margins are estimated for farm households with and without HIV/AIDS. The total revenue accruing to each farm is calculated from data on outputs and the prices of the outputs. The variable costs incurred in the production of these outputs are also estimated. From these, the gross margin is obtained as: GM = ∑PiYi - Ci (i = 1, 2,…., n) Where GM
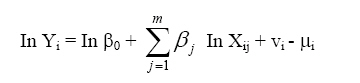
= Gross margin The mean gross margins for the two farm household groups are compared to determine the statistical significance of the difference between them. The stochastic frontier production function is applied in this study to determine the technical efficiencies of farms owned by households infected with HIV/AIDS and those not infected. The model was developed by Jondrow et al (1982) and has been previously applied in similar analyses by Seyoun et al (1998) and Adeoti (2001). Assuming a Cobb-Douglas production function, the stochastic frontier production function applied in this study is specified as follows:
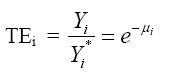
where Yi = Farm output for farm i (in grain equivalent) Xij = Vector of jth inputs used by the ith farm X1 = Farm size in hectares X2 = Family labour in standard days X3= Hired labour in standard days X4 = Other production costs (seeds, agro-chemicals) in Naira X5= Quantity of fertilizer used in kilograms. b = Vector of production function parameters to be estimated vi= Random variability in production that cannot be influenced by the farmer mi = Deviation from maximum potential output attributable to technical inefficiency. i = 1, 2, 3, ….. n farms. j =1, 2, 3,---m inputs. Direct estimates of the parameters are obtained using the maximum likelihood method. The major feature of the stochastic production frontier model is that the disturbance term is composed of two parts, a symmetric and a one-sided component. The symmetric component, vi , captures the random variability due to measurement error, statistical noise and other non-systemic influences outside the control of the farm. It is assumed to have a normal distribution. The one sided (non-positive) component mi captures the random variability which is under the control of the farmer. Its distribution is assumed to be half- normal or exponential. The two error components are assumed to be independent of each other. The technical efficiency index of each individual farm is equal to TEi = technical efficiency of farm i Yi = observed output per hectare of farm i Yi* = frontier output per hectare of farm i The technical efficiency of a farm is in the range of 0 to 1. Maximum efficiency in production has a value of 1.0 and lower values represent less than maximum efficiency in production. The analysis of variance (ANOVA ) test is conducted for the comparison of the means of the outputs and the technical efficiencies of the two groups of farms. RESULTS AND DISCUSSION Health Status and the Cropping Patterns Table 1 gives the details of the types of sickness of the respondents that had HIV/AIDS and related sicknesses. As shown in table 1, tuberculosis, protracted illnesses and HIV/AIDS caused 36%, 32% and 24% of morbidity among the respondents respectively. As the major causes of morbidity, these three types of sickness caused 92% of morbidity among the respondents. Similarly, malaria fever, HIV/AIDS and pneumonia were the three major causes of mortality, responsible for 23%, 20% and 20% of mortality among the respondents respectively. In all, protracted illnesses, HIV/AIDS and tuberculosis represent the major causes of morbidity and mortality among the respondents. The cropping patterns observed in the study area comprise both sole and mixed cropping patterns. However, mixed cropping is the predominant cropping pattern. Table 2 shows the various crop combinations planted by farmers in the study area. The table shows that sole maize and sole yam farms comprise of about 25.5 percent of all HIV farms, while 14.0 percent of non-HIV farms are solely cultivated to either the two crops. In both farm groups, other farm households cultivate two or more crops in mixtures. However, the cultivation of yam is included in all mixtures except one (maize/cowpea). This indicates the predominance of yam cultivation in the study area. In HIV farms, 56.4percent of them cultivate two crops in mixtures. The crop mixtures involve maize/cowpea(14.6percent), yam/cowpea (18.2percent), and yam/maize (23.6 percent). About 14.5 percent of HIV farm households cultivate three crops in mixtures while only 3.6 percent of them cultivate more than three crops in mixtures. Farms that cultivate two crops in mixtures have the highest percentage. In non-HIV farms, 17.0 percent cultivate two crops in mixtures, 22 percent cultivate three crops in mixtures while 47 percent cultivate more than three crops in mixtures. Farms that cultivate more than three crops in mixtures represent the largest percentage among non-HIV farms relative to HIV farms. Overall, the result shows that non diversification in HIV farms are fewer than in non-HIV farms. However, irrespective of farmer’s health status, yam cultivation is the most prevalent. Analysis of the Outputs and Incomes of Households The budgetary technique is used to assess the profitability of the farm enterprises. It is carried out on both per-farm and per-hectare basis for the HIV and non-HIV farms. It shows the cost and the returns on the per-hectare basis. The results are summarized in table 3. As
shown in the tables, the average gross revenue on HIV farms is Table 1: Number of Respondents Whose Relatives died or were sick due to HIV/AIDS and Related Sicknesses
Source: Field survey data, 2003 Table 2: Distribution of Respondents According to Types of Crops Cultivated
Source: Field survey data, 2003. Table 3: Cost and Returns per hectare of HIV and Non-HIV Farms
Source: Computed from field survey data. For
both gross revenue and gross margin per hectare, the average estimates are
lower for HIV farms than non-HIV farms. The average variable costs and average
fixed costs follow the same pattern. The amounts invested on the average are,
lower on HIV farms than on non-HIV farms. Consequently, the profit realized
from HIV farms are lower relative to non-HIV farms. The average farm profit for
an HIV farm is Production Frontier Analysis of Farms’ Technical Efficiencies. The maximum likelihood estimates of the parameters of the frontier models for the two groups of farms are presented in table 4. The table shows the estimates of the regression and the variance parameters. The variance parameters are represented by sigma squared σ2 s and gamma γ . The sigma squared indicates the goodness of fit and the correctness of the distributional form assumed for the composite error term. The gamma indicates the systemic influences that are unexplained by the production function, which are the sources of random errors. The significance of the estimates of the sigma squared indicates that the distributional forms of the error terms are well specified. The statistical significance of the gamma estimate implies that the inefficiency effects make significant contribution to the technical inefficiencies of farms. It justifies the inclusion of the mi error term in the function. In HIV farm, the sigma squared is estimated as 0.259 while the gamma estimate is 0.896. The estimates are statistically significant at 1 percent level. In non-HIV farm, the sigma squared estimate is 0.217 and the gamma estimate is 0.929. Both estimates are statistically significant at 1 percent level. The gamma estimate shows that the amount of variation in output which results from technical inefficiency of the sampled farms is high. The estimated parameters have varying signs for both farm household groups; with most of them being statistically significant at the 5 percent level. In HIV farms, the coefficients for farm size, hired labour and fertilizer are positively signed and are statistically significant at the percent level. The positive relationship signifies that an increase in any of these variables will lead to an increase in output levels. The coefficient of other cost is negative and statistically significant at 1 percent level. This shows that an increase in costs of other inputs will lead to a decrease in output level. The coefficients obtained for the estimated parameters gives the elasticities of the explanatory variables as is typical of the Cobb-Douglas production function. The magnitude of the coefficients is 0.146 for farm size, 0.844 for hired labour, 0.198 for fertilizer and 0.411 for other costs. The magnitude of the coefficients indicates the degree of elasticities of the variables with respect to the level of output. All the four variables are inelastic to output levels with farm size and fertilizer being highly inelastic. Table 4: Stochastic Frontier Production Function For HIV and Non-HIV Farms.
xxx significant at 1 percent xx significant at 5 percent x significant at 10 percent Source: Computed from Field Survey In non-HIV farms, the coefficients of farm size, family labour and fertilizer have positive relationship with the level of output; and are statistically significant at the 5 percent level. The coefficient of other costs is negatively signed but statistically significant at 1 percent level. The magnitude of the coefficients is 0.431 for farm size, 1.050 for family labour, 0.278 for fertilizer and 0.215 for other costs. This implies that family labour is elastic with respect to output level while farm size, fertilizer and other costs are inelastic. These results show that family labour is not statistically significant in HIV farm but significant in non-HIV farm. However, hired labour is statistically significant in HIV farm, but not significant in non-HIV farm. In all, it shows that in HIV farm hired labour is statistically significant while in non-HIV farm family labour is statistically significant. The inefficiency model reveals the sources of inefficiencies among individual farms.The signs on the inefficiency model are interpreted in an opposite way. Negative sign implies that an increase in the variable will lead to a decrease in inefficiency. For the HIV farms, the estimated parameters for age and years of schooling are negative and statistically significant at the 1 percent level. This shows that increase in these variables will reduce the farm’s inefficiency. The coefficient for the years of farming is positive and is not statistically significant. In non-HIV farm, years of schooling and years of farming are negatively signed and are statistically significant. Increase in years of schooling or farming will decrease farm’s inefficiency. The coefficient for the age of respondents is not statistically significant. This result shows that the years of farming are not significant in reducing farm’s inefficiency if the farm household is infected with HIV. This may be due to loss of skilled labour either as a result of morbidity and/or mortality. In non-HIV farm, years of farming will reduce the level of farm’s technical inefficiency; as the skill and experience acquired over years will be available for the household’s farming activities. As stated earlier, the specification of the stochastic frontier production function has an error term with two components. One is to account for random effects due to non-systemic influences on production and the other to account for technical inefficiency in production. An important characteristic of this model is its ability to estimate individual, farm-specific technical efficiencies. Alongside the estimates of the parameters in the function, the farm -specific technical efficiency indices are given. The frequency distribution for the two farm groups are presented in Figure1. The result shows a wide variation in the technical efficiencies of farms in the two groups. For the HIV farms, the mean technical efficiency is 0.52. This shows that, with maximum efficiency in resource allocation, farm output can be increased by 48 percent on an average farm. About 47.28percent of the farms have indices above 0.50. The variation in the levels of individual farms’ indices shows that the potential for increasing farm output varies across farms. The gap between the most efficient (0.91) and the least efficient (0.12) shows a high inter-farm variation in technical efficiency. For the non-HIV farm, the mean technical efficiency is 0.70. About 74 percent have technical efficiencies over 0.50 but also with a wide inter-farm variation. The least efficient is 0.18 while the most efficient is 0.97. None of the farms has a perfect efficiency rating of 1.00, but non-HIV farms generally have higher performance indices than HIV farms. Analysis of variance (ANOVA) was conducted to test the difference in mean between the two farm groups in respect of the outputs and technical efficiencies. The results of the ANOVA show that there is a statistically significant difference at the 5 percent level of significance in the outputs of HIV and non-HIV farms. That is, the average output from the farms on non-HIV households is significantly higher than that of HIV households. There is also a statistically significant difference at the 10 percent level of significance between the technical efficiencies of HIV and non-HIV farms. That is, the technical efficiencies in farms owned by non-HIV households are, on the average, significantly higher than those of HIV households. Conclusion: In this work, we have shown that Non- HIV farm households cultivate a wider variety of crops in mixtures and they make more income than HIV farms.On both group of farms,output levels are affected by farm size and the quantity of fertilizer used.Family labor affects output levels on non-HIV farms while hired labor affects output level on HIV farms.Years of farming does not decrease technical ineffienciency in HIV farms but years of schooling reduces technical inefficiency in both farm groups.In all,non-HIV farms are more technically efficient than HIV farms and increased years of schooling will increase technical efficiency in both groups of farms. REFERENCES
Copyright 2008 - Ibadan Biomedical Communications Group The following images related to this document are available:Photo images[md08020f1.jpg] | |||||||||||||||||||||||||||||||||||||||||||||||||||||||||||||||||||||||||||||||||||||||||||||||||||||||||||||||||||||||||||||||||||||||||||||||||||||||||||||||||||||||||||||||||||||||||||||||||||
| |||||||||
