 |
| About Bioline | All Journals | Testimonials | Membership | News |
|
||||||
|
||||||
African Journal of Biomedical Research, Vol. 11, No. 3, May, 2008, pp. 251-258 Full Length Research Article Quality of Packaged Waters Sold in Ibadan, Nigeria Ajayi A.A., Sridhar M. K. C., Adekunle Lola V. and Oluwande, P. A. Department
of Epidemiology, Medical Statistics and Environmental Health, Faculty
of Public Health, College of Medicine, University
of Ibadan, Ibadan, Nigeria Received: January
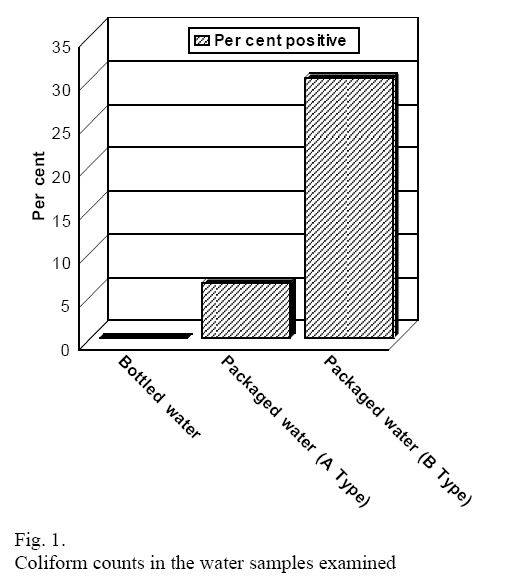
2008 Code Number: md08035 ABSTRACT The inadequacy of pipe borne water supplies in urban centres is a growing problem. As a result, communities resort to buying water from vendors. In recent years, sachet or bottled water became major sources of drinking water in the households and at work. This study aimed at assessing the chemical and bacteriological quality of packaged water sold in Ibadan, the capital of Oyo State with a population over 3.2 million. A total number of 118 samples of water from several commercial brands sold in the city of Ibadan were selected by simple random sampling. These were of three categories, those that are packed and sealed in bottles by larger factories (bottled water), those sealed in nylon sachets by small scale industries (A Type), and those put in nylon sachets and manually tied by itinerary vendors (B Type). These samples were subjected to physical, chemical and bacteriological analysis. Hanna C 100 spectrophotometer and analytical quality chemical reagents were used for chemical analyses. MacConkey broth (MB) and Brilliant Green Bile Broth (BGBB) were used for bacteriological analysis using multiple tube method as described in APHA Standard Methods. The results showed that while the physical parameters were within WHO limits for drinking water quality guidelines values, 30 % of the samples showed rather poor quality. The pH values ranged between 6.6 - 9.7 and aluminum ranged from 0.00 - 0.34 mg/1, fluoride from 0.01 - 1.87mg/l and cyanide from 0.0 - 0.175 which were not within permissible limits. Bacteriological analysis showed that 5% of the 78 samples (A Type), and 28% of the 30 samples (B Type) tested showed positive coliform counts . The dominant bacteria were Klebsiella sp., Streptococcus faecalis and Pseudomonas aeruginosa. Thus the bottled waters were satisfactory, but the sachet waters were found not satisfactory. Based n the results, it is recommended that the enforcement agencies in the country (NAFDAC and the Ministry of Health) need to get the producers of 'packaged water' to comply with the national drinking water guidelines. Communities on their part should be educated and enlightened on the ill effects of patronizing fake vendors. Key Words; water quality, Coliform counts, faecal coliforms, pure-water, water vending, urban water, bottled water. INTRODUCTION Safe and potable water supplies in urban centres in Nigeria are still inadequate in spite of over four decades of independence and several efforts from various governments. In Ibadan, Oyo State, despite the intervention of the World Bank, African Development Bank and UNICEF, a gap still exists in the provision of safe drinking water. Hence, the inhabitants mostly women and children have resorted to sourcing drinking water from dug wells, unprotected and protected springs, brooks and harvested rainwater throughout the seasons. (Sridhar et al 1982, Sridhar 1999). Ibadan, the thickly populated capital of Oyo State with an estimated population of over three million started experiencing acute shortages of potable water supply since 1980s. Presently, Water Corporation of Oyo State supply the city with 107 million litres/day representing about 20 per cent of the total water demand of the city. However, the current estimated demand is 484 MLD. As a result water supply is rationed thus leaving most taps dry. The worst hit areas are the core and inner areas like Mapo, Alekuso, Oke Are, Agbede Adodo, Bere, Isale Osi, Sapati hills and others (Personal communication from Sustainable Ibadan Project, Ibadan, 2007). Ground water and spring waters are able to serve only a small proportion of the communities (Sidhar 2000). Most often, the wells are shallow and located near sources of pollution and the quality is rather poor (Osibanjo, 1999). In the dry season they dry up for almost three months. The springs are just used traditionally without any protection and they usually receive surface drainages (Itama et al,, 2006). Rain water is seasonal and there are no organized storage facilities (Sridhar et al 2001). Ponds and streams are easy and accessible sources but guineaworm, schistosomiasis and other water-borne infections are endemic (Sridhar 1999, Oloruntoba et al, 2006; Oloruntoba and Sridhar, 2007). The result has been increase in patronizing water vendors who collect, pack and supply different brands of water of doubtful quality. Packaged waters in the market The water vending is a flourishing business in Ibadan and many people are lured into this business for getting easy returns. The major supply which has become popular among the medium and low income groups are the cheap nylon sachets either registered with the regulatory body or with no registration. There were about 127 brands of packaged water available in the city at the time of this study and the number is increasing every day. They are broadly classified according to the packages and price tag as follows: (i) Bottled water is usually manufactured and marketed by standard companies, both local and multinational. These waters are either drawn from natural springs, or deep boreholes and treated according to the specifications by passing through various filters and disinfected appropriately. They are available in 50cl, 100 cl, and 150 cl bottles. These are relatively expensive (at the rate of Naira 60 to 100) and very popular among hotels and restaurants and people from higher socio-economic strata. The source is well protected. An in-house quality control laboratory usually checks the water quality. (ii) Packaged water (A Type), popularly called “pure water” which is manufactured by small scale industries (either in a shed or garage) with a registered name and supposed to have been prepared under Government stipulated hygienic quality regulations. According to the specifications, the water is passed through a series of activated charcoal or suitable filtering media and Millipore or equivalent filters of a specific pore size, and disinfected under ultraviolet radiation for a specific period. They are packed in 25cl or 30cl nylon / plastic film sachets and sealed by heat at production site. They are put in larger sacks in dozens and transported to various distribution points in open pick-up vehicles. Some times the sealing is poor and quality control is rather questionable. The source in many cases is not well protected and human errors in the manufacturing process are possible. The price is affordable (Naira 5) mostly for the middle income groups. They are popular at social gatherings and public places. (iii) Packaged water (B Type), popularly called “iced water” which is prepared by individuals who pour any available water into the nylon/plastic film sachets, tie manually, kept under ice and sold. The premises are not registered, unsanitary and the common sources of water are shallow wells, unprotected springs, boreholes, streams and ponds with no treatment. A young girl or a boy packs the water into the sachets by pouring through a funnel topped with a piece of cloth, nylon wrap or rags to strain off any particles. This study has focused on the chemical and bacteriological quality of popular brands of packaged water sold in Ibadan Metropolis and assessed their suitability for human consumption to alleviate any public health concerns. MATERIALS AND METHODS Study area The study area is the municipal area of Ibadan, which is made up of five local government areas. Ibadan city lies on the longitude 3°5' East of Greenwich meridian and latitude 7°23' North of the Equator. Besides being the largest indigenous city in Africa south of Sahara, the city is an important trade and educational centre. It also houses one of the largest and foremost teaching hospitals in Africa. However, the city is characterized by low level of environmental sanitation, poor housing, and lack of potable water and improper management of wastes especially in the indigenous core areas characterized by high density and low income populations. Sampling of waters From the 127 brands of water sold in the city at the time of study, 118 samples were selected by simple random sampling method from various vendors. The distribution of samples was as follows: bottled waters 10 samples from 3 brands, packaged ‘A Type’ 78 samples available in the markets, and packaged ‘B Type’ 30 samples available in the market. It was assumed that the bottled water quality is satisfactory as the quality control is very high in the large scale industries. Therefore bottled water samples from the 3 brands were collected from different sellers. These were purchased directly from water vendors in the markets, food serving areas (Bukhas) and motor parks in the five Local Government Areas of the metropolis (Ibadan North, Ibadan North West, Ibadan North East, Ibadan South West and Ibadan South East). The samples were stored in a cool box and carried to the laboratory. The number collected on a day were immediately processed for physico-chemical and bacteriological analysis as described in Standard Methods (APHA 1998). For bacteriological analysis, the bottles and sachets were opened under aseptic conditions. Methodology The physical parameters included pH, temperature, total dissolved solids (TDS), oxidation reduction potential (ORP) and electrical conductivity (EC). Chemical parameters included cation and anion constituents: aluminum, calcium, chromium VI, iron, magnesium, zinc, chloride, cyanide, fluoride, nitrite, nitrate, total alkalinity, total hardness and total and free chlorine. Hanna C-100 spectrophotometer (made in UK) and chemical reagents supplied along with the kit were used for analyses. Total hardness was determined using EDTA titration method using Eriochrome Blak T indicator. Chloride was determined using the silver nitrate titration method using potassium chromate indicator. Total alkalinity was measured titrimetrically using mixed indicator. For bacteriological analysis (Total and faecal coliforms), multiple tube method was used. The culture media used were MacConkey Broth (MB) and Brilliant Green Bile Broth (BGBB). After inoculation of the media with the samples, the BGBB culture tubes were incubated at 37°C for 2 hours before transferring them to 44°C incubator for 18 hours. The MB cultures were incubated at 37°C for 18 hours. After the incubation period, the cultures were inspected for changes in colour and gas production. Those showing growth with or without gas production were noted. Those showing no changes in colour were re-incubated for additional 24 hours. The tubes showing changes in colour were counted and the MPN count was expressed per 100 ml of sample as per the MacGrady's Probability Table. The cultures that showed growth were also sub-cultured on MacConkey agar plates to obtain discreet colonies to facilitate easy isolation and identification of the predominant organisms. Quality control and Quality Assurance were ascertained appropriately. Standard Methods for water analysis as described by the American Public Health Association (Mara and Oragui 1985, APHA 1998) were employed. The coliform count is expressed as cfu/ 100 ml. RESULTS AND DISCUSSION Bottled water. The physico-chemical characteristics of the bottled waters are given in Table 1. The results indicate that the values for pH ranged between 6.3 to 7.8, and total dissolved solids between 78.0 to 180.0 mg/l which also reflected in the electrical conductivity and oxidation-reduction potential. Zinc, aluminum and chromium were present at low levels. But iron levels were relatively higher. Similarly the anionic constituents such as nitrate, chloride, free chlorine were present in low concentrations. Cyanide and fluoride were also recorded at very low levels. While the fluoride is useful for stronger teeth, the levels are much lower compared to the WHO standard. Of the three brands collected from the market, only one was registered with the National Agency for Foods and Drugs Administration and Control (NAFDAC). Registration has no guarantee for the good quality. Only one brand had indicated the concentrations of the chemical constituents. However, some of the constituents did not tally with the actual values (Table 2). None of the water samples tested showed coliform counts indicating adequacy of treatment for microbiological safety for drinking purposes (Fig. 1). This is expected because these companies have to keep up their name in view of their large scale production and investment that went into this venture. Table 1. Physico-chemical characteristics of bottled water (n=10 from 3 brands)
Table 2.:Variations in constituents as observed on the label on the bottles and those observed
Packaged water - A Type Packaged water samples had pH values ranged from 6.6 - 9.7, with a mean value 8.2 ±0.23. The TDS ranged 39.0 - 362.0 mg/1 (mean 1981±21.30), while ORP ranged from 80-178 mV (mean 113.4± 44.1) and electrical conductivity ranged from 0.11 - 0.49 mS/cm (mean O.29 ± 0.02). Among the chemical characteristics, aluminum levels ranged from 0.00 - 0.34 mg/1 (mean 0.06 ± 0.04), calcium hardness ranged from 10 - 107mg/l (mean 57.55 ± 7.14) and magnesium hardness ranged from 12.0 - 36.0mg/l (mean 18.25 ± 2.68). Chromium VI concentration ranged from 0.00 - 42 mg/1 (mean 25.4 ± 1.19), while the iron content had a concentration ranged from 0.00 - 0.26mg/l (mean 0.11 ± 0.03) and the zinc concentration ranged from 0.00 - 1.19mg/l (mean 0.43 ±0.35). Presence of chromium even in permissible concentrations should be watched carefully as it is a potentially carcinogen (WHO, 1995). The nitrate levels ranged from 0.01 - 6.61 mg/1 (mean 2.25 ± 0.09), while nitrite concentration ranged from 0.0 - l.0 mg/1 (mean 0.51 ± 0.06). Fluoride levels ranged from 0.01 -1.87 mg/l (mean 0.94 ± 0.01), chloride concentration ranged from 7.0–33.0 mg/l (mean 19.20 ± 4.35), while the cyanide concentration ranged from 0.000 - 0.175 mg/l (mean 0.087 ± 0.00). Total chlorine level was found to range from 0.02 - 0.l0mg/1 (mean 0.07 ± 0.03). Free chlorine concentration ranged from 0.00 - 0.l0mg/1 (mean 0.04 ± 0.025), while total alkalinity ranged from 14.0 - 260.0 mg/l (mean 108.00 ± 64.24) and total hardness level ranged from 16.0-124.0 mg/l (mean 70.0 ± 13.41). The bacteriological analysis showed that five per cent of the 78 samples showed coliform growths. The MPN of coliform counts ranged from 3 to 11 cfu /100 ml of sample. The specific organisms isolated from the positive samples included Escherichia coli, Klebsiella sp. Pseudomonas aeruginosa and Streptococcus faecalis (Fig. 1 and Table 2). Packaged water - B Type The physico-chemical parameters (Table 4) indicated the following. The pH values ranged from 5.6 to 8.0 (mean 6.8); the ORP ranged from 105.0 – 206 mV (mean 155.5±7.21); and electrical conductivity ranged from 0.10 – 0.6 mS/cm (mean 0.39±0.01mS/cm). The cation constituents were within permissible limits. Chromium VI was in the range of 0.0 – 28.0 µg/l (mean 14.0±0.5) which has to be monitored carefully. The nitrate levels showed a maximum of 40 mg/l with a mean value of 19 mg/l which is to be carefully monitored as it is indicative of pollution from poor sanitation around the water sources and human wastes may be responsible to a large extent. This is also reflected in the higher levels of chloride. In general, these brands of packaged waters showed higher mineral content. Of the 30 samples examined, 9 (30 per cent) have shown positive coliform growths with the MPN ranging from 5 to as high as >180 per 100 ml. These samples also showed the same species of Coliform group as observed under the A Type brands (Fig 1, Table 2). The relatively higher contamination of these waters is suggestive that they are not subject to any treatment or least treatment and packed in an unsanitary environment. Table 3.: Physico-chemical characteristics of packaged water (A Type, n=78)
Table 4. Physico-chemical characteristics of packaged water (Type B, n=30)
Table 5. Types of coliform organisms isolated from each of the packaged water types (% of the samples examined)
This was also confirmed from the field visits where the surroundings were found filthy and the packaging is done by illiterate or ignorant people, often young children with no visible hygienic equipment. In the past several years, globally, there has been a wave of sudden awareness among people to switch over from any available water to packaged water for drinking purposes. This is not only in Nigeria but there are several reports from other countries. In Saudi Arabia very low plate counts (0-1 / ml) were obtained in bottled waters of 0.5l to 1.5 l capacity as compared to large sized bottles where the numbers shot up to 3 – 276 / ml (Al Abdula-Aly and Khan 1995, 1999). In yet another study (Abdel-Majid 1997) in Al-Gassin region of Saudi Arabia, total coliforms (>180/100 ml) were ‘too numerous to count. In Los Angeles water vending machines showed 163 times higher bacterial counts as compared to tap water (Dan Rutz, 1996). The predominant organism was Pseudomonas aeruginosa (Bottled Water News 2000). Chaidez et al (1999) and Warburton et al (1986) in Canada observed standard plate counts of over 100 cfu / ml in 43 to 60 waters examined. No coliforms were however found among the 114 samples tested. Similarly, Aramas and Sutherland (1999) observed higher plate count (104 cfu/ml) and Pseudomonas sp. in waters from parts of Britain, mostly from the containers and water lines contributed to the count. The Federal Ministry of Health and various State Ministries of Health in Nigeria are reporting increased number of cases of gastroenteritis, diarrhea, typhoid and cholera which are indicative of poor drinking water quality. In
Nigeria in the past, a householder gets water from alternate sources for the
family needs. With the growing employment or occupation between the husband and
wife, there is a need for looking for drinking water which is easily
accessible. The bottled waters are unaffordable to many middle and low income
populations. The packaged waters come handy with their low price tag. In
Nigeria, the price difference among these brands is very high. The bottled
water is sold for Conclusions The results presented here bring out the fact that communities in urban areas suffer from acute drinking water shortage. To augment this situation many entrepreneurs took to packaged water business – production and vending. There is rush to get into business and as a result quality control has been under played. Therefore, waters other than those in company sealed bottles are a source of waterborne infections. Even though Nigeria has national guidelines and regulations, and the regulatory agencies, the monitoring of the packaged water quality is poor. There is therefore, a need to monitor all those involved in water business to comply with the guidelines. The national regulatory bodies and Ministries should exercise more stringent surveillance programmes and educate the producers and the consumers on the need to look for water quality, proper labeling and certification. To achieve this goal the manufacturers, the consumers and government should come together. REFERENCES
Copyright 2008 - Ibadan Biomedical Communications Group The following images related to this document are available:Photo images[md08035f1.jpg] |
| |||||||||