 |
| About Bioline | All Journals | Testimonials | Membership | News |
|
||||||
|
||||||
Middle East Fertility Society, Vol. 10, No. 1, 2005, pp. 63-67 Three dimensional endometrial volume versus endometrial thickness measurement in prediction of IVF/ICSI outcome* Mona M. Aboulghar, M.D.†‡§, Hesham G. Al-Inany, M.D. †‡, Mohamed A. Aboulghar, M.D. †‡, Gamal I. Serour, M.D. ‡ ,Ragaa T. Mansour, M.D., Ph.D. ‡, Yehia M. Amin, M.D. ‡, Ahmed M. Abou-Setta, M.D. ‡ The Egyptian IVF-ET Center, Maadi, Cairo, and Department of obstetrics & Gynecology,
Cairo University, Cairo, Egypt Received on November 07, 2004; Code Number: mf05012 ABSTRACTObjective: To investigate the role of estimating endometrial volume
and it's correlation with endometrial thickness, on the day of hCG, in prediction
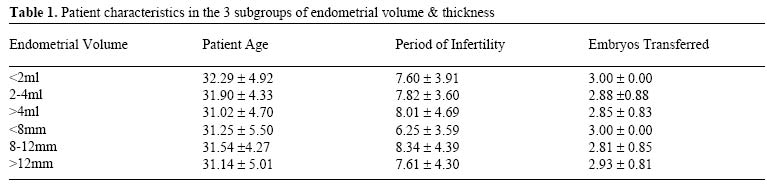
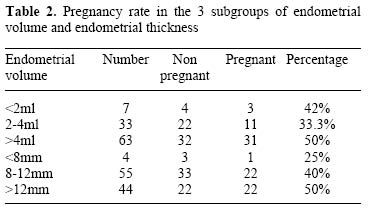
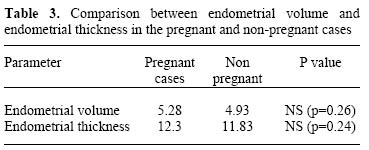
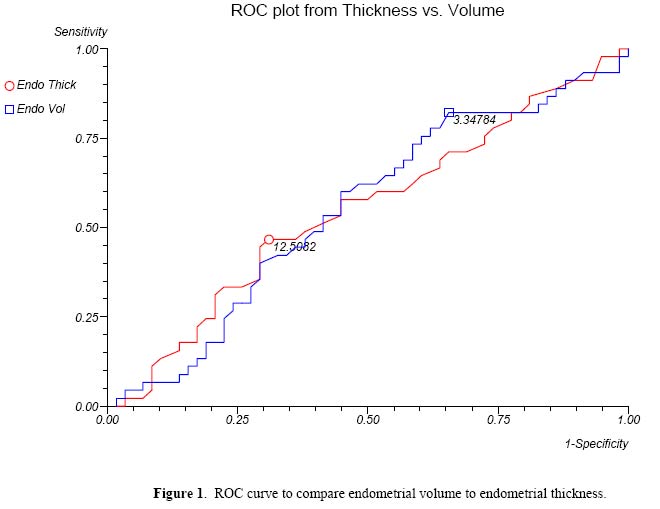
of IVF outcome. Key words: Endometrial volume, endometrial thickness, pregnancy rate, IVF Conception in In Vitro Fertilization (IVF) programs requires good quality embryos as well as a receptive endometrium (1). Despite the marked advances in assisted reproductive techniques, the implantation rate per embryo has remained very low at 20 % (2). While the assessmentof embryo quality and proper grading is done in the lab before transfer, the assessment of endometrial receptivity is more difficult.Transvaginal ultrasonography is an ideal non-invasive method, but lacks specificity (1,3). The use of 3 D ultrasonography to examine the uterine cavity in detail and reconstruct the images of the uterus surpasses the diagnostic potential of Two Dimensional (2D) ultrasound (4,5). Several studies have confirmed a high degree of reproducibility and accuracy of endometrial volume estimation using 3D ultrasound (6,7). The aim of this study was to compare endometrial volume measured by 3D ultrasound, on the day of human chorionic gonadotrophin (hCG), to endometrial thickness, in relation to outcome of IVF. MATERIALS AND METHODSThis is a prospective single center study, including one hundred and three patients scheduled for an IVF/ICSI cycle, in the period from August 2003 to March 2004. All patients were aged below 40 and all IVF/ICSI cycles were done using ejaculate sperms. Any patient with uterine abnormality was excluded (e.g. fibroid, mullerian anomaly). Patients with a previous poor response , those with difficult embryo transfer or with a known systemic disease were excluded from the study. No patients with more than 3 failed IVF trials were included. The ovulation induction protocol used was our standard long luteal phase agonist protocol. Participants received the Gonadotrophin releasing hormone agonist (GnRHa) long protocol, Decapeptyl 0.1 mg/day starting on day 20 of the cycle till the day of hCG injection. After down regulation was confirmed,150- 300 IU of human menopausal gonadotrophin (hMG) per day was started for 7 days, then the dose was adjusted according to the response. Ten thousand units of hCG (Pregnyl; Nile CO., Cairo Egypt) were given I.M. when two or more follicles reached 18mm in mean diameter. Ovum retrieval using transvaginal ultasound was scheduled 36 h after hCG injection. (8). Embryo transfer was done on day 2 or 3 after OPU using the Wallace catheter (H.G.Wallace Ltd, West Sussex, UK). Luteal phase support was given routinely in the form of a daily progesterone injection (100 mg, progesterone; Steris, Phoenix, AZ, USA). A serum B-hCG test was done to confirm pregnancy two weeks after embryo transfer. Clinical pregnancy was diagnosed 3 weeks after a positive test by the presence of a gestational sac with fetal echoes and pulsations on ultrasound Endometrial Assessment On the day of hCG, the patients were examined using the TV 3D probe (VD5-8B, Kretz, Zipf, Austria on a Sonoace 9900 medison Korea). After obtaining a proper longitudinal view of the uterus, the endometrial thickness was measured at the maximum thickness between the highly reflective interfaces of the endometrial-myometrial junction. Three-dimensional volumetry was performed by defining the region of interest, using the movable sector on the screen to include the whole endometrium. The probe was kept completely still as well as the patient asked to refrain from any movement. Volume scan took about 3 seconds using a wide angle 80o. The three orthogonal planes were simultaneously displayed on the screen. The data set was stored on an internal disk drive for later analysis. All examinations were done by the first author. A simple random sample was used to select 10 patients from the 103 patients included in the study. For each patient, the endometrial volume was measured 10 times. The intraclass correlation coefficient calculated was 0.971 with a 95th confidence interval of 0.937 and 0.992. This implies a very good reliability in the measurement. For the purpose of volume calculation, the 3-D data was retrieved & the using the "VOCAL" specification of the machine, the endometrial volume was calculated in Plane A by delineating the endometrial margin at the myometrial endometrial interface from the fundus to the internal os in a number of parallel slices at 30° apart (6 slices). Statistical evaluation Data are presented as mean ± SD. Different outcome measures were compared using Student's t-test or chi-square test where appropriate .P values < 0.05 were considered to be significant. Receiver operating characteristic (ROC) curve was done to estimate the best cutoff value for endometrial volume and thickness if any. Analysis was done using Arcus Quickstat version I. RESULTS The mean age was 31.4±4.5 (range 20-40), The mean duration of infertility was 7.6± 4.2 years. The mean number of embryos transferred was 2.9±0.8. The overall fertilization rate was 63.5%, Implantation rate 22.7%, clinical pregnancy rate; 43.6%. The Etiology of infertility of the patients, included; male factor (45%), tubal (16%), and unexplained infertility (12%), ovulatory factor (10%), mixed causes (10%). The overall clinical pregnancy rate achieved was 43.65 %. Patients were divided into three subgroups according to endometrial volume calculated; <2ml, 2-4ml, >4ml and according to endometrial thickness into three subgroups; <8mm, 8-12mm, >12mm. The mean age, period of infertility and number of embryos transferred in all subgroups is shown in table 1 and there was no significant difference in these parameters Table 2 shows the number of pregnancies and pregnancy rates in each subgroup and differences were found to be non significant. Table 3 shows a non-significant difference in the mean endometrial volume and mean endometrial thickness in the pregnant as compared to the non-pregnant group. On subgroup analysis, including only cycles with embryos grade I (42 women), the ROC curve was used to compare endometrial volume to endometrial thickness, and the area under the curve (AUC) was 61.2% for endometrial volume and 56.3% for endometrial thickness (Figure 1). The figure shows the limited reliability of both parameters in prediction of pregnancy although endometrial volume was superior but did not reach statistical significance. DISCUSSIONIt is well agreed that embryo quality and endometrial receptivity determine success of assisted reproduction and result in successful embryo implantation (9). In the past few years, there has been a growing interest in assessment of endometrial receptivity by means of ultrasound scanning technology. Many investigators tried to evaluate endometrial receptivity through sonographic parameters, such as endometrial thickness, but was found to lack specificity (10). Using two dimensional transvaginal ultrasound to measure endometrial thickness does not include the total volume of the endometrium (1). Other investigators described a mean absolute error rate of 12.6% for two dimensional volume measurements, while the absolute error rate for 3D volume measurement was only 6.4% (11). In addition the advantage of reproducibility of 3D volume assessment of endometrium has been confirmed by several authors (6,7). These studies investigated endometrial volume on the day of downregulation, on the day of egg collection and embryo transfer. Therefore, it is sound to have some insight about the day of hCG administration In our study there was no significant difference in endometrial volume nor endometrial thickness in patients who became pregnant as compared to those who did not become pregnant, this correlates with previous studies that found no predictive value of endometrial volume and endometrial thickness on IVF results (12,13). When subdividing the patients into three groups according to endometrial volume; <2ml, 2-4ml, >4 ml as well as according to endometrial thickness <8mm, 8-12mm, >12mm, no significant difference in pregnancy rates was found which doesn't agree with other authors who subdivided the patients similarly (14). However in their study the number of good quality embryos was comparable between all groups. In our study when analyzing endometrial volume & endometrial thickness measurements of patients with grade I embryos, endometrial volume was found to be superior to endometrial thickness in predicting pregnancy however did not reach statistical significance. From the ROC curve the sensitivity and specificity of the endometrial volume measurement was found to be; 34.5% and 82.2% respectively and the sensitivity and specificity of the endometrial thickness measurement was 46.7% and 68.8% respectively. Hence its validity for canceling ET or cryopreserving embryos is questionable. Other investigators found endometrial volume and thickness significantly higher in patients who became pregnant as compared to those who did not become pregnant. However in agreement with our results found no significant reduction in pregnancy rates with endometrial volume < 2ml when compared to > 2ml. (15) In conclusion, 3D endometrial volume measurement is an easy, applicable and reproducible method of assessing endometrium in IVF programs. However endometrial volume is not a better predictor of IVF outcome when compared to endometrial thickness measured on day of hCG. REFERENCES
Copyright © Middle East Fertility Society The following images related to this document are available:Photo images[mf05012t1.jpg] [mf05012t3.jpg] [mf05012t2.jpg] [mf05012f1.jpg] |
| |||||||||
