 |
| About Bioline | All Journals | Testimonials | Membership | News |
|
||||||
|
||||||
Middle East Fertility Society, Vol. 10, No. 1, 2005, pp. 78-81 EVIDENCE-BASED MEDICINE CORNER Why should researchers report the confidence interval in modern research? Abdelhamid Attia, M.D. Professor of Obstetrics & Gynecology and secretary general of the
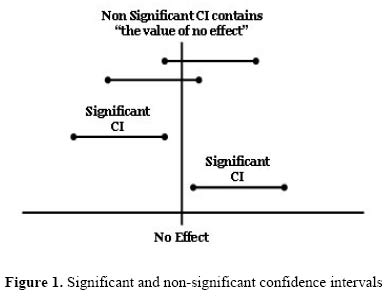
center of evidence-Based Medicine, Cairo University Code Number: mf05015 Medical research aims, mainly, at estimating the effect of an intervention or exposure in a certain population. For decades researchers relied on the p-value to report whether this effect is true (significant) or just has happened by chance (insignificant). In the last decade, many international journals do not accept manuscripts for publication if testing for significance was based only on the p-value. Calculating a confidence interval (CI) for every variable measured became a mandatory pre-requisite in modern research. But why should researchers measure the confidence interval and what benefit do we get from the confidence interval over the p-value? For every intervention or exposure studied an important question arises; what is the exact effect (true effect) of the intervention or exposure in the population? If a precise answer to this question is to be sought, researchers have to study the whole population. Something that is almost always both impossible and inappropriate. To work around this; researchers draw a sample from the population and study the effect of the intervention or exposure on this sample versus another control sample then calculate an estimate of the likely effect of the intervention or exposure in the population. Hypothesis testing and the p-value Starting the research, a research question is formulated using the null hypothesis that always assumes that any effect observed in the intervention (or exposed) group versus the control group is merely a product of chance. This, in research terms, is described as "there is no difference in the outcome between the intervention (or exposed) group and the control group". To reject or accept the null hypothesis testing for significance is required. The aim of tests of significance is to calculate the "probability" that an observed outcome has merely happened by chance. This probability is known as the "p-value". In medical research, statisticians and researchers agreed that if the p-value [or in other words the probability of an effect to happen by chance] is more than 5% (p > 0.05), researchers have to accept the null hypothesis and if it is less than 5% (p < 0.05) researchers can reject the null hypothesis. Accepting the null hypothesis means that the outcome studied in the intervention (or exposed) group did not differ from that in the control group (insignificant difference) while rejecting the null hypothesis means that the intervention (or exposure) has a true effect, either beneficial or harmful, compared with that in the control group (significant difference). So, if we are only interested in assessing whether the apparent effect of an intervention or exposure is likely to be real or could just be a chance finding; estimating the p-value is our target. But as much as the p-value helped in clinical practice for decades, we can not get much data out of it! Recently; a different and more useful approach for the assessment of the role of chance has become more popular in scientific research; the confidence interval (1). The 95% confidence intervalA confidence interval, calculated from a given set of sample data, gives an estimated range of values which is likely to include an unknown population parameter. The CI is expressed as 2 numbers, known as the confidence limits with a range in between. This range, with a certain level of confidence, carries the true but unknown value of the measured variable in the population. In medical research the confidence level is usually set to 95%; hence then name "95% confidence interval". Thus, the 95% CI is defined as "a range of values for a variable of interest constructed so that this range has a 95% probability of including the true value of the variable (2). It can be also expressed as "you can be 95% certain that the truth is somewhere inside a 95% confidence interval"(3). Example: Brinton and colleagues (2004) studied a group of infertile patients who underwent evaluation for infertility and reported a significantly higher rate of ovarian cancer among them than that in the general female population (standardized incidence ratio = 1.98; 95% CI, 1.4-2.6) (4). This mean that, based on data obtained from the sample, infertile females have an ovarian cancer incidence that is 1.98 times higher than non-infertile females and that we are 95% confident that the true incidence ratio in all infertile female population lies somewhere between 1.4 and 2.6. Putting in mind that we are only 95% confident it is apparent that there is a 5% probability that we are wrong i.e. 5% probability that the true incidence ratio might lie either below or above the two confidence limits (1.4 & 2.6). Although having the same level of certainty in ruling out chance as the p-value (5%), the confidence limits here gave us extra information than the p-value. This information is the lowest and largest effects that are likely to occur for the studied variable. The confidence interval as a test for significanceAnother important feature of the confidence interval is that it can be used, as the hypothesis testing and the p-value, for the assessment of statistical significance of any estimate. If the range of the CI contains the "value of no effect" this mean that the observed effect is statistically not significant. If the range of the CI does not contain the "value of no effect" this mean that the observed effect is statistically significant (Figure 1). But what is the value of no effect? First; absolute measures e.g. absolute risk, absolute risk reduction, and the number needed to treat. If a specific intervention leads to zero risk reduction (i.e. risk in control group minus risk in intervention group = 0), this mean that it has no effect compared with the control. Thus in situations dealing with absolute measures the value of no effect is zero. So if the confidence interval measured for the absolute risk reduction of an exposure ranges between -2 and +3 (notice that zero is contained within the range -2, -1, 0, 1, 2, 3) this means that this risk reduction is not statistically significant. Second; ratios e.g. relative risk and odds ratio. If the ratio = 1 this means that the incidence of outcome in the intervention (or exposed) group is equal to that in the control group i.e. there is no difference in the outcome between the intervention (or exposed) group and the control group. In other words the intervention or exposure is neither beneficial nor harmful compared with the control. Thus in measures dealing with ratios, 1 is the value of no effect. So if we have a confidence interval for a relative risk that ranges between 0.7 and 1.1 (notice that 1 is contained within the range 0.7, 0.8, 0.9, 1, 1.1) this means that this relative risk is not statistically significantly. Example: Osuna and colleagues (2004) conducted a systematic review of clinical trials to study the efficacy of performing two inseminations per cycle in IUI with husband's sperm compared with one insemination per cycle (5). They reported a somewhat higher pregnancy rate in the two-inseminations-per-cycle group (14.9% vs. 11.4%). The relative benefit of two inseminations compared with one per cycle was 1.34 (14.9 divided by 11.4). However, the 95% CI for the benefit was 0.90-1.99. Since 1 (the value of no effect for ratios) lies between the confidence limits (0.90 and 1.99) this mean that such benefit is not statistically significant. The width of the confidence intervalIf we are to work on a whole population, we would get a single number for any estimate we are to study. For example the mean age in a population, the risk of developing certain outcome, pregnancy rate in a population, etc. But since we only study a sample we get an approximate estimate to the variable studied and a range within which the true value in the population lies (CI). As a general rule the narrower is the CI the better it is. Suppose that we want to study the average age of menopause in Egyptian females. If we studied the whole population, we are going to get the exact average age; let it be 50 years. Now 2 researchers conducted 2 studies on 2 different samples of the population. The first study reported the average age of menopause to be 49.5 (95% CI, 41-59) years while the second study reported the average age to be 50.5 (95% CI, 48-53) years. So based on the two studies we know that we are 95% confident that the true average age of menopause in Egyptian females lies somewhere between 41 and 59 years according to the first study or between 48 and 53 years according to the second study. Which study gave us a better estimate? It is obvious that the study with a narrow CI (second study in this example) reflects a better and a tighter possible range than the one with wide CI. This is also mathematically correct as to calculate the confidence interval we always "divide" by the square root of the sample size (n). Thus the higher the sample size is, the nearer it is to the original population, and the narrower is the CI. In other words, the study has more "power" to detect the intended variable. Example: Hughes and colleagues (2004) compared IVF results to no treatment in women with patent fallopian tubes (6). After 3 months, the relative likelihood of delivery after allocation to IVF was 20.9-fold higher than after allocation to no treatment with a 95% CI 2.8-155. This confidence interval tells us that IVF is beneficial over no treatment and that the effect is significant. However, being a very wide interval (lower limit is 2.8 and upper limit is 155) it denotes small sample size that may not be well representative to the population. If another study was conducted with a larger sample size, it would yield a narrower hence better estimate to the true value in the population. Problems with the confidence intervalLast but not the least; although the 95% CI gives us more information than the p-value, it has inherited two important pitfalls from the p-value. First, we are always having a 5% risk to assume a significant difference when actually no difference exists (Type I error). Second, as it measures the effect of chance; statistically significant does not mean clinically significant. REFERENCES
Copyright © Middle East Fertility Society |
