 |
| About Bioline | All Journals | Testimonials | Membership | News |
|
||||||
|
||||||
Middle East Fertility Society Journal, Vol. 11, No. 3, 2006, pp. 183-190 Proteomic analysis of uterine flushings from infertile women in the proliferative phase of the menstrual cycle with respect to estrogen level Hazem M. Al-Rumaih, M.D.*† Karen M. Price, Ph.D. * David J. Gillott, Ph.D. * Gedis J. Grudzinskas, M.D. *† Department of Obstetrics and Gynaecology, St Bartholomew’s School of Medicine and Dentistry, Queen Mary College University of London, and Centre for Reproductive Medicine, St Bartholomew’s Hospital, West Smithfield, London, UK. * Department of Obstetrics and Gynaecology, St
Bartholomew’s School of Medicine and Dentistry, Queen
Mary College University of London, London, UK. Tel: +044
(0)207 601 8259; fax: +044 (0)207 600 1439; e-mail:
d.j.gillott@qmul.ac.uk Received on March 22, 2006; revised and accepted July 5, 2006 Code Number: mf06031 ABSTRACT
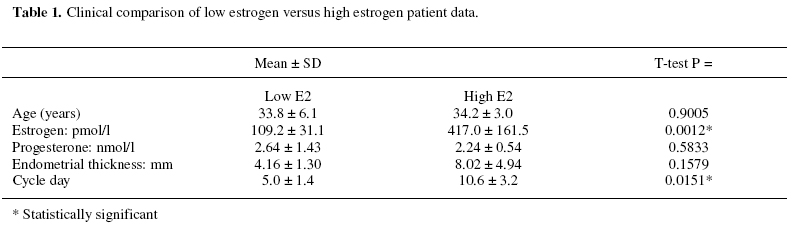
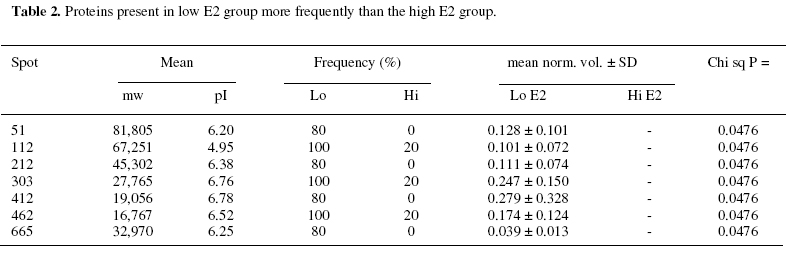
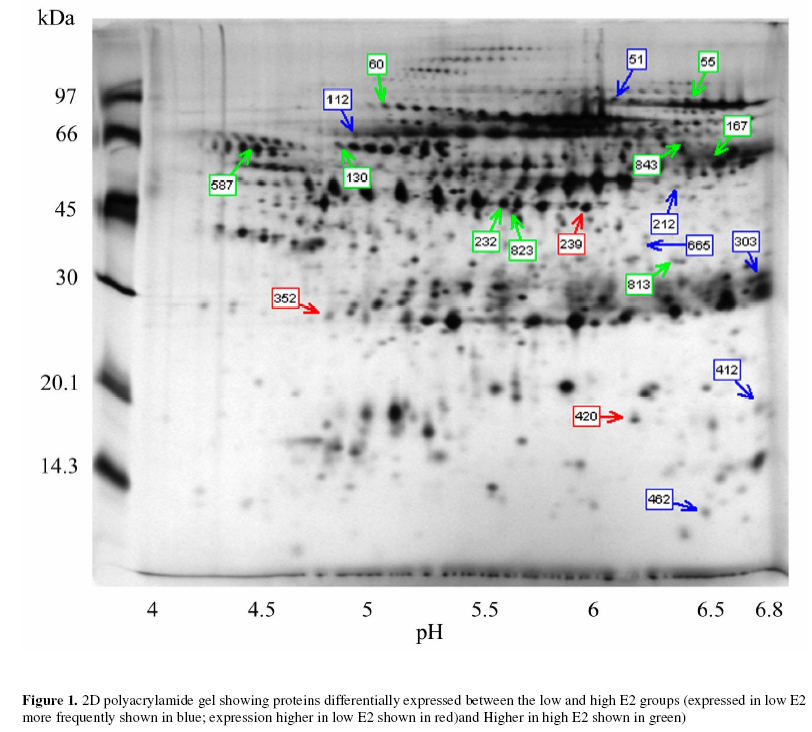
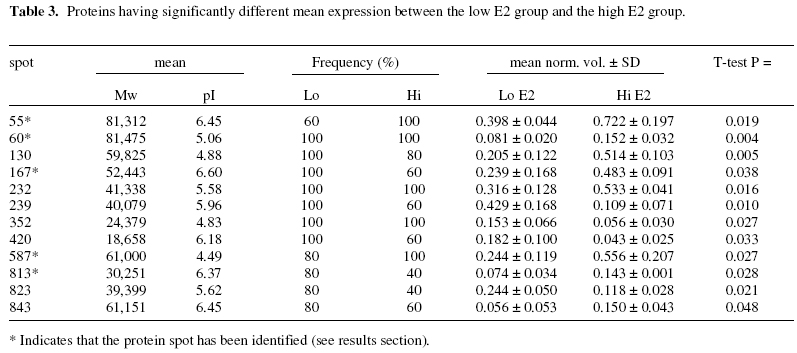
Objectives: To identify those proteins differentially expressed in the uterine cavity according to cycle day or estrogen level and to produce a two-dimensional protein map of proliferative phase uterine flushings. Keywords: Endometrium/electrophoresis/proteomics/Infertility/In-vitro fertilization The human endometrium undergoes considerable changes during the menstrual cycle in response to estradiol and progesterone. The first phase is dominated by responsiveness to estrogen and characterized by a proliferative endometrium. The rise in progesterone after ovulation transforms the proliferative endometrium into the secretory phase in preparation for implantation (1). MacLaughlin et al., (2) described the protein profiles of uterine flushings and endometrial cells in-vitro taken at different times throughout the menstrual cycle. A group of proteins at about 25kD were seen only in secretory washings and tissue explants in-vitro. Judging by the similarities between uterine flushings and plasma it appears that much of the protein is plasma transudate which may be supplemented by contributions from the fallopian tube, ovary or even cervix. However,it has been shown that some of the uterine proteins are derived from the uterine epithelium (2, 3). The cyclic changes in the expression of specific proteins during the normal menstrual cycle were described by Byrjalsen et al. (1). A total of 66 proteins appeared associated with the proliferative phase, 39 in an intermediate phase and 81 secretory phase. These were detected by in-vitro radioactive methionine incorporation of endometrial explants, the proteins themselves were not identified however. Although the endometrial milieu encountered in the proliferative phase differs from the eventual implantation composition, we believe that it may anticipate the nature of the response of the endometrium to the hormonal triggers in the secretory phase. It would be highly desirable to have biochemical markers that reflect the status of the proliferative endometrium at the start of assisted reproduction therapy. As the sampling of the endometrium cannot be carried out in an actual embryo transfer cycle the early analysis may provide an indication of the likelihood of success in a given cycle and mitigate treatment options. The aim of this study is to assess the endometrial microenvironment and identify uterine markers specific to the early and late proliferative phases by establishing 2-dimensional polyacrylamide gel electrophoresis (2D-PAGE) protein maps from infertile women. MATERIALS AND METHODS Uterine flushings were obtained from 31 women undergoing evaluation for infertility, prior to assisted reproductive technology treatment (ART). Of these, eight were diagnosed as having tubal disease, seven had polycystic ovarian syndrome, eight had unexplained infertility and eight were seeking treatment due to male factors. Plasma estradiol (E2) and progesterone (P4) measurements were made before early follicular phase base line Transvaginal Ultrasound Scanning (TVS) and Hysterosalpingo-Contrast Sonography (HyCoSy). Transvaginal ultrasound scans were performed in conventional B-mode with a 6 MHz transvaginal probe, using a SSA-220A ultrasound scanning machine (Toshiba, Japan). Patients were in the dorsal lithotomy position, sector images of the uterus, ovaries and any adnexal pathology were identified and obtained in longitudinal and transverse sections. The anterior to posterior, double layer endometrial thickness was recorded by one of two operators. A 5 French transcervical catheter was used to flush the uterine cavity with 2ml of sterile 0.9% normal saline or 1.5% glycine under TVS guidance. Samples were immediately aspirated and the process repeated up to 3 times or until at least 3 ml of aspirate was collected. Aspirates were centrifuged at 1,600 rpm for 10 minutes, and the supernatants stored at -30º (4). Two-dimensional gel electrophoresis was performed according to the technique of Gorg et al (5) with modifications. Briefly, 30 µg protein samples were incubated for 30 minutes in the presence of 8 M urea, 4% zwitterionic detergent (CHAPS), 65 mM dithiothreitol (DTT) and 2% ampholyte buffer pH 4-7 at room temperature. The five samples with the highest E2 along with the five samples having the lowest E2 levels were selected for analysis. The samples were then applied to 13 cm immobilized pH 4-7 linear gradient strips (Pharmacia) before undergoing isoelectric focusing at 300 V rising to a maximum of 3500 V for a total of 40,000 volt hours. The gradient strips were equilibrated for 15 minutes in buffer containing 50 mM tris-HCl pH 6.8, 2% SDS, 6 M urea and 30% glycerol supplemented with 65 mM DTT. The strips were then applied to 12% vertical acrylamide gels using molten agarose and subjected to SDS polyacrylamide electrophoresis at 25 mA constant current for 4.5 hours. The gels were fixed in 40% methanol with 10% acetic acid before silver staining according to the method of Blum et al (6). Stained 2D-gels were captured as digital images using the UVP GDS8000 system and analyzed with the Phoretic 2D v5.01 software (UK). All protein spots were matched to a virtual reference gel based on all the uterine flushing gels. The intensity and area of each spot was calculated after background subtraction. Statistical analysis was carried out using the Chi squared test in the case of differences in the frequency of expression. Normalized volumes were compared using two-tailed independent t-tests. Statistically significant differences in normalized spot volumes were reported only when the protein spot in question was present in more than 75% of gels. Provisional identification of protein spots was carried out by three independent operators matching uterine flushing to published plasma 2D gels linked to a protein database maintained by the Swiss Institute of Bioinformatics (ExPASy; http://us.expasy.org/) and confirmed by immunoblotting (data not shown). RESULTS A total of 3,311 protein spots were analyzed in the two groups. The mean number of spots detected per gel was 360 (± 93) in the low E2 group and 301 (± 96) in the high E2 group. Normalized volumes were often variable, the mean coefficient of variation (CV) being 57.1% and ranging from 0 to 168.1%. Molecular weight determination was highly reproducible (mean CV 1.57% and range 0 – 12.4%) for the low E2 group; and (mean 1.57% and range 0-10.1%) Isoelectric point determination was also reproducible (mean CV 0.29% and range 0 – 6.32%) for the low E2 group; and (mean CV 0.37% and range 0 – 1.35%) for the high E2 group. Of the five samples having the lowest E2 levels, 3 patients had tubal disease, 1 had PCOS and 1 male factor. The five samples with the highest E2 levels consisted of 1 patient with tubal disease, 1 with PCOS, 2 with male factor and 1 unexplained infertility. Mean cycle day was significantly lower in the low E2 group. Endometrial thickness also appeared lower in the low E2 group, however, this did not reach statistical significance. No other clinical parameters appeared to differ between the two groups (Table 1). Overall, nineteen spots were differentially expressed between the two groups of patients. Seven protein spots appeared significantly more frequently in the low E2 group (Table 2; Figure 1). Three proteins showed higher expression in the low E2 patients, while a further nine spots exhibited higher expression among patients with high E2 levels (Table 3; Figure 1). Five spots were provisionally identified by comparison with the 2D human plasma map and protein database (ExPASy) all of these were increased in the high E2 group, these being; serotransferrin (spot 55), hemopexin precursor (spot 60), fibrinogen β chain (spot 167), fibrinogen γ-chain (spots 232 and 823), α-1 antichymotrypsin (spot 587) and complement component C4 (spot 813). These identities were confirmed with immunoblotting using the appropriate monoclonal antibodies (data not shown). DISCUSSION As demonstrated by this work and other studies, the uterine luminal fluid contains a considerable amount of plasma protein. All uterine flushings containing detectable quantities of hemoglobin (> 5mg/ml) were disqualified from the analysis. Therefore, we can regard the analyzed proteins as representing either plasma exudates, contents of ruptured endometrial cells or specific endometrial secretions, rather than the result of intrauterine bleeding. Estrogen stimulated uptake of plasma proteins has been demonstrated in mice (7) and this may account for the increase in some uterine proteins without the need for increased protein synthesis. However, the mechanism would require the preferential transfer of some proteins since the volume of most protein spots remains unaffected by estrogen levels. Alternatively, changes in protein expression observed in this investigation may reflect localized production or increased secretion into the plasma. Metabolic radiolabelling of uterine explants has demonstrated that some of the proteins present in uterine flushing are of endometrial origin. However, this may be problematic in that normal mitogens may be absent or masked by the growth medium. In addition, the cell populations may change relative to one another in-vitro. Direct analysis of uterine flushings overcomes these difficulties. The fact that each protein species may have slightly different susceptibility to silver staining, coupled with the relatively narrow linear range for this method, make the actual estimation of protein problematic in this semi-quantitative system. Indeed, our intention is merely to show changes in protein expression relative to the total protein present. The precise size of changes cannot be exactly quantified, thought the likelihood is that a two-fold difference in staining intensity may represent a larger difference in actual protein expression, especially if the total protein falls on either side of the linear range. Nevertheless, higher staining intensities do reflect higher protein loads and visa versa. The changes in staining intensity we have measured are statistically sound and are unlikely to have occurred by chance. These considerations, and the disqualification of protein spots appearing in less than 75% of samples, have the overall effect of reducing the sensitivity of the analysis, leading to the possibility that some significant proteins might be missed, rather than providing false positive results. Trends in the electrophoretic profiles appear to be related to the endocrinological state, or cycle day of the subjects. The low E2 group represents the early proliferative endometrium as evidenced by earlier cycle day and lower endometrial thickness in contrast to the high E2 group, i.e. late proliferative phase. It might be expected that progression through the proliferative phase of the cycle would involve increased expression in those proteins specifically associated with the proliferative endometrium, and this is observed for nine protein spots. A further three proteins, while being present, exhibited significantly lower expression towards the end of the proliferative phase. Seven protein spots were absent, (or absent in four out of five samples) in the later part of the phase and may represent specific markers of the early proliferative endometrium. Potential differences in proteomic profiles between the different causes of infertility may exist but are not addressed by this analysis. Only factors common to all the patients are able to reach statistical significance and these cannot therefore be related to the cause of infertility. Protein 239 appears to be uterine specific, not being found in any plasma sample. The remaining proteins are also found in plasma (data not shown). Whether these proteins are also differentially expressed in the plasma is not known. Specific intrauterine binding elements or transport mechanisms may exist to regulate plasma transudation. These questions are currently the subject for further investigations. Two of the provisionally identified proteins, hemopexin precursor (spot 60) and serotransferrin (spot 55) were increased in the high E2 group and are known to be concerned with the transport of iron. Free heme is a potential source of iron for pathogens, and is toxic for cells in that it catalyses the formation of free radicals (8). The transport of heme to tissues by hemopexin is mediated by a specific cell surface receptor, both the hemopexin itself and its receptor recycling after endocytosis (9). Hemopexin is an acute phase reactant induced mainly in the liver following inflammation. The intracellular hemopexin precursor contains high-mannose type oligosaccharides which are believed to be processed to complex type oligosaccharides shortly before secretion (10). Heme oxygenase-1, transferrin and the transferrin receptor are regulated by heme-hemopexin, as are genes that defend against oxidative stress such as cysteine-rich metallothioneins, in addition to cell cycle control agents such as p21WAF1 and the tumor suppressor p53 (11). Serotransferrin (STF) is a monomer composed of two homologous domains (spot 55). Transferrins bind iron and are responsible for its transport from sites of absorption and heme degradation to those of storage and utilization. STF is expressed by the liver and secreted in plasma. Metabolic radiolabelling of endometrial explants has demonstrated uterine synthesis of STF along with upregulation in hyperplasia (12). It is known that persistent estrogen stimulation is associated with increased risk of endometrial hyperplasia, and eventual adenocarcinoma (13). Our observation of increased STF expression in uterine flushings in women with high E2 levels, towards the end of the proliferative phase, is consistent with these data. Endometrial STF synthesis seems to be enhanced by the increasing E2 levels as the proliferative phase of the menstrual cycle progresses. STF may be a molecular marker of endometrial proliferation, or of hyperplasia and adenocarcinoma. High estrogen levels have been implicated as a cause of thrombosis. A significant rise in plasma levels of fibrinogen, has been observed following ovarian stimulation for IVF indicating that such stimulation may create a state of hypercoagulability (14). Concentrations of circulating fibrinogen at the beginning of the menstrual cycle may be predictive of the eventual high levels either after stimulation for IVF or during the luteal phase (15) which may assist in the assessment of likely thromboembolic complications as a result of ovarian hyperstimulation. It appears that platelet function itself is altered during the ovarian cycle due to the influence of progesterone and estrogen. Circulating fibrinogen and fibrinogen degradation products are significantly increased in the luteal phase of the cycle compared to the proliferative phase (16). Maternal fibrinogen is also necessary for maintaining early pregnancy. Patients with congenital afibrinogenemia required the administration of fibrinogen from 4 weeks gestation in order to maintain pregnancy. Immunohistochemical examination of the implantation site has shown fibrinogen to be present at the decidual stroma around invasive cytotrophoblasts at 5 weeks gestation. It has been suggested that fibrinogen acts as an adhesive protein involved in anchoring the cytotrophoblast (17). Another differentially expressed protein involved in the control of coagulation (spot 587) has been identified as alpha-1-antichymotrypsin (AACT). AACT is a serine protease inhibitor (serpin), a member of a superfamily of proteins with a diverse set of functions including control of blood coagulation, complement activation, programmed cell death and development (18). Although the major site of synthesis is the liver it has also been demonstrated by immunohistochemical staining in the nonpregnant, pre-menopausal endometrium, staining being localized to isolated epithelial cells or whole secretory glands (19). The expression of AACT throughout the menstrual cycle remains unclear, plasma levels have been reported to remain relatively constant whilst intrauterine production may be regulated by local factors (20). A mid cycle nadir of expression was found in cervical mucus, though levels were very variable during the early proliferative and secretory phases (21). We find a significant increase in the late proliferative phase. This is consistent with the suggestion made by several authors that AACT may play a role in the implantation process either by regulating the protease activity of the implanting blastocyst or the immunological response to it (19, 22). In addition to its involvement in coagulation and tissue remodelling, AACT is also involved in complement activation. Indeed, complement component C4 (spot 813) appears to be elevated in tandem with AACT. In-vitro radiolabelling studies on uterine explants, obtained from healthy women have demonstrated the de-novo synthesis of complement C3 and C4 proteins in glandular epithelia of gestational endometrium (3). The finding that complement components, in addition to other proteins normally synthesized by the liver or reticulo-endothelial system are synthesized by the human endometrium, suggests a specific uterine function for these molecules. Complement C4 deficiency in humans is strongly linked to autoantibody production. Similarly, deficiency in murine complement C4 (or complement receptors CR1 and CR2) leads to reduced selection against autoreactive B-cells and impaired humoral responses. It is concluded that C4 acts through CR1 and CR2 to enhance humoral immunity and suppress autoimmunity (23). These findings may have consequences for embryo implantation along with localized defense mechanisms against viruses and bacteria. Indeed, murine uterine secretions at the pre-implantation stage contain a fully active complement system (24). The expression of complement C4 was seen to be increased in parallel with the increase in estrogen during the proliferative phase of the menstrual cycle, in line with the notion that C4 is under estrogenic control. No direct evidence exists from other studies on humans to support this, however a recent study reports significantly higher mean levels of circulating C4 in postmenopausal women taking oral conjugated equine estrogen and continuous medroxyprogesterone acetate when compared to untreated women (25). Our findings, along with earlier studies, suggest that C4 expression may be under hormonal control during normal menstrual cycles. Furthermore, estrogen mediated upregulation of complement C3 synthesis by the endometrium, but not the liver has been demonstrated in rats (26). We hypothesize that endometrial production of complement C4 is under estrogenic control, and that C4 has a specific endometrial function. Several of the proteins identified using this analysis provide independent confirmation of earlier findings, but via a completely different experimental process. In addition, several as yet unknown proteins have been identified as differentially expressed in the uterine lumen according to cycle day. These data suggest that the systematic application of proteomics technology to the analysis of uterine flushings may provide new information regarding endometrial molecular processes. Further studies are underway to identify the unknown proteins and to examine differences between various causes of infertility and clinical outcomes. These findings may lead to the development of clinically useful diagnostic or prognostic markers in infertile women. REFERENCES
Copyright © Middle East Fertility Society The following images related to this document are available:Photo images[mf06031t2.jpg] [mf06031t1.jpg] [mf06031f1.jpg] [mf06031t3.jpg] |
| |||||||||
