 |
| About Bioline | All Journals | Testimonials | Membership | News |
|
||||||
|
||||||
Malaysian Journal of Medical Sciences, Vol. 9, No. 1, January 2002, pp. 28-33 Preliminary Studies of Left Ventricular Wall Thickness and Mass of Normotensive and and Hypertensive Subjects Using M-Mode Echocardiography M.S. Jaafar, O. Hamid, Khor C.S. & Yuvaraj R.M.* School of Physics, Universiti Sains Malaysia, Penang
* Department of Cardiology, Penang General Hospital,
Penang
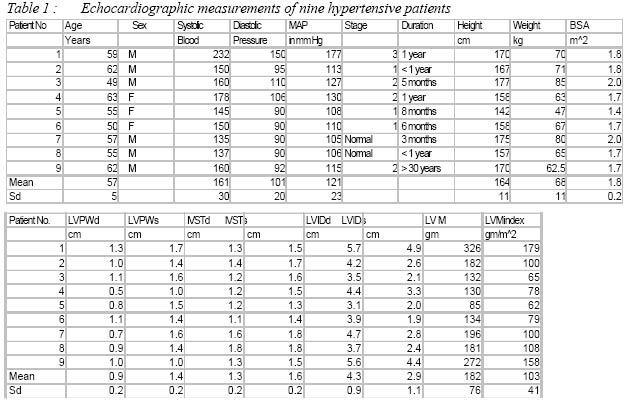
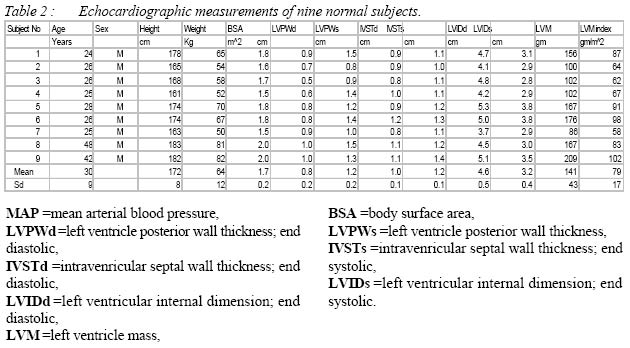
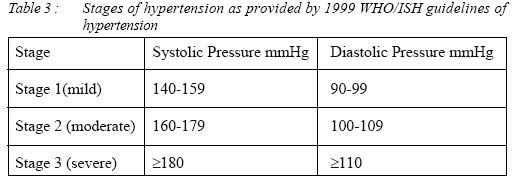
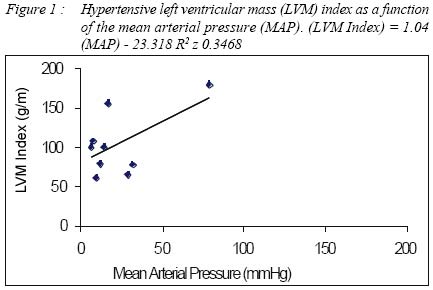
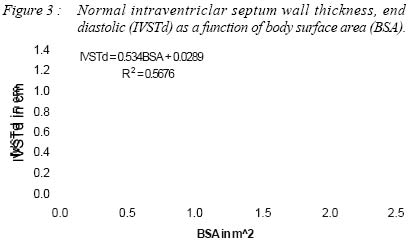
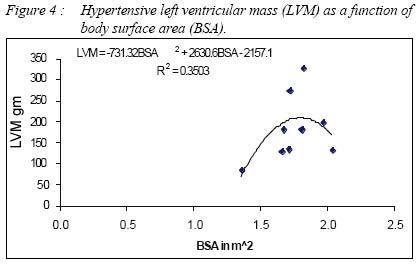
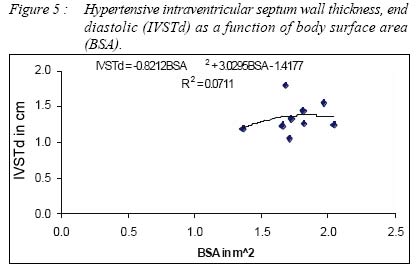
Code Numbers: mj02006 The relationship between left ventricular mass (LVM) and the mean arterial blood pressure (MAP) was investigated, using M-Mode echocardiography. MAP was higher in hypertensive patients (p<0.05, n=9) compared to that of controlled subjects. The results showed that LVM index for hypertensive patients was significantly higher (p<0.05, n=9) than that for the normal group. LVM index correlates fairly (r=0.6) with MAP for hypertensive patients. The results also show that the increase of intraventricular septal wall thickness (IVST) was due to hypertension. The LVM (r =0.9) and IVST (r=0.75) of the normal subjects were linearly dependent on the body surface area (BSA). The hypertensive group revealed a non-linear relationship to the BSA. Key words : M-Mode echocardiography, left ventricular mass, mean arterial blood pressure, body surface area INTRODUCTION High blood pressure exerts an extra strain on the heart since an increased pressure in the aorta increases the resistance against which the heart has to pump. As the load on the heart increases over long period the heart initially tries to compensate by becoming thicker or dilating. The adverse outcomes of elevated systolic or diastolic blood on left ventricular pressure are well discussed (1,2). Among the most frequent hypertensive syndromes are the left ventricular hypertrophy (LVH), left ventricular remodeling, ventricular arrhythmia, an increased propensity for arteriosclerosis, abnormal blood vessel reactivity, vascular hypertrophy and the related abnormality in large and small vessel compliance (2,3). LVH plays an important role in chronic adaptation to pressure or volume overload of the systemic circulation. The degree of hypertrophy parallels the severity of overload (3,4). The aim of this study was to evaluate the mass of the left ventricule for both normal and hypertensive subjects thus correlating the relationship between left ventricular hypertrophy and hypertension. Echocardiography is the non-invasive procedure of choice in evaluating the cardiac effects of systemic hypertension, the most common cause of LVH and congestive heart failure in adults. M-mode and two-dimensional echocardiograph estimates of LVM are more sensitive and specific than either the ECG or the chest radiograph in diagnosing LVH or concentric remodeling, and these estimates have been shown to correlate accurately with LVM at necropsy. Because of its simplicity, widespread availability, relatively low cost and lack of adverse effects, M-mode and two dimensional echocardiography has become the most widely used technique for measurement of human left ventricular mass (5). Methods Study Participants The two-dimensional guided M-Mode echocardiography was performed in nine hypertension patients (six males, three females, of age 57±5 years) and other nine normal subjects (all males, of age 30±9 years) after informed consent was obtained. The study was done from over a period of one month in the Department of Cardiology Penang General Hospital. The blood pressure values were recorded by a trained examiner on seated, relaxed subjects with mercury sphygmomanometers before the echograms tests. The patients had different stages of hypertension with most of them suffering from mild high blood pressure whereas one patient suffered from very severe high blood pressure. Echocardiography Echograms were recorded with Toshiba Diagnostic Ultrasound Equipment Model SSA-380A. The subjects were placed in the left lateral decubitus position. A 12mm diameter crystal transducer, emitting pulse ultrasound was placed parasternally, usually in the left fourth or fifth intercostal space. The frequency of the ultrasound used depends on the patient's chest wall thickness. Lower frequency was used for the patients with deeper heart position or thicker chest wall. Normally the range of the ultrasound frequency used was between 2.5 to 3 MHz. M-mode sweep's speed was preferably maintain at 50 mm/s. All the echograms were saved in a videotape. After the subject had been well placed, a two dimensional guided M-mode echocardiography examination was performed by using the parasternal long axis view at the midventricular level just below the mitral valve leaflets. The following M-mode echocardiograph end-diastolic and end-systolic measurements were obtained by using the American Society of Echocardiography (ASE) method (6): left ventricular internal dimension (LVIDd), intraventricular septal thickness (IVSTd) and left ventricular posterior wall thickness (LVPWd). All at end diastolic of the heart cycle. With the measurement technique of the ASE, LVM was calculated according to the method recommended by Devereux and associates (6) that uses the cube function formula. LVM = (0.8 x [1.04(LVIDd + IVSTd + LVPWd)3 - LVIDd3] + 0.6g LVM index was calculated by dividing the LVM by the subject's body surface area (BSA), where BSA = [(weight (kg) x height (cm))/ 3600]1/2 RESLUTS The Echocardiograph measurements for both hypertensive patients and normal subjects are shown in Tables 1 and 2 respectively. The stages of hypertension are indicated in Table 3 as provided by the 1999 WHO/ISH Guidelines For Management of Hypertension. One patient suffered from stage 3 hypertension, three patients were in stage 2, and the rest had stage 1 hypertension (Table 1). The remaining two patients had blood pressure within normal range, as they were effectively under therapy. MAP was higher in all hypertensive patients (p<0.05, n=9) compared to the controlled subjects who all were normotensive. Patient number 1 was the sole patient with severe hypertension. His echo revealed that the septum, the posterior wall thickness as well as the left ventricular internal dimension showed a marked increase compared to other patients. By comparing the LVM index for hypertension with that of the normal patients, three patients were suspected to suffer from LVH. They were patients with numbers 1, 8 and 9. The LVM index for hypertensive patients was significantly higher (p<0.05, n=9) than that of normal patients. Figure 1 shows that LVM index, for the hypertensives, correlates fairly with MAP (r=0.6). DISCUSSION Hypertension may not be the only factor causing LVH. Other parameters such as heart rate, hormone levels, level of physical activity, myocardial ischemia, heredity, right ventricular overload and coronary heart disease can influence the development of hypertrophy. In comparison to the results shown in a study (7), our results showed only that 8 patients had the signs of septal wall's thickening. There were only three women patients in our study. Two of them (no. 4 & 5) show thickening of their septal wall. Both of them were more than 50 years old. This a possibility that thickening of septal wall was caused by aging effect and not necessary caused by high blood pressure and was high. The LVM values strongly correlated (r= 0.9) with the body surface area, as shown in Figure 2, also the IVSTd correlated well with body surface area, (Figure 3) for the normal subjects (r =0.75) . With the increase in body surface area, the cardiac output must commensurate with the body's metabolic demands, so the LV must be thickened or enlarged to pump adequate volume of blood to the whole body. The LVM and IVSTd show non-linearity (Figure 4 & 5) in relation to BSA for hypertensive patients. This meant that the heart could not enlarged any further with increasing BSA. This preliminary study showed that LVM changes can be related to blood pressure. The group average age was not the same for the two groups as we found difficulty in finding healthy volunteers above 50 years old. This study has encouraged us to image the heart walls utilizing various methods and will be used in constructing elasticity images of the heart free wall with intentions to obtain the Young's modulus of the heart wall under different conditions. ACKNOWLEDGEMENT: The author acknowledges the research grant provided by Universiti Sains Malaysia, Penang that has resulted in this article. REFERENCES
Copyright 2002 - Malaysian Journal of Medical Sciences The following images related to this document are available:Photo images[mj02006f5.jpg] [mj02006t3.jpg] [mj02006f4.jpg] [mj02006f1.jpg] [mj02006t2.jpg] [mj02006t1.jpg] [mj02006f3.jpg] |
| |||||||||
