 |
| About Bioline | All Journals | Testimonials | Membership | News |
|
||||||
|
||||||
Malaysian Journal of Medical Sciences, Vol. 10, No. 2, July 2003, pp. 40-49 GLYCAEMIC CONTROL OF TYPE 2 DIABETIC PATIENTS ON FOLLOW UP AT HOSPITAL UNIVERSITI SAINS MALAYSIA Eid M, Mafauzy M*, Faridah AR Department of Chemical Pathology *Department of Medicine, School
of Medical Sciences, Universiti Sains Malaysia, 16150 Kubang Kerian,
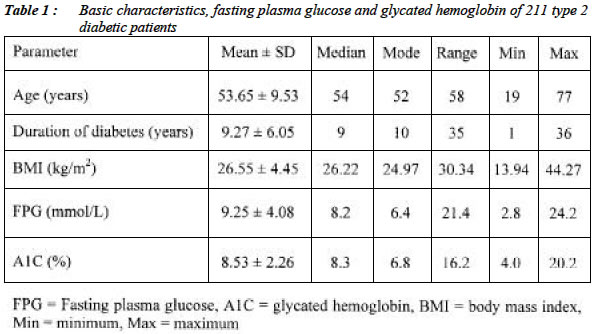
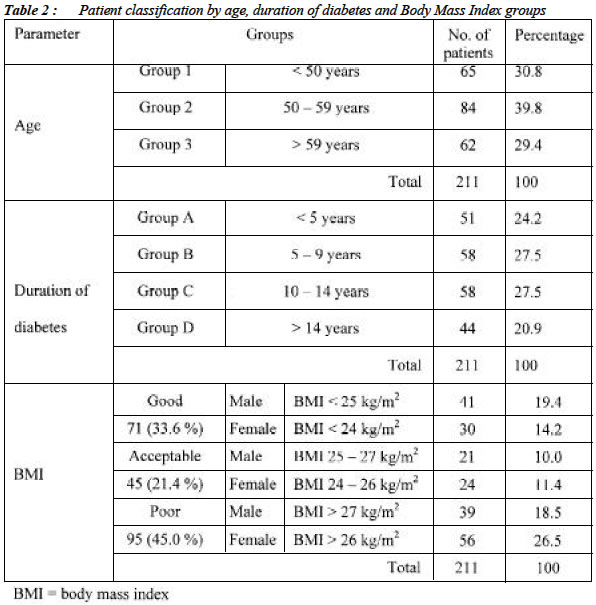
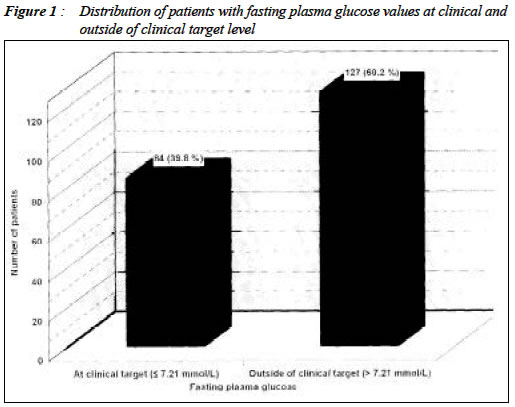
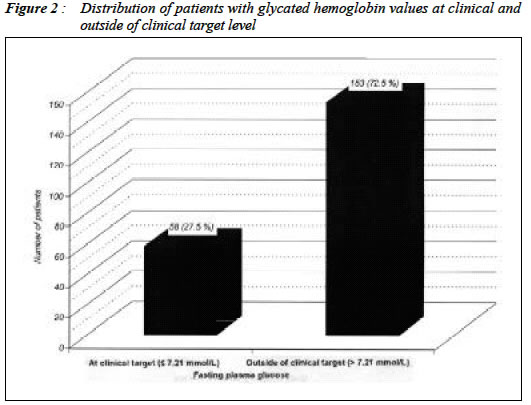
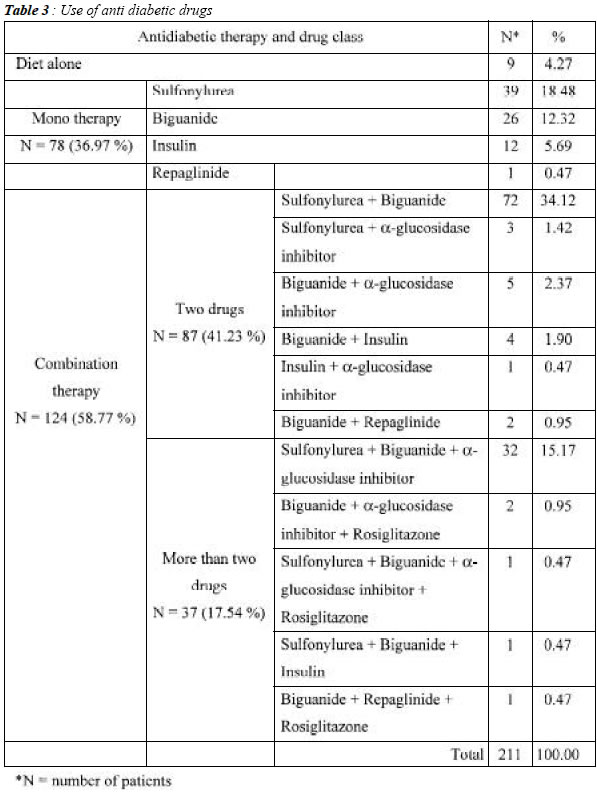
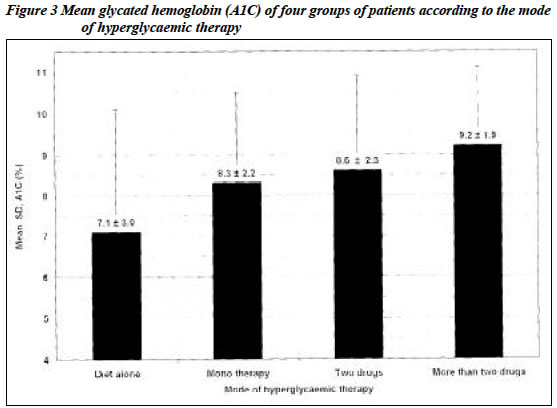
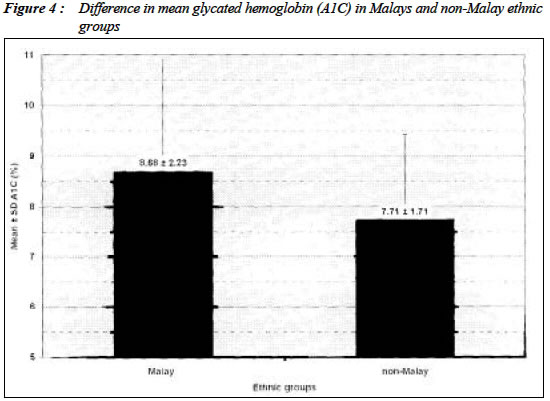
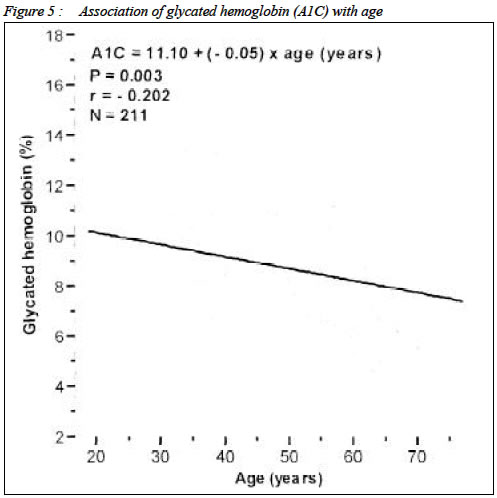
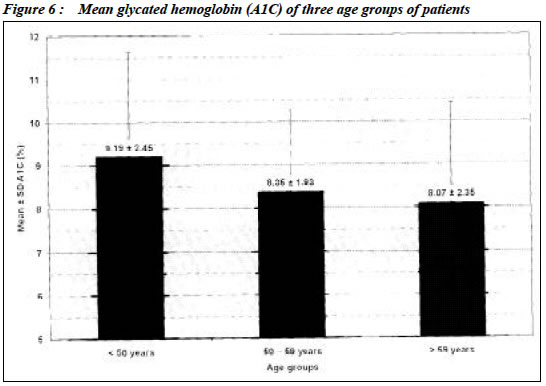
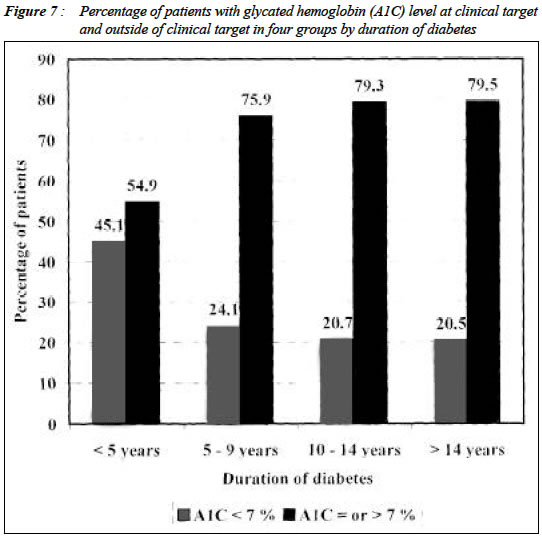
Kelantan, Malaysia Submitted-21.4.2003, Code Number: mj03021 Two hundred and eleven (211) patients with type 2 diabetes mellitus who were on treatment and monitored for complications at the Outpatient Diabetes Clinic in Hospital Universiti Sains Malaysia, Kubang Kerian between 2001 - 2002 were selected for the study. A structured questionnaire was administered to obtain their medical and family history. Physical examination was performed and fasting venous blood sample was collected for plasma glucose and A1C analysis. Of the total 211 patients, only 4 % were on diet treatment alone, 37 % of them were on mono therapy while 59 % were on combination of therapies. Fasting plasma glucose (FPG) > 7.2 mmol/L and glycated hemoglobin (A1C) levels > 7 % were observed in 60 % and 73 % of type 2 diabetic patients, respectively. Glycated hemoglobin level of 28 % of the subjects were < 7 %; 36 % were between 7 - 9 % and 36 % were more than 9 %. The worst glycaemic control was observed in Malay patients. A1C of Malay and non-Malay subjects were 8.7 ± 2.3 % and 7.7 ± 1.7 %, respectively. Younger patients (age group < 50 years) had significantly higher mean A1C than elderly patients. Duration of diabetes had a clear influence on glycaemic level. Patients with recently diagnosed diabetes (duration of disease < 5 years) had the best glycaemic control. In this study a large proportion of the patients had poor glycaemic control. The variables with significant effects on glycaemic control were ethnicity, age and duration of diabetes mellitus. Better treatment strategies and methods should be used to improve diabetes control and to reduce long-term complications of diabetes. Key words : Glycaemic Control, Type 2 Diabetes Mellitus INTRODUCTION Type 2 diabetes is the most prevalent form of diabetes and is due to the combination of insulin resistance and defective secretion of insulin by pancreatic β-cells (1). The prevalence of diabetes mellitus and impaired glucose tolerance were 10.5 % and 16.5 % in the state of Kelantan in north-east Malaysia (2). In the Second National Health and Morbidity Survey of Malaysia, the prevalence of diabetes was 8.3 % and that of impaired glucose tolerance was 4.3 % (3). There are currently 119.2 million people with type 2 diabetes worldwide, and the number is expected to increase to 212.9 million, in the year 2011 (4). Diabetes mellitus is a major risk factor for morbidity and mortality due to coronary heart disease (CHD), cerebrovascular disease, and peripheral vascular disease. Metabolic control and duration of type 2 diabetes are important predictors of coronary heart disease (ischaemic heart disease) in elderly subjects, particularly in women (5). Hyperglycemia affects biochemical parameters and influences the progression of coronary heart disease and mortality rates in diabetic patients. Aggressive treatment to control hyperglycemia is much more effective in reducing the number of complications than standard treatment (6, 7). There is a direct relationship between the degree of plasma glucose control and the risk of microvascular complications of both type 1 (8) and type 2 diabetes (9). Type 1 diabetic patients with lower average plasma glucose concentrations had a significantly lower incidence of microvascular complications, but reduction in the risk of macrovascular complication was not significant (8). Similar results were observed in type 2 diabetic patients (9). Glycated hemoglobin is formed from the slow, non-enzymatic reaction between glucose and hemoglobin (10). The rate of synthesis of glycated hemoglobin is principally related to the concentration of plasma glucose. Measurement of glycated proteins, primarily glycated hemoglobin, is widely used for routine monitoring of long-term glycaemic status in patients with diabetes mellitus. Glycated hemoglobin is a clinically useful index of mean glycaemia during the preceding 120 days, the average life span of erythrocytes (10 - 14). The aim of the study was to determine diabetes control in patients attending diabetes clinic in a teaching hospital and factors affecting the control. SUBJECTS AND METHODS Selection of patients Patients were selected from among patients attending the Diabetes Clinic, Hospital Universiti Sains Malaysia (HUSM). The patient's personal data, medical, family, dietary history and daily activities were recorded. Height and weight for BMI calculation were also measured and recorded using a data collection form. After 12 hours of fasting (overnight) 5 ml venous blood sample was collected and analyzed at the Chemical Pathology Laboratory. 2.5 ml blood was aliquoted into a tube containing potassium ethylene diamine tetrachloroacetic acid (EDTA) for determining glycated hemoglobin level. Another 2.5 ml blood was aliquoted into a tube containing sodium oxalate for determining fasting plasma glucose level. The height and body weight of each subject were measured using the SECA weighing balance with height attachment to the nearest decimal point with light clothing but without shoes. Body weight status was estimated by the body mass index (BMI) computed in metric units as weight (kg)/height2 (m2). The concentration of plasma glucose was determined by automated enzymatic GOD-PAP method using commercial kits (RANDOX) on Hitachi 912 autoanalyzer. All samples were analyzed for quantitative glycated hemoglobin concentration using the DiaSTAT hemoglobin A1c programme on Bio-Rad DiaSTAT analyzer. Standard procedures recommended by DiaSTAT hemoglobin A1c programme for analyzing A1C were followed. Statistical analysis Statistical Package for Social Sciences (SPSS) statistical software (version 10.0, SPSS) was used for the analysis of biochemical and personal data in this study. The normality of each variable was tested by histogram and box plot and finally confirmed by Kolmogrov-Smirnov test. Association with baseline continuous variable was assessed with Pearson's correlation coefficients, and it was confirmed by linear regression. The association between a pair of binary variable was examined by Chi-square (X2) analysis. To analyze the difference between group means, Student t-test for two groups (two independent means) was used for variable with normal distribution. Mann Whitney test was used for variable with non normal distribution. One-way ANOVA test was used to analyze differences between groups (more than two means). For group comparisons, Bonferroni's method was used. Level of significance (P) was set at 0.05 and P value < 0.05 was accepted as significant. RESULTS Altogether 211 type 2 diabetic patients who were on treatment for diabetes and complications at the Outpatient Diabetes Clinic in HUSM Kubang Kerian between 2001 - 2002 participated in the study. The study group contained 101 (48 %) males and 110 (52 %) females. Among these subjects, 178 (84 %) were Malays, 30 (14 %) were Chinese and 3 (2 %) were Indians. Out of 211 type 2 diabetic patients, 31 (15 %) were current smokers and 180 (85 %) were non-smoker. Only 62 (29 %) had positive family history of diabetes mellitus and 149 (71 %) had negative family history of diabetes mellitus. Basic characteristics of type 2 diabetic patients are listed in Table 1 and 2. Clinical targets for glycaemic control in type 2 diabetes The specific targets for metabolic control in patients with type 2 diabetes include a fasting (preprandial) plasma glucose level between 5 - 7.21 mmol/L (90 -130 mg/dl) and a glycated hemoglobin (A1C) level of < 7 % (15). The normal range for A1C is between 4 % and 6 % (15). Fasting plasma glucose (FPG) and glycated hemoglobin (A1C) levels outside of target level were observed in 127 (60 %) and 153 (73 %) of type 2 diabetic patients, respectively (Figure 1 and Figure 2). The patients were classified into three glycaemic control groups. Good, acceptable and poor glycaemic control groups were defined as A1C less than 7 %, 7 - 9 % and more than 9 %, respectively. There were 58 (27 %) patients in good glycaemic control group. A1C of 77 (37 %) of patients was between 7 % and 9 %. A1C more than 9 % was observed in 76 (36 %) of patients. All patients were on treatment for diabetes at the time of sample collection. The patients were classified into four groups according to the mode of hyperglycaemic therapy at presentation. Group I, group II, group III, and group IV were defined as diet alone, mono, combination (two drugs), and combination (more than two drugs) mode of hyperglycaemic therapy. Only 9 (4 %) patients were on diet alone, 78 (37 %) on mono therapy, and 124 (59 %) on combination therapy (Table 3). The percentage of patients with A1C level outside of clinical target level for group I, group II, group III, and group IV were 33 %, 68 %, 74 %, and 89 %, respectively. Group IV had significantly highest mean % A1C than other groups. The lowest mean A1C was observed in group I (Figure 3). There were 133 (78 %) Malays and 20 (61 %) subjects of non-Malay ethnic groups who had A1C level outside of clinical target level. Malay subjects had higher A1C than the non-Malay. A1C of Malay subjects and non-Malay subjects were 8.7 ± 2.3 % and 7.7 ± 1.7 %, respectively. The mean difference in % A1C between Malays and non- Malays was 0.97 % and statistically significant (P = 0.023, t-test). Difference in mean A1C (%) in Malays and non-Malay ethnic groups is shown in Figure 4. Linear regression analysis showed a significant negative correlation of % A1C with age (degree of correlation = - 0.202 and P = 0.003), (Figure 5). The mean ± SD A1C of age group < 50 years, age group 50 - 59 years, and age group > 59 years are shown in Figure 6. The difference in mean % A1C between age group < 50 years and age group 50 - 59 years was 0.84 %, between age group < 50 years and age group > 59 years was 1.12 %, and between age group 51 - 59 years and age group > 59 years was 0.28 %. The age group < 50 years had significantly highest mean % A1C than other two groups. The difference in mean % A1C between age group < 50 years and age group 50 - 59 years, and between age group < 50 years and age group > 59 years were statistically significant (P = 0.024 and 0.005, respectively). The difference in mean % A1C between age group 50 - 59 years and age group > 59 years were not statistically significant (P = 0.451). The patients were classified into four groups according to the duration of diabetes (Table 2). The percentage of patients with A1C level outside of clinical target for group A, group B, group C, and group D were 55 %, 76 %, 79 %, and 80 %, respectively (Figure 7). The likelihood of having A1C level outside of clinical target was significantly correlated with the duration of diabetes (P = 0.013, X2 test). Patients with recently diagnosed diabetes (duration of disease < 5 years) had the best glycaemic control. Pearson's correlation and linear regression analyses showed very weak and negatively directed correlation between BMI and A1C. The degree of correlation between BMI and A1C was - 0.079, and P-value was 0.127. The patients were classified into three (good, acceptable, and poor) BMI control groups (Table 2). There was no significant difference in the proportion of patients having % A1C values above target level between good, acceptable and poor BMI groups (P = 0.97, X2 test). A1C of male subjects was 8.6 ± 2 % and female subjects was 8.5 ± 2 %. There was no significant difference in mean A1C level between male and female subjects (P = 0.852). Having A1C values outside of clinical target level was not associated with family history of diabetes mellitus (P = 0.746, X2 test). There was no association between smoking and glycaemic control of type 2 diabetes (P = 0.125, X2 test). Multiple logistic regression analyses were performed to evaluate further the association of baseline risk factors with glycaemic control. Independent variables included in the model were age, gender, ethnicity, duration of diabetes, and BMI to determine if these had independent significant effects on the dependent variable (A1C). The variables with significant effects on A1C (glycaemic control) were duration of the diabetes mellitus (P = 0.002) and age (P = 0.005) in multiple logistic regression analysis. DISCUSSION In this study a large proportion of the patients had poor glycaemic control. This finding is similar to previous report (16, 17). However, the current study has shown that American Diabetes Association (ADA) guidelines for glycaemic control cannot always be achieved in specialist clinic practice, although this was claimed to be achieved in another study (18). However, even in this study, Miller et al found that only 61 % of their subjects had A1C < 7 %. The variables with significant effects on A1C level (glycaemic control) were ethnicity, age and duration of the diabetes mellitus. The worst glycaemic control was observed in Malay patients (18). Younger patients (age group < 50 years) had significantly highest mean percent A1C than elderly patients. Duration of diabetes had a clear influence on glycaemic level. Patients with recently diagnosed diabetes (duration of disease < 5 years) had the best glycaemic control. After duration of 5 - 9 years of diabetes, there were no changes in their mean levels of glycaemia (16). Similar result had been obtained by Östgren et al., 2002 (19). Gender, family history of diabetes mellitus, smoking, and BMI had no significant effects on glycaemic control in type 2 diabetic patients (17, 19). Poor control of diabetes in our study may be due to dietary habits of this region. The local diet contains high carbohydrates especially sugar, eggs, coconut and its products. The second contributory factor may be reduced daily physical activities, which was observed in the subjects. Most of them had no daily physical activities. Female subjects completely lacked daily physical activities. The third contributory factor may be lack of knowledge of the disease and its medication. It was found that most of the patients did not know about their disease and the complication of their disease. They were also not taking their medication regularly. In this study a large proportion of the patients had poor glycaemic control. The variables with significant effects on glycaemic control were ethnicity, age and duration of diabetes mellitus. Better treatment strategies and methods such as intensifying education and adopting more intensive monitoring and treatment regimes, should be used to improve diabetes control and to reduce long-term complications of diabetes. REFERENCES
Copyright 2003 - Malaysian Journal of Medical Sciences The following images related to this document are available:Photo images[mj03021t2.jpg] [mj03021f6.jpg] [mj03021f5.jpg] [mj03021f1.jpg] [mj03021t1.jpg] [mj03021f2.jpg] [mj03021t3.jpg] [mj03021f7.jpg] [mj03021f3.jpg] [mj03021f4.jpg] |
| |||||||||
