 |
| About Bioline | All Journals | Testimonials | Membership | News |
|
||||||
|
||||||
Malaysian Journal of Medical Sciences, Vol. 10, No. 2, July 2003, pp. 50-59 THE MAGNITUDE OF FOVEAL SUPPRESSION DURING FIXATION DISPARITY IN PRESBYOPIC PATIENTS Faudziah Abd-Manan, TCA Jenkins*, NA Kaye** Department of Optometry, Faculty of Allied Health Sciences, University
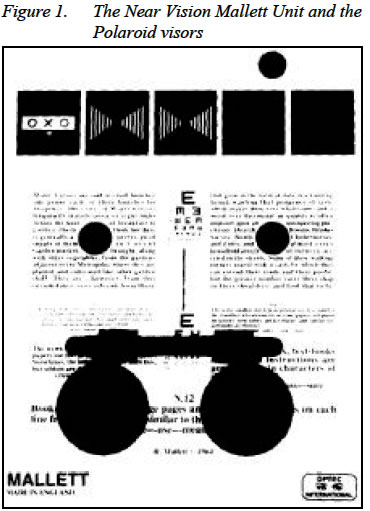
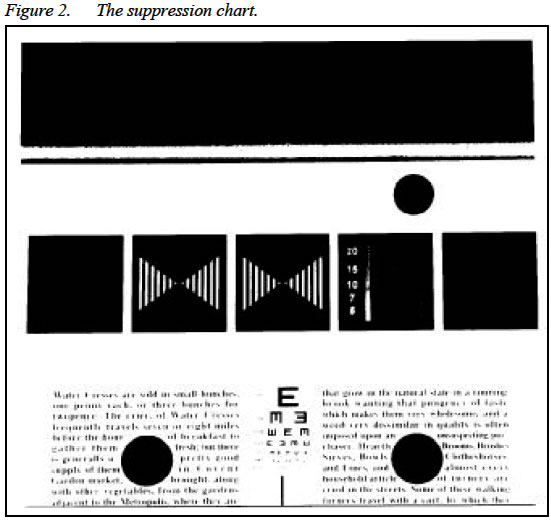
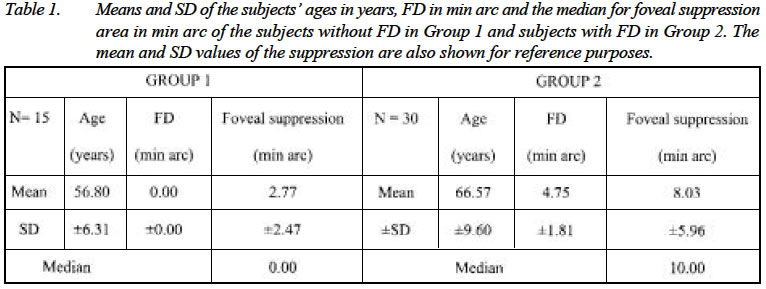
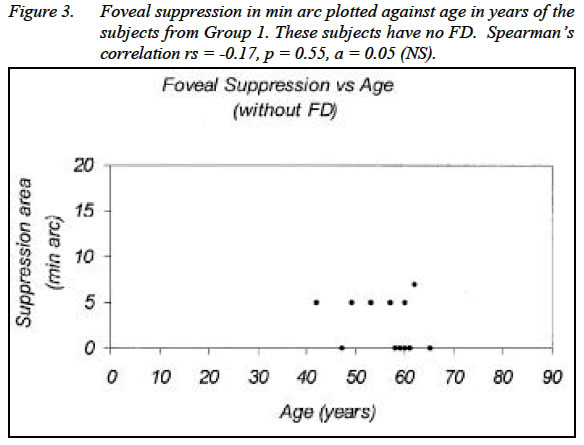
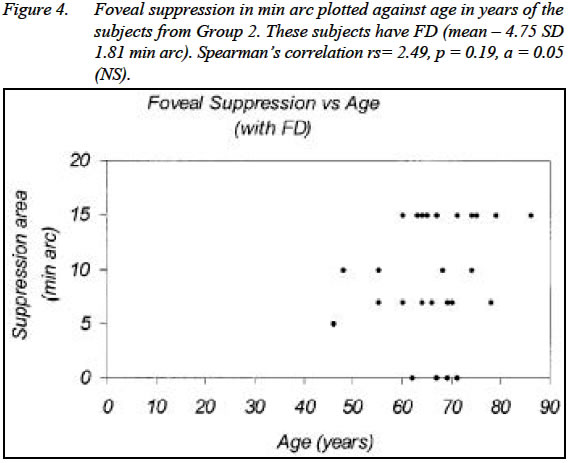
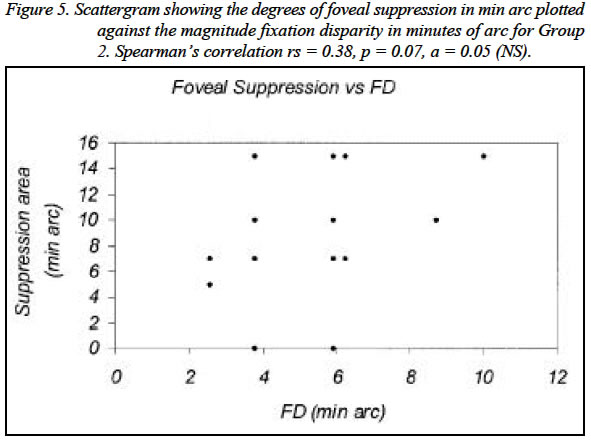
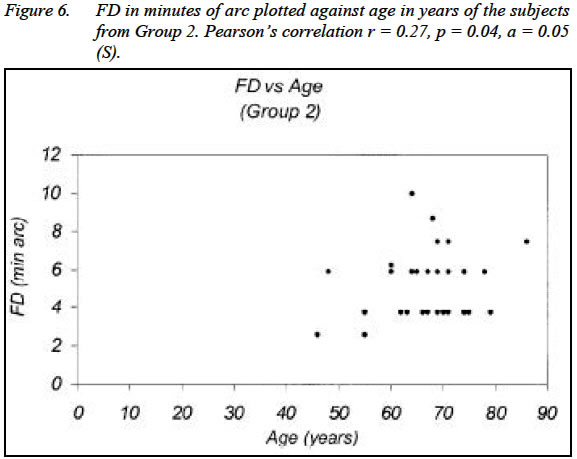
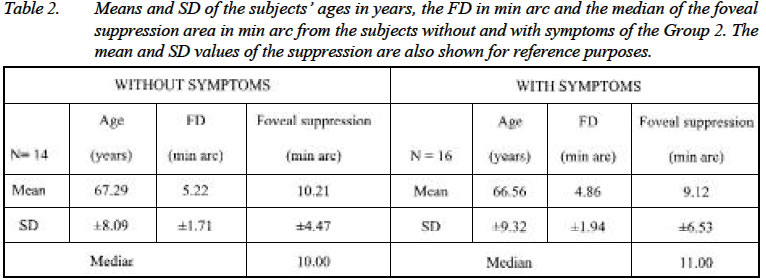
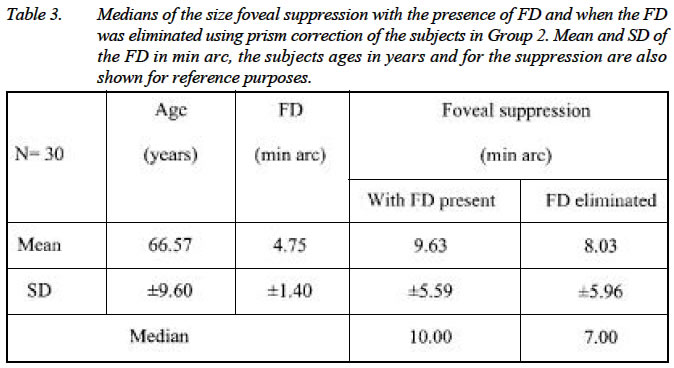
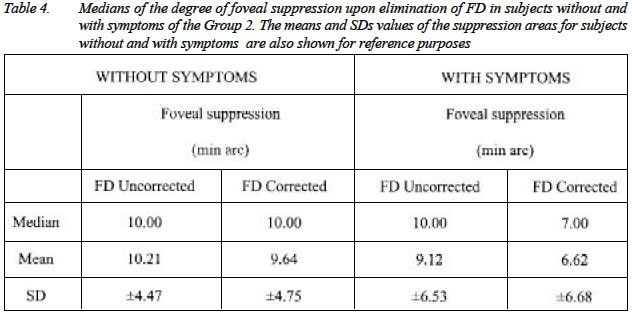
Kebangsaan Malaysia, Jln Raja Muda Abd Aziz, 50300 Kuala Lumpur. Submitted-27.6.2002, Code Number: mj03022 The characteristics of foveal suppression (FS) in fixation disparity (FD) due to visual stress were investigated and their relationship's between, age, symptoms, and the effect of temporary elimination of FD using prisms on the degree of the FS were analysed. Forty-five presbyopic subjects (15 without FD and 30 with stress related FD) participated in the study. The subjects underwent comprehensive optometric examination prior to the study. Their FS and FD were measured. The FD was later corrected with ophthalmic prisms, the power of which was equally divided between the eyes, and the FS was later verified. Age and FS had no significant correlation for subjects without FD (Spearman's rs = 0.17, p = 0.55,NS) and in subjects with FD (rs = 2.49, p = 0.19, NS), respectively. Correlation between the degree of FS and FD was weak (rs=0.38, p=0.07), however the magnitude of FD significantly increased with age (r=0.27, p=0.04). Subjects with FD had significantly larger degree of FS compared with subjects without FD (Wilcoxon's Z =-0.25, p=0.01). There was no significant difference in the magnitudes of FD (t = -0.38, p=0.07) and in their degrees of FS (Mann-Whitney U = 1.5, p=0.71) between subjects with and without symptoms. Correcting the FD with prisms generally reduced the degree of FS (Wilcoxon's Z =1.96, p=0.04), however, significant change in FS only occured in subjects with symptoms (Z=-1.97, p=0.03), but was not significant in subjects without symptoms (Z=-0.70, p=0.48). Key words : fixation disparity, foveal suppression, symptoms, prism correction INTRODUCTION Visual suppression during binocular vision has been described as a regional reduction in the sensitivity of one eye to maintain binocular vision (1). It occurs due to inter-ocular differences of images between the eyes, which its development is reported to concern more with the retinal location than with the visual stimulus itself (2). Visual suppression during binocular vision includes retinal rivalry and suppression scotoma (3). It is well known that suppression scotoma occurs in order to eliminate the distressing sensory aspects of visual perception like diplopia and confusion, by suppressing the conflicting visual information from specific regions of one eye (4,5). It is commonly found in cases of squint. It can also be found during monocular blur like in clinical cases of anisometropia (5,6) and in anisometropia artificially induced in the laboratory (7). Schor and Erickson (8) claimed that visual suppression due to monocular blur is regional in nature and that it is confined to the corresponding area of the defocused eye. Simpson (7), on the other hand, suspects that suppression during monocular blur may be attributed by the presence of a small misalignment of visual axis of the defocus eye. For a very small misalignment of the visual axis like in longstanding cases of decompensated heterophoria, the area of suppression has been speculated to be very small in that it confines within the fovea of the affected eye (9,10). Mallett (11) has advanced this view through the inclusion of the foveal suppression chart (FS) in the fixation disparity (FD) unit that he designed. FD describes a very small misalignment of visual axes occurring during binocular vision (12,13,14). Its presence can be physiological or related to stress on the vergence systems (15). A physiological FD is a naturally occurring vergence error (13,14) that acts as a stimulus for vergence eye movements during normal binocular vision. The cue for an error of vergence is an intrinsic presence of retinal disparity of the right and the left retinal images, occurring due to some 60 mm lateral separation of the right and the left eyes known as, the interpupillary distance. Physiological FD is asymptomatic, has no detrimental effect to binocular vision and its presence is indeed required for vergence movements of the eyes. FD due to visual stress, on the other hand, refers to misalignment of visual axes due to imbalances of the vergence and accommodative systems (10,15). Its presence is associated with an inability of the eyes to overcome heterophoria (11,16). The occurrence of stress on the visual systems can be detected towards the end of a working day (17), when the demand on visual tasks becomes excessive (18) and in a poorly illuminated work place (19). The condition becomes obvious in presbyopes, particularly those who require an update to the additional refractive correction for near vision (20). It is believed that the visual systems of the presbyopes are susceptible to stress producing FD as demand to accommodative effort increases whilst amplitude accommodation decreases with advancing age. Several extensive studies on FD and its relationship with heterophoria and symptoms of binocular decompensation had been conducted (15,18,19,20). The findings suggest that FD due visual stress can be differentiated from that of physiological FD by its magnitude (10,18) . The magnitude of FD eliminated by prisms corresponds with the value of associated heterophoria (21,22). Associated heterophoria value of 1 prism dioptre and more in non-presbyopes or, 2 prism dioptres and more in presbyopia, are indicators of the presence of stress on the visual systems (10,22). Values less than those suggest that the FDs are physiological. This study investigates the occurrence of FS in two groups of subjects, those without FD and those with FD due to stress on the visual system. The extents of the suppression area between the two groups were compared. The subjects with stress related FD were also subdivided into asymptomatic and symptomatic groups, and the relationship between the magnitudes of FD and the size of the FS area between the subgroups was analysed. SUBJECTS Forty-five subjects, all of whom were presbyopic participated in the study. They had visual acuity of 6/6 or better, measured with the Snellen chart and the ability to read N5 at 40 cm on the Standard Reading Chart with their best near vision correction. Only those who were non-strabismic, did not show any manifest deviation of either eye or marked latent movement (seen from the cover test for distance and near fixation) were selected. The subjects also had good ocular health as examined by funduscopy and had good general health taken from self-report. The subjects were grouped into two, Group 1 and Group 2. Group 1 consist of 15 presbyopes of ages ranging from 42 to 65 years (mean 56.80 and standard deviation (SD) ±6.31) showing no FD. They were recruited from patients attending Optometry Clinic at the University of Bradford, England. This group of subjects served as control. Group 2 were 30 presbyopes of ages ranging from 46 to 86 years (mean age 66.57 SD±9.60) who exhibited FD of more than 2 prism dioptres associated heterophoria. All subjects were patients presenting to NA Kaye Optometrists, England, requiring an update to their presbyopic corrections. Of the 30 patients, 14 of them were asymptomatic whilst the other 16 presented with various symptoms of visual discomforts such as pulling sensation of the eyes, occasional tearing, stress and strain surrounding the eyes. METHODOLOGY All subjects underwent comprehensive eye examination and their refractive errors were optimally corrected. Throughout the study the Near Vision Mallett Unit (34) was used in the measurement of FD whilst FS was assessed using the suppression chart incorporated in the unit. Figure 1 depicts the Near Vision Mallett Unit and the accompanying Polaroid visors used for the study whilst Figure 2 is the suppression chart used to measure foveal suppression, respectively. Loose prisms were used to measure FD in its associated heterophoria value (prism dioptres). Most of the time, the value of the prisms was divided between the eyes to minimise binocular distortion, if any. Prior to the tests, the subjects were briefed on the appearance of the of the top and bottom monocular markers on the OXO on the Mallett Unit should FD be or not be present. Subjects were also briefed on the appearance of the polarised letters on the unit in cases where there was FS and where was no suppression. To facilitate the subjects identifying the appearance of `no suppression', subjects were asked to read the chart without the visor, thus viewing the entire letters on the chart. Asking the subjects to read the chart through the required Polaroid visor with the left eye covered, hence seeing only the non-polarised letters and the right half of the words, simulated left eye suppression. Similarly, reading the chart through the visor with the right eye covered simulated suppression of the right eye. Experiment 1 for Group 1 The subjects had their FD verified first. Wearing their best refractive correction, the subject was presented with a Mallett Unit for near vision and asked to hold the unit at 40 cm from the spectacle plane. The subject was then asked to read a few lines of the general paragraphs on the face of the unit. This was aimed to stabilise peripheral fusion and hence binocular vision. The FD was then measured, using the minimum prism value, which gave an appearance of alignment of the monocular markers. Only those without FD were selected for this experiment. This was then followed by the measurement of FS on the suppression chart on the unit. Wearing an appropriate polarised visor on top of the best near vision correction, the subject was instructed to read the polarised letters on the suppression chart, line by line. If the subject misread any of the letters, or any letters were missing, he/she was encouraged to count the numbers of letters seen. The reading was recorded on a score sheet provided. Experiment 2 for Group 2 The experiment began with the measurement the subjects' FDs. The procedure is similar to that described in the Experiment 1. The magnitude of the FD was taken using minimum prism value, equally divided between the eyes, which give an appearance of alignment of the monocular markers. The value of the prism was later converted into its angular measure. Yekta (23) found that FD measured in its associated heterophoria value in prism dioptre can be substituted in its angular measure by employing a regression equation of the form: y = 1.23x - 0.09, where y is the FD in minutes of arc and x is the associated heterophoria in prism dioptres. A similar equation was employed in a later study with convincing results (24). In this study, the conversion of the values of the prism used to eliminate the presence of FD was converted in its angular measure by a similar fashion. This was followed by an assessment of the FS. The method was similar to that performed in the Experiment 1. The reading was again recorded. The suppression test chart reading was repeated, this time with the presence of the prisms, which eliminated the FD worn before the eyes. The method for measurement of the FS was similar to that described in the Experiment 1. The reading was recorded. RESULTS FS in subjects without FD versus subjects with FD Tests for normality on the FS data from Group 1 showed a positive skew (degree of skewness 0.58) whilst data in Group 2 showed a negative skew (degree of skewness -0.57). Considering the truncated scale of the FS measurement (those are 15, 7, 5, and 0 mins arc), the data from FS is treated as non-parametric. Examination of the data from Group 1, it is shown that a small degree of FS (median 0.00, mean 2.47 SD ±2.77 min arc) occurs in the sample of subjects (47%) ages 40 years and over who are disparity-free. The large SD may suggest a large individual variation in the FS data and the affects of the truncated scale of the FS chart. For subjects in Group 2, the mean and SD of the subjects' the FD are 4.75 ±1.81 in minutes of arc, and the median of the degree of foveal suppression is 10.00 (mean 8.03 SD± 5.90) minutes of arc. Table 1 shows the means and SDs of the subjects' ages in years, the FD in minutes of arc, and the median of the degree of FS in its angular measure of the data from Groups 1 and 2. The means and SDs of the FS data are also included for reference purposes. It can be seen that the median (as well as the mean values) of the FS are greater in subjects with FD (Group 2) than that of the subjects without FD (Group 1). The Wilcoxon's test result shows that the difference between the FS data of the two groups is statistically significant ( Z = -2.51, p = 0.01, a = 0.05). The spread of the degree of the FS area with respect to the age for subjects in Group 1 is shown in Figure 3. Spearman's correlation shows that there is no significant correlation between the degree of FS and the subjects' ages (rs = 0-0.17, p = 0.55, a = 0.05, NS). Figure 4 shows the spread of the degree of the FS with respect of the subject's age of the Group 2. The Spearman's correlation also shows no significant correlation between the degree of FS and age in this group of subjects (rs = 2.49, p = 0.19, a = 0.05, NS). There is weak correlation between the degree of FS and the magnitude of the FD as shown by Spearman's correlation test (rs = 0.38, p = 0.07, a = 0.05, NS). Figure 5 is a scattergram showing the degrees of FS in min arc plotted against the magnitude of FD in minutes of arc for Group 2. However, there is a significant relationship between the magnitude of FD and age, suggesting the magnitude of FD increases as age advances (Pearson's correlation r = 0.27, p = 0.04, a = 0.05. Figure 6 is the scattergram plot of the magnitues of FDs in minutes of arc and subjects ages in years. FS in subjects exhibited FD without symptoms and with symptoms The FS in subjects exhibiting FD (Group 2) with symptoms and without symptoms was studied. Table 2 shows the mean and SD of the subjects' ages in years, the FD (min arc), and median of the degree of FS in minutes of arc, of the subjects without and with symptoms. The mean and SD of the FS are also included for reference purposes. In the table, the value of the FS prior to and upon correction of the FD is also shown. Independent t-test (t = -0.38, p = 0.07, a = 0.05, NS) on the two means of FDs, and a Mann-Whitney U-test (U = 1.5, p = 0.71, a = 0.05, NS) on the degree of FS, between subgroups without and with symptoms, respectively, shows no significant result. Hence the findings suggest that patients who complain of symptoms do not show a significant difference in either the magnitude of the FD nor the degree of the FS from those who are symptom-free. The effect of correction of FD on the FS Elimination of the FD using prism correction appears, in general, to help reduce the degree of FS. This is supported by a statistically significant Wilcoxon's test result (Z = -1.96, p = 0.04, a = 0.05). Table 3 shows the medians of the FS with the presence of FD and when the FD was eliminated using prism correction of the subjects in Group 2. Mean and SD of the FD in min arc, the subjects ages in years and, the degree of FS are also shown for reference purposes. However, upon inspection of the data from subjects with and without symptoms, elimination of the FD using prism correction appears to help reduce the degree of the FS in the symptomatic group (Wilcoxon's test Z = -1.97, p = 0.03, a = 0.05) but this does not seems to be the case in the asymptomatic group (Wilcoxon's test Z = -0.70, p = 0.48, a = 0.05) respectively. Table 4 shows the medians of the degree of FS upon elimination of FD in subjects without and with symptoms of the Group 2. The means and SD values of the FS areas for subjects without and with symptoms are also shown for reference purposes. DISCUSSION The findings of the study show that some degree of FS occurs in presbyopes, regardless the presence of FD. However, the study reveals that the percentage of the occurrence of FS is higher in those with FD related to visual stress ( 75%) as compared to those whose without FD (47%), respectively. Nevertheless, the degree of the FS is higher in presbyopes with FD than in presbyopes without FD. There is a suspicion that the factor of age may contribute to the presence of FS in the presbyopic age group. Such factors are like changes in the neural substrate of the visual cortex (25,26,27,28) and general reduction in the visual performance (29,30,31). The relationship between the magnitude of FD and the degree of FS is statistically not significant. However, there seems to be a significant relationship between the magnitude of FD and age, suggesting the magnitude of FD increases as age advances. It is interesting to note also, that all subjects in the study had exo-FD. A shift in the magnitude of heterophoria towards exo-deviation as age advances is well known (21). It happens mainly as a secondary effect to the reduced amplitude of accommodation due to age (30,31), a phenomenon known as of physiological exophoria (32). Therefore, it is not surprising to find the increasing magnitude of FD, whose presence is related to stress on the visual system in the presbyopic age group, is also towards the direction of exo-FD. The presence or absence of symptoms in binocular vision anomalies seems to play a significant role in dealing with the FS during FD. As has been found in the study, the degree of the FS significantly reduces upon elimination of the FD with prism correction in symptomatic subjects, but it does not seem to be the case in the asymptomatic group. The presence of symptoms in binocular anomalies involving cases of decompensated heterophoria have been reported to plays an important role in indicating whether the condition is recent or has been long standing. This does not rule of fixation disparity (9,10,11). Most symptoms of visual discomfort in binocular anomalies are originated from mismatch between patient's visual psychology and environmental visual demand (32) and activation of the autonomic nervous system (33), amongst others. They indicate that the imbalances in the vergence and accommodation systems are recent (10). However, when the symptoms cease, some form of sensory adaptation has occurred. Such sensory adaptation includes the formation of suppression scotoma in some area in the retina. When the angle of the deviation is large, the suppression may be total, involving the entire area of the visual field (5,7). For a very small angle of deviation like in cases of FD the FS area may confines only within the area of fovea (10,11,34). However, if the presence of FD has been longstanding, an enlargement of the area of FS eventually pursues (9). Georsch (9) suggests that suppression, which is small and deep, is less symptomatic than when the suppression is large and shallow. The depth of suppression is not quantified in this particular study. However, a Mann-Whitney U test (U = 1.5, p = 0.71) on the degree of FS between the subgroups without and with symptoms of the Group 2 show no significant result. The independent t-test on the two means of FDs of the 2 subgroups also shows not significant result (t = - 0.38, p = 0.07, NS). The findings suggest that symptoms are not related to whether suppression is present, nor are they related to the degree of FS. And the presence symptoms also do not appear to be related to the magnitude of FD. The results of this study also reveal that elimination of FD helps to minimise the degree of FS to a certain extent. However, the findings reveal that elimination of the FD using prism correction appears to reduce the degree of the FS in the symptomatic group, but this does not to occur in the asymptomatic group. The long-term effect of wearing minimum amount of prism, which gives an apparent alignment of the monocular markers on the Mallett Unit, on the magnitude of the FD and the degree of the FS is not known. North and Henson (35) claimed that people with subnormal degrees of binocular vision invariably have abnormal adaptation to prism, suggesting that a good prognosis from wearing of prism may be achieved from patients who have subnormal binocular vision. Nevertheless, the application of their findings to obtain long-term benefits in treating FS in decompensated heterophoria with FD by prescribing of prisms may require further clinical assessment. REFERENCES
Copyright 2003 - Malaysian Journal of Medical Sciences The following images related to this document are available:Photo images[mj03022t2.jpg] [mj03022f2.jpg] [mj03022t3.jpg] [mj03022t1.jpg] [mj03022f3.jpg] [mj03022f1.jpg] [mj03022t4.jpg] [mj03022f5.jpg] [mj03022f4.jpg] [mj03022f6.jpg] |
| |||||||||
