 |
| About Bioline | All Journals | Testimonials | Membership | News |
|
||||||
|
||||||
Malaysian Journal of Medical Sciences, Vol. 11, No. 1, January 2004, pp. 44-51 Dyslipidaemic Patter of Patients with Type 2 Diabetes Mellitus Eid Mohamed, Mafauzy Mohamed*, Faridah Abdul Rashid Department of Chemical Pathology, *Department of
Medicine, School
of Medical Sciences, Universiti Sains Malaysia, Health Campus 16150 Kubang Kerian,
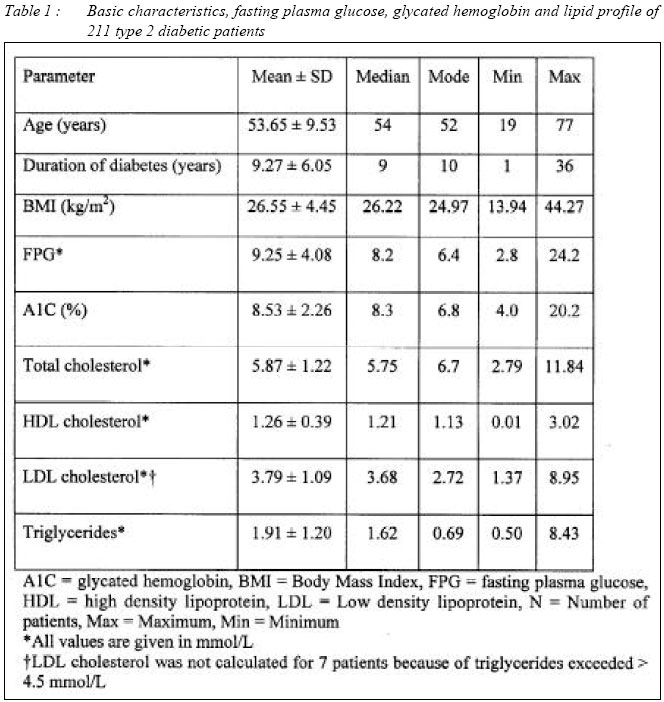
Kelantan, Malaysia Submitted-16.3.2003 Code Number: mj04005 The aim of the study was to define dyslipidaemic pattern among type 2 diabetic patients using American Diabetes Association guidelines for the classification of lipoprotein concentrations into CVD risk categories. The total number screened was 211 type 2 diabetic patients who were on treatment between 2001 - 2002 for diabetes at the Outpatient Diabetes Clinic in HUSM Kubang Kerian. Fasting venous blood samples were analysed for plasma glucose, glycated hemoglobin and serum lipids. Type 2 diabetic patients with high, borderline, and low risk LDL cholesterol level were 62 %, 25 %, and 10 %, respectively. There were 26 % patients in the high risk HDL cholesterol group, 31 % were in the borderline risk group, and 43 % were in the low risk group. Only 3 % and 25 % of patients had triglycerides concentration in the high and borderline risk categories, respectively, but 72 % had low risk triglycerides levels. More female and younger subjects than men and older subjects had HDL cholesterol in high and borderline risk categories. The percentages of patients with triglycerides values at high and borderline high risk category were higher in poor and acceptable glycaemic control groups than good glycaemic control group. The most prevalent dyslipidaemia pattern was an isolated LDL cholesterol increase, which was observed in 35 % of the patients. The second most common pattern of dyslipidaemia was a combination of LDL cholesterol above goal with HDL cholesterol below target, which was observed in 30 % patients. Patients with established dyslipidaemia will require advice regarding diet, exercise and improvement in glycaemic control. An active strategy of early detection and drug treatment for dyslipidaemia is needed for type 2 diabetic patients. Key words : Dyslipidaemia, Type 2 Diabetes Introduction The term hyperlipidaemia refers to an increase in concentration of one or more plasma or serum lipids, usually cholesterol and triglycerides and the term dyslipidaemia is used for either an increase or decrease in concentration of one or more plasma or serum lipids. Type 2 diabetic patients have markedly increased risk of coronary heart disease than similarly dyslipidaemic non diabetic subjects (1). Low HDL and HDL2 cholesterol, high VLDL cholesterol, and high total and VLDL triglycerides are powerful risk indicators for coronary heart disease events in patients with type 2 diabetes mellitus (2, 3). Most recently, results of the Strong Heart Study indicate that LDL cholesterol is an independent predictor of cardiovascular disease in patients with diabetes, along with age, albuminuria, fibrinogen, HDL cholesterol (inverse predictor), and percent body fat (inverse predictor) (4). Atherogenic dyslipidaemia (diabetic dyslipidaemia) is characterized by 3 lipoprotein abnormalities: elevated very-low-density lipoproteins (VLDL), small LDL particles, and low high-density-lipoprotein (HDL) cholesterol (the lipid triad) (5, 6). Despite the high and widespread prevalence of dyslipidaemia among people with and without diabetes, only 2.2 % (7) of adults without diabetes and 32 % (8) of diabetic patients were receiving treatment with diet, exercise, or drugs to reduce lipid levels and less than one third of patients with established cardiovascular disease received such treatment. (7). Furthermore, among those who were being treated, only 1 % reached the American Diabetes Association (ADA) goal of LDL < 2.6 mmol/L (100 mg/dl) (8). The aim of this study was to define dyslipidaemic pattern among type 2 diabetic patients attending a diabetes clinic. Subject and Method Selection criteria Patients were selected for study from among patients attending the Outpatient Diabetes Clinic, Hospital Universiti Sains Malaysia (HUSM), Kubang Kerian, Kelantan Malaysia. Those patients who agreed to participate in the study were informed of the programme and schedule of the study. The patient's personal data, medical, family, dietary history and daily activities were recorded. Height and weight for BMI calculation were also measured and recorded using a data collection form. After 12 hours of fasting (overnight) 10 ml blood was collected into appropriate tubes and taken to Chemical Pathology Laboratory for analysis. The height and body weight of each subject were measured using the SECA weighing balance with height attachment to the nearest decimal point with shoes and outer garments removed. Body weight status was estimated by the body mass index (BMI) computed in metric units as weight (kg)/height2 (m2). All samples were determined for glycated hemoglobin concentration using the DiaSTAT hemoglobin A1c programme on the Bio-Rad DiaSTAT analyzer. Standard procedures recommended by DiaSTAT hemoglobin A1c programme for analyzing A1C were followed. Serum total cholesterol concentration was determined by automated enzymatic CHOD-PAP method using commercial kits (Roche) on Hitachi 912 autoanalyzer. Serum HDL cholesterol was measured by precipitation method (HDL cholesterol precipitant, Roche). HDL cholesterol was quantitated by analyzing the supernatant obtained following precipitation of plasma aliquot with phosphotungstic acid and Mg2+ ions. The LDL cholesterol concentration was calculated for each sample according to the Friedewald formula [LDL cholesterol (mmol/L) = Total cholesterol - (Triglycerides/2.2 + HDL Cholesterol)]. Serum triglycerides concentration was determined by automated enzymatic GPO- PAP method using commercial kits (Roche) on Hitachi 912 autoanalyzer. Statistical analysis Statistical Package for Social Sciences (SPSS) statistical
software (version 10.0, SPSS) was used
for the analysis of biochemical and personal data in this study.
The normality of each variable was tested by histogram and box plots and finally
confirmed by Kolmogrov-Smirnov test. The association between a pair of binary
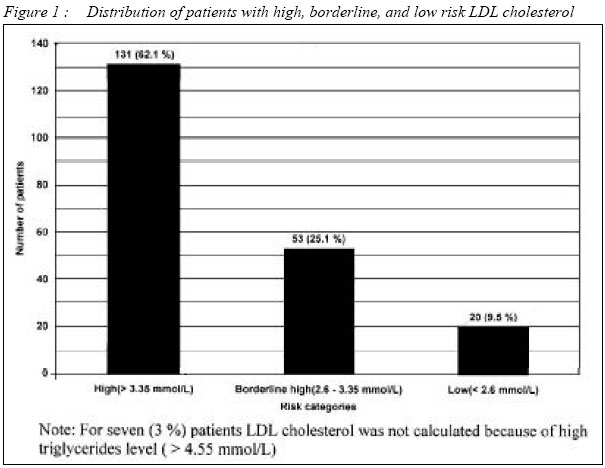
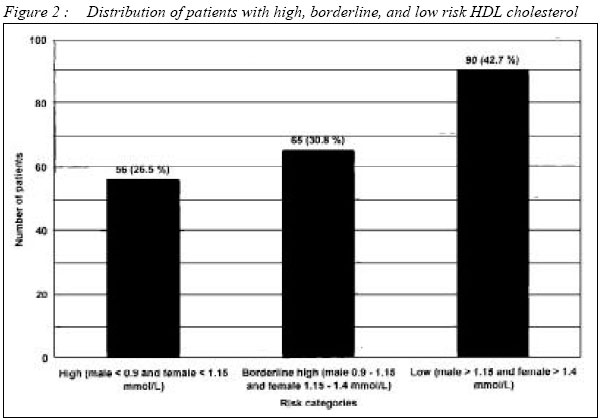
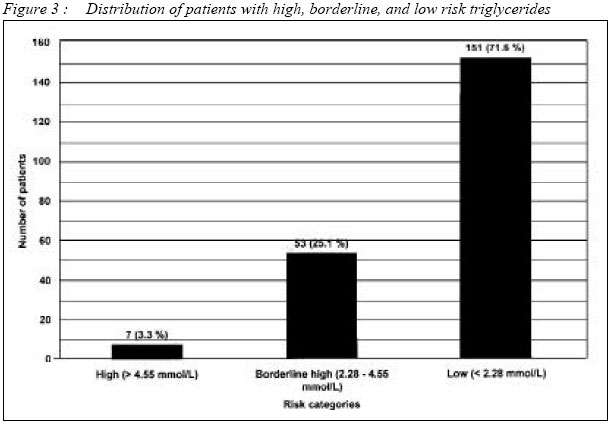
variable was examined by Chi-square Results The total number screened was 211 type 2 diabetic patients who were on treatment for diabetes at the Outpatient Diabetes Clinic in HUSM, Kubang Kerian between 2001 - 2002. The study group consisted of 178 (84 %) Malays, 30 (14 %) Chinese and 3 (2 %) Indians. Among these subjects 101 (48 %) were males and 110 (52 %) were females. Details of patients' basic characteristics are given in Table 1. Pattern of serum lipid by risk category The American Diabetes Association guidelines (9) were used to classify lipoprotein concentrations into CVD risk categories. The values used to define low-, borderline-, and high-risk low density lipoprotein (LDL) cholesterol levels were < 2.6 mmol/L (100 mg/dl), 2.6 - 3.35 mmol/L (100 - 129 mg/dl), and > 3.36 mmol/L (130 mg/dl), respectively. For triglycerides (TG), the cutoff points were < 2.28 mmol/L (200 mg/dl), 2.28 - 4.55 mmol/L (200 - 399 mg/dl), and > 4.56 mmol/L (400 mg/dl). High-, borderline-, and low-risk categories for high density lipoprotein (HDL) cholesterol concentrations were defined according to sex. For men the cutoff points were < 0.9 mmol/L (35 mg/dl), 0.9 - 1.15 mmol/L (35 - 45 mg/dl), and > 1.15 mmol/L (45 mg/dl), respectively. For women the cutoff points were < 1.15 mmol/L (45 mg/dl), 1.15 - 1.40 mmol/L (45 - 55 mg/dl), and > 1.40 mmol/L (55 mg/dl), respectively. As shown in Figure 1, 56 (26 %) patients were in the high risk HDL cholesterol group, 65 (31 %) were in the borderline risk group, and 90 (43 %) were in the low risk group. Type 2 diabetic patients with high, borderline, and low risk LDL cholesterol level were 131 (62 %), 53 (25 %), and 20 (10 %), respectively (Figure 2). LDL cholesterol was not calculated for seven (3 %) patients (because triglycerides level was more than 4.5 mmol/L and this did not permit valid LDL cholesterol calculation). Only seven (3 %) and 53 (25 %) of patients had triglycerides concentration in the high and borderline risk categories, respectively, but 151 (72 %) had a low risk triglycerides level (Figure 3). The distribution of LDL cholesterol in high,
borderline, and low risk categories was not significantly affected by age, gender,
glycaemic control and body mass index. The variables with significant effects
on the distribution of HDL cholesterol in high, borderline, and low risk categories
were gender and age. The percentages of male subjects with high, borderline,
and low risk HDL cholesterol were 14 %, 33 % and 53 %, respectively. For female
subjects the
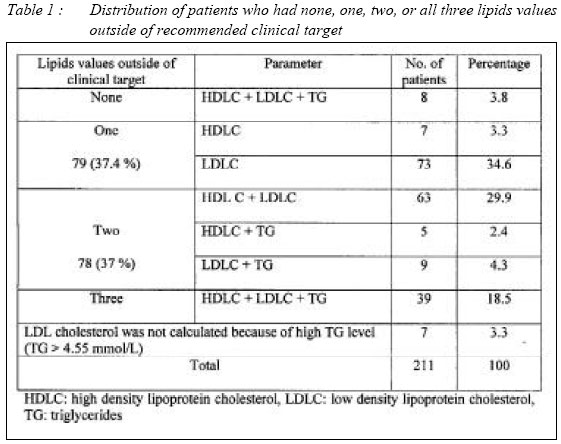
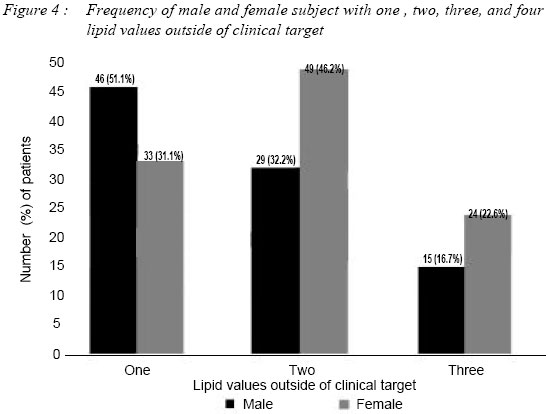
proportions were 38 %, 29 % and 33 %, respectively (P < 0.001, The ADA guidelines recommend an HDL cholesterol level of 1.15 mmol/L (45 mg/dl) in men and 1.4 mmol/L (55 mg/dl) in women, an LDL cholesterol level of < 2.6 mmol/L (100 mg/dl), and a triglycerides level of < 1.71 mmol/L (150 mg/dl) as clinical targets for lipids in type 2 diabetes (10). HDL cholesterol at clinical target and outside of clinical target level were observed in 90 (43 %) patients (54 [26 %] male and 36 [17 %] female) and 121 (57 %) patients (47 [22 %] male and 74 [35 %] female) respectively. There were 20 (10 %) and 184 (87 %) patients with LDL cholesterol value at clinical target and outside of clinical target level, respectively. LDL cholesterol was not calculated for 7 (3 %) patients because of high triglycerides level ( > 4.5 mmol/L). Triglycerides at clinical target level was observed in 115 (54 %) patients. There were 96 (46 %) patients with triglycerides value outside of clinical target level. Multiple logistic regression analyses were performed to evaluate further the association of baseline risk factors with the probabilities of having serum lipid (HDL cholesterol, LDL cholesterol and triglycerides) that were outside of recommended clinical targets. Independent variables included in the model were age, gender, ethnicity, duration of diabetes, body mass index, and glycaemic control (A1C) to determine if these had independent significant effects on the dependent variable (HDL cholesterol, LDL cholesterol and triglycerides). The variable with significant effects on HDL cholesterol was gender (P = 0.003). There was no variable with significant effects on LDL cholesterol. The variable with significant effects on triglycerides was glycaemic control (P = 0.003) in multiple logistic regression analysis. Proportion of patients with none, one, two, or three lipid values outside of clinical target Type 2 diabetic patients who had none, one, two, or all three lipids values outside of clinical target were 8 (4 %), 79 (37 %), 78 (37 %), and 39 (19 %), respectively (Table 2). LDL cholesterol was not calculated for seven (3 %) patients (because triglycerides levels more than 4.5 mmol/L did not permit valid LDL cholesterol calculation). The most prevalent dyslipidaemia pattern among type 2 diabetic patients was an isolated high LDL cholesterol, which was observed in 73 (35 %) of the patients. A combination of LDL cholesterol above goal with HDL cholesterol below target was observed in 63 (30 %) patients, which made this the second most common pattern of dyslipidaemia. The third common pattern was a dyslipidaemia involving all three lipid (HDL, LDL cholesterol and triglycerides) values outside of clinical target, which was observed in 39 (19 %) patients. There were 9 (4 %) patients who had LDL cholesterol and triglycerides values outside of clinical target level. About 7 (3 %) patients had isolated low HDL cholesterol. A combination of triglycerides with an HDL cholesterol values outside of clinical target was observed in 5 (2 %) patients. Only 8 (4 %) patients had all three lipid values (HDL, LDL cholesterol and triglycerides) in low risk category. Proportion of male and female patients with one, two or three lipid values outside of clinical target Chi-square analyses were performed to evaluate further the association of baseline risk factors with the probabilities of having one, two, or three serum lipid (HDL cholesterol, LDL cholesterol and triglycerides) outside of recommended clinical targets. In this analysis the observed variable with significant effects was gender. For subjects with a triglycerides level < 4.55 mmol/L (because higher values did not permit valid LDL cholesterol calculation), the proportion of patients who had one, two or all three lipid (HDL, LDL cholesterol and triglycerides) values outside of clinical target were determined. This analysis considered those patients who had HDL cholesterol <1.15 mmol/L in men and < 1.40 mmol/L in women, those with LDL cholesterol of >2.6 mmol/L, and triglycerides of 1.71 - 4.55 mmol/L. Out of 211 type 2 diabetic patients, 196 patients were involved in this analysis. The remaining 15 patients were not included in this analysis (8 patients had all four lipid values at clinical target level and for 7 patients the LDL cholesterol concentrations were not calculated). There were 90 male and 106 female subjects. Altogether 46
(51 %), 29 (32 %), and 15 (17 %) male subjects had one, two, and three lipid
values (HDL, LDL cholesterol and triglycerides) outside of clinical target,
respectively. Female subjects with one, two, and three lipid values outside
of clinical target were 33 (31 %), 49 (46 %), and 24 (23 %), respectively.
The differences between male and female subjects with one, two, and three lipid
values outside of clinical target were statistically significant (P = 0.017 Discussion The NCEP, ATP III (11) recommends aggressive LDL reduction for patients with diabetes (i.e., an LDL goal < 2.6 mmol/L). Likewise, the ADA recommends in its position paper that the major emphasis for treating diabetic dyslipidaemia should be placed on lowering LDL cholesterol levels to < 2.6 mmol/L (100 mg/dl), even in patients with no history of CVD (9). The optimal goal for LDL cholesterol is 2.6 mmol/L (100 mg/dl). When using this clinical end point, a substantial percentage (91 %) of patients in this study would require intervention and ongoing monitoring to ensure that the recommended LDL cholesterol goal is reached and maintained. The optimal goal for HDL cholesterol is > 1.15 mmol/L (45 mg/dl). When using this clinical end point, 57 % of patients in this study were found to require intervention and ongoing monitoring. Triglycerides concentration of 28 % patients were in the high and borderline risk categories (>2.28 mmol/L). Similar results were found among urban African-Americans with type 2 diabetes (12). In this study, Cook et al found that the percentages of African-Americans with LDL > 2.6 mmol/L was 86 %, HDL < 1.15 mmol/L was 74 % and high and borderline triglycerides was 19 %. Compared to our study population the means ( + s.e.m.) for age was similar (53 + 0.2 years), BMI was higher (33 + 0.1 kg/m2 ), A1C was higher (9.3 + 0.04 %) and FPG was higher (10.6 + 0.07 mmol/L). In another study in Malaysia, Ismail et al (13) found that 90.9 % of their subjects had HDL-cholesterol > 2.6 mmol/L, 52.6 % had HDL-cholesterol < 1.15 mmol/L and 27.3 % had triglycerides > 2.3 mmol/L. These figures are also quite similar to ours. The most common pattern of one or more lipid values in the high and borderline risk categories was an isolated increase in LDL cholesterol, which was observed in 44 % of the patients. The second most common pattern was a combination of high LDL and low HDL cholesterol, which was seen in 30 % of patients. All three lipid values of 18.5 % of patients were in the high and borderline risk categories. In the study by Cook et al (12), the most common lipid abnormality was high LDL with low HDL cholesterol (49.9 %). Second was isolated increase in LDL cholesterol (20.3 %) and 12.0 % of their patients had high LDL, low HDL cholesterol and high triglycerides. The findings in our study indicate that lowering LDL cholesterol along with increasing HDL cholesterol comprises an important target for intervention in our population. Glycaemic control and gender were important determinant of having lipid values in high and borderline high risk categories. Cook et al (12) also found that African-American women had significantly greater odds of having an LDL above target, an HDL cholesterol level below clinical goal and lesser odd of having triglycerides level above clinical goal compared to men. They, however, did not analyse for glycaemic control. Ismail et al (13) found in their type 2 diabetics, that ethnicity was an important determinant for LDL and HDL cholesterol; glycaemic control for LDL cholesterol and triglycerides and gender for HDL cholesterol. In conclusion, the proportion of patients with lipid levels outside of clinical target values was high. Patients with established dyslipidaemia will require advice regarding diet, exercise and improvement in glycaemic control. One suggestion is that an active strategy of early detection and drug treatment for dyslipidaemia is needed for type 2 diabetic patients. References
Copyright 2004 - Malaysian Journal of Medical Sciences The following images related to this document are available:Photo images[mj04005t2.jpg] [mj04005f3.jpg] [mj04005t1.jpg] [mj04005f2.jpg] [mj04005f1.jpg] [mj04005f4.jpg] |
| |||||||||
