 |
| About Bioline | All Journals | Testimonials | Membership | News |
|
||||||
|
||||||
Malaysian Journal of Medical Sciences, Vol. 13, No. 2, July 2006, pp. 37-44 ORIGINAL ARTICLE INSULIN SENSITIVITY AND SECRETORY STATUS OF A HEALTHY MALAY POPULATION Abu Kholdun Al-Mahmood, Aziz Al-Safi Ismail*, Faridah Abdul Rashid, **Wan Mohamad Wan Bebakar, Department of Chemical Pathology, *Department of Community Medicine, **Department of Medicine,
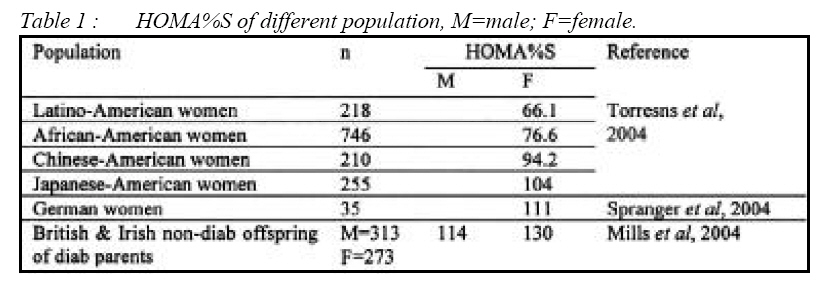
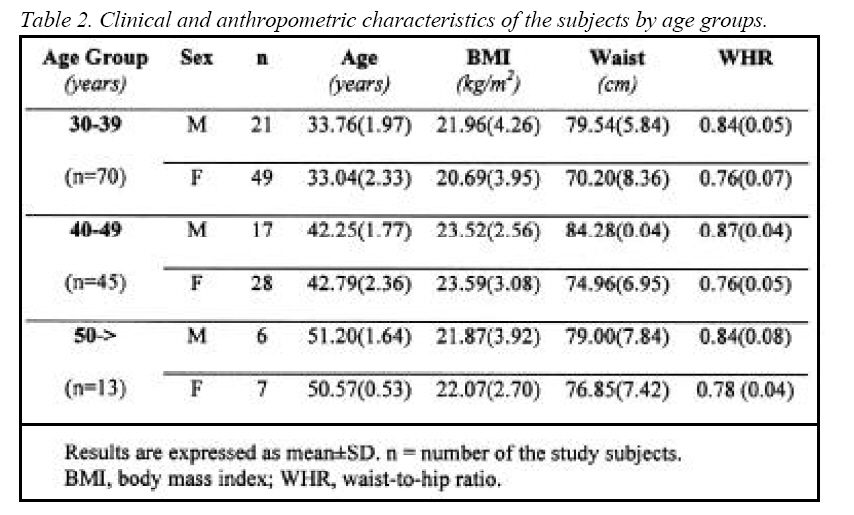
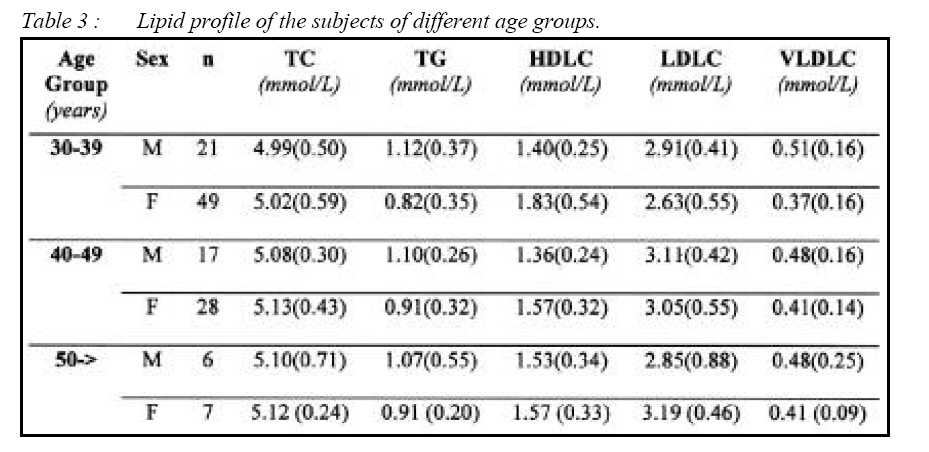
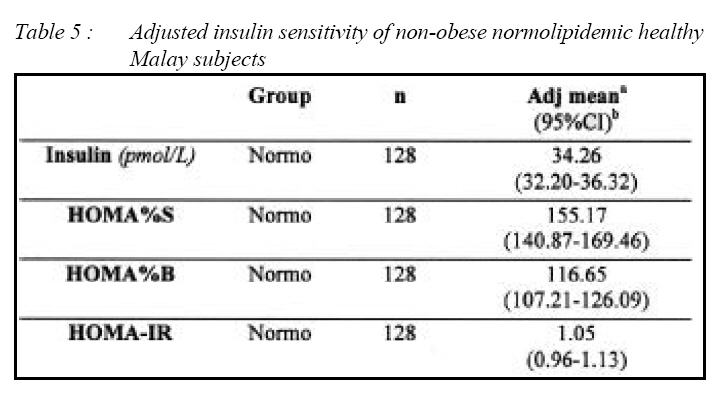
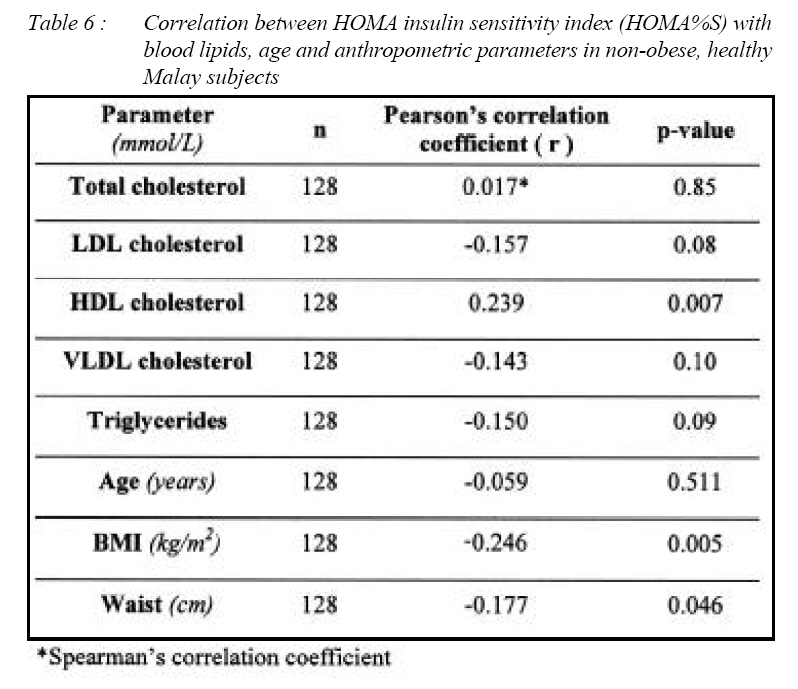
School of Medical Sciences, Universiti Sains Malaysia 16150 Kubang Kerian, Kelantan, Malaysia Submitted-10.10.2004, Accepted-24.11.2005 Code Number: mj06021 Insulin insensitivity is a common finding in several metabolic disorders including glucose intolerance, dyslipidemia, hyperuricemia and hypertension. Most of the previous studies on insulin sensitivity were performed on diabetic or obese population. So our knowledge about insulin sensitivity of healthy population remains limited. Rising prevalence of obesity, diabetes and metabolic syndrome is a serious issue in Malaysia and some other rapidly developing countries. So it is important to look at the insulin sensitivity status of healthy Malaysian subjects and to compare it in future with those of diabetic, obese or metabolic syndrome patients. In this study we sampled subjects who were independent of confounding factors such as obesity (including abdominal obesity), hypertension and glucose intolerance (diabetes, IGT or IFG) which may influence insulin sensitivity. Fasting plasma glucose, fasting insulin and lipid profile were determined. Insulin sensitivity and secretory status were calculated using the homeostasis model assessment (HOMA) software (HOMA%S, HOMA%B and HOMA-IR). The insulin sensitivity (HOMA%S) of healthy Malay subjects aged between 30-60 years was 155.17%, HOMA-IR was 1.05 and HOMA%B was 116.65% (values adjusted for age, sex, BMI and waist circumference). It was seen that non-obese Malaysians can prevent age related lowering of insulin sensitivity if they can retain their BMI within limit. Key words : insulin sensitivity, homeostasis model assessment Introduction Insulin sensitivity refers to the sensitivity of the peripheral tissues to the actions of insulin. Though originally it was discussed in relation to the pathogenesis of type 2 diabetes but now it is evident that insulin resistance is involved with many metabolic and vascular abnormalities (1-4). Most of the studies on insulin sensitivity were performed on diabetic populations. The studies in which nondiabetic people were involved were also performed on obese or overweight subjects. Hence our knowledge about insulin sensitivity of healthy population still remains limited. The global epidemic of type 2 diabetes, obesity and metabolic syndrome makes it necessary to identify even modest change of insulin sensitivity so that treatment can be started early to prevent the onset of metabolic disorders in Malaysia due to the rapid change in lifestyle (5, 6). However, there is still lack of data on the normal range of insulin sensitivities among Malay subjects. Therefore, it is important to look at the insulin sensitivity status of healthy Malay subjects and to compare it in future with those of diabetic, obese or metabolic syndrome patients. In this study we were able to recruit a group of healthy Malay subjects free from any known variables influencing insulin sensitivity andmeasured their insulin sensitivity. Methodology Study design This cross-sectional study was conducted from mid September 2003 to March 2005. Research volunteers were recruited from 7 schools and 2 public offices in Kota Bharu, the capital city of the state of Kelantan in northeastern peninsular West Malaysia. We circulated an open notice to all staff members from the various institutions to invite them to our screening program. Inclusion criteria were age between 30 to 60 years, non-obese with a BMI <25kg/m2, waist circumference of whom male <102cm & female <88cm, non-diabetic, non-hypertensive, those without family history of type 2 diabetes, normolipidemic and is a non-smoker (7). Subjects suffering from chronic illness, ketosis, chronic liver and renal diseases, pregnant women, first degree relatives of type 2 diabetic subjects were excluded from the study. Subjects taking anti-hypertensive drugs, steroids or hormonal products were also excluded (2). Recruitment of subjects: collection of blood specimenThe subjects were screened according to the selection criteria. Their anthropometric measurements (height, weight, waist circumference, BMI) and clinical history were recorded. Those who met the selection criteria were invited to the Department of Chemical Pathology in USM after an overnight fast (10-12 h) for oral glucose tolerance test (OGTT), liver function test (LFT), renal function test (RFT) followed by lipid levels and insulin sensitivity test in two separate visits. Body weight (in kilogram) was measured in patients wearing light clothing. Height in centimeter (cm) was measured using Standard ZT-120®, (Healthometer Inc., USA) while standing on bare feet. Body mass index (BMI in kg/m2) of the subjects was calculated as weight in kilogram divided by height in square meter. Waist circumference (in cm) was taken at the level of umbilicus (8). Hip circumference was measured at the maximal extension of the buttocks (9). Waist-to-hip ratio (WHR) was calculated as the ratio of waist circumference to hip circumference. Pulse and blood pressure of every subject were measured by the same physician. At least two readings of blood pressure were taken at 5 minutes interval on the right arm using a mercury sphygmomanometer (Baumanometer®, W.A. Baum Co, Inc., New York, USA) in the sitting position and the mean value was noted. A person was identified as hypertensive if he/she either had a systolic blood pressure at or above 140 mmHg (≥140 mmHg) and/or diastolic blood pressure at or above 90 mmHg (≥90 mmHg) (10). Blood specimens for LFT, RFT and lipids were collected in 5ml Vacutainer® tubes with SST® Gel and clot activator, for insulin in 5ml plain Vacutainer® tubes, and for glucose in 2ml fluoride oxalate tubes (NAF OXALATE 2®). All tubes were purchased from Becton Dickinson VACUTAINER Systems 15336 (FD), Farklin Lakes, NJ, USA. OGTT was performed using 75gm of anhydrous glucose made up to 250ml of solution with plain water. Diabetes and IGT were defined according to the criteria set by the WHO Expert Committee (11). Plasma glucose and lipid levels were performed on the same day of collection. Serum for insulin was frozen immediately at -80°C and was assayed within three months of specimen collection. Analytical methodsLaboratory investigations were performed in the Department of Chemical Pathology Routine Laboratory and Department of Medicine Endocrine Laboratory. Both laboratories are ISO-9001 certified. Plasma glucose was estimated using the glucose oxidase (GOD-PAD) method (ROCHE® catalog no: 2172682) on a Cobas Integra 400® automated chemistry analyzer. Serum total cholesterol (TC), HDL cholesterol (HDL-C) and triglyceride (TG) were measured by automated fully enzymatic colorimetric method using commercial kits (ROCHE®) using Cobas Integra 400® automated chemistry analyzer. The LDL cholesterol (LDL-C) level in serum was calculated by using the Friedewald formula (12). Serum insulin was measured by chemiluminescence method using commercial IMMULITE reagent (catalog no. LK1N1, Diagnostics Products Corporation EURO/DPC, United Kingdom) using IMMULITE® analyzer. Homeostasis Model Assessment (HOMA)Insulin sensitivity and insulin secretory status (or capacity) was calculated using the homeostasis model assessment (HOMA) software (HOMA%S, HOMA%B and HOMA-IR). The values for fasting insulin (in pmol/L) and fasting plasma glucose (in mmol/L) were inserted in the software (13-16). In order to compare the results of this study with those of previous studies, HOMA for insulin resistance (HOMA-IR) was also calculated by manual calculation using the formula: HOMA-IR = (fasting insulin in _IU/ml X fasting glucose)/22.5. In homeostasis model assessment (HOMA) insulin sensitivity is expressed as HOMA%S, the higher the value the higher the insulin sensitivity of the subject. Insulin resistance is expressed as HOMA-IR, the higher the value the more the insulin resistance. Beta-cell secretory capacity is expressed as HOMA%B, the higher the value the more the beta-cells have to secrete insulin to handle existing blood glucose level. Statistical analysesStatistical analyses were performed using the SPSS version 11.0 package for Windows (17). Insulin sensitivity of the different groups was expressed as mean±SE, or median and interquartile range (IQR) according to the pattern of distribution of data. Pearson's/Spearman's correlation test was done to ascertain the relationship between insulin sensitivity and age, BMI, and lipid status. To obtain age, sex, BMI waist circumference adjusted insulin sensitivity and secretory status of healthy Malaysians we performed general linear model (GLM) analysis. Ethical approvalThe study was approved by the Research and Ethics Committee, School of Medical Sciences, Universiti Sains Malaysia. A written informed consent was taken from every participant of the study. ResultsCharacteristics of study subjects Altogether 561 subjects participated in the screening program. Of them 246 fulfilled the inclusion criteria and only 128 were normolipidemic. Among the normolipidemic 44 were males and 84 were females, 70 subjects were 30-39 years of age, 45 between 40-49 years and 13 were more than 50 years old (Table 1). All the study subjects were non-obese (BMI<25 kg/m2), their waist circumference was also within the limit so that they were free from abdominal obesity (Table 2). All the study subjects were normolipidemic (Table 3). Fasting glycemia and insulin sensitivity status of different age groupsInsulin sensitivity HOMA%S of male study subjects was 139.90 (age 30-39), 152.85 (age 40-49), 163.50 (age 50 years and above), whereas for female subjects of the same age groups the values were 151.30, 142.20 and 159.00 respectively. Insulin secretory capacity, as expressed by HOMA%B of these subjects of different age groups were 105.30, 95.30, 72.60 for male and 106.50, 114.00, 81.30 for female respectively (Table 4). Relative insulin resistance HOMA-IR of different age groups of male and females were 1.19, 1.07, 1.07 and 0.99, 1.11, 0.89 respectively. After taking into consideration the age, sex, BMI, waist circumference the adjusted HOMA%S was 155.17%, HOMA%B was 116.65% and HOMA-IR was 1.05 (Table 5) Correlation between insulin sensitivity with different lipids in normolipidemic subjectsStatistical correlation tests were performed between insulin sensitivity with triglycerides, HDL cholesterol, LDL cholesterol, VLDL cholesterol and total cholesterol. Only HDL cholesterol showed significant positive correlation with insulin sensitivity (HOMA%S) (r = 0.239, p = 0.007) (Table 6). Correlation between insulin secretory capacities with different lipids in normolipidemic subjectsStatistical correlation tests were performed between insulin secretory status (HOMA%B) with total cholesterol, LDL cholesterol, VLDL cholesterol, HDL cholesterol and triglycerides. Insulin secretory status showed positive correlation with VLDL cholesterol (r = 0.287, p = 0.001) and triglycerides (r = 0.298, p = 0.001) (Table 6). Correlation between insulin sensitivity (HOMA%S) with age and anthropometric parametersThere was a significantly negative correlation between insulin sensitivity with BMI (r=-0.246 p=0.005) in non-obese normolipidemic subjects but correlation with waist circumference and age was poor or insignificant. There was no significant correlation between HOMA%B with age, BMI and waist circumference in healthy subjects (Table 6). DiscussionInsulin sensitivity and insulin resistance In a study on insulin sensitivity among Malay subjects in Singapore (18) between the ages of 18 to 69 years (254 males, 254 females) which included obese and hypertensive subjects too, the mean HOMA-IR was 1.48 for males and 1.63 for females. The normal HOMA-IR for the Malay population was up to 1.45 (personal communication with Dr. SuChi Lim). Torrens et al (2004) reported the HOMA%S of American women of different ethnic origin between the age of 42-52 years. In their study, the HOMA%S of Latino American women was 66.1 (n=218, mean BMI 28.7 kg/m2), 76.6 in African American women (n=746, mean BMI =30.8 kg/m2), 94.2 in Chinese American women (n=210, mean BMI 23.1 kg/m2) and 104.1 in Japanese American women (n=255, mean BMI 22.8 kg/m2) (19). Another study involving 35 healthy German women (mean age 30.4, mean BMI 25 kg/m2) obtained mean HOMA%S of 111 (20). Mills et al (2004) studied HOMA%S of 586 British and Irish non-diabetic offspring's of diabetic parents. Their HOMA%S was 130.00 for females (n=313, mean BMI 28.08 kg/ m2) and 114.39 for males (n=273, mean BMI 27.36 kg/m2) (21). Though the data of different populations shown in the table have different BMI still it shows an ethnic and geographical variation of insulin sensitivities among different ethnic populations. All previous reported studies involved heterogeneous populations. Thus, the HOMA%S and HOMA-IR values of the normolipidemic subjects of this study can perhaps be regarded as the normal insulin sensitivity level of the Malay population of Kelantan. Correlation between insulin sensitivity and blood lipids in healthy subjectsHDL cholesterol showed significant positive correlation with insulin sensitivity (HOMA%S) (r=0.239, p=0.007). Correlation between insulin sensitivity with other lipid parameters was insignificant. Tai et al, (2000) found significant correlation with triglycerides, but their population included obese subjects (18). Insulin sensitivity in our non-obese normolipidemic population is influenced by HDL cholesterol alone and not by other lipids. On the other hand, insulin secretory status showed positive correlation with VLDL cholesterol (r=0.287, p=0.001) and triglycerides (r=0.298, p=0.001) but not with HDL cholesterol, whereas Tai et al (2000) found no correlation between these in normoglycemic subjects. We also found significant negative correlation between insulin sensitivity and BMI in non-obese normolipidemic subjects but correlation with waist circumference and age was not significant. These findings are consistent with previous studies (2, 22-24) Correlation between insulin sensitivity and age in healthy subjectsStudies have shown that insulin resistance increases with age (25-28). However this study shows the opposite, higher insulin resistance in normolipidemic males aged 30-39 years (HOMA-IR 1.19) and less in the 40-50 years age group (HOMA-IR 1.07), and 50 years and above group (HOMA-IR 1.07). It is also noted that the normolipidemic subjects of age group 50 years and above have lower BMI than those of 30-39 years age group and their waist circumference was also lower. This may explain the lower value of HOMA-IR in age group 50 years and above. Perhaps the elderly can retain their insulin sensitivity if they maintain their BMI (i.e. within 23 or 25) and lipid levels within limits. Recently Ministry of Health Malaysia in its latest clinical practice guidelines for the treatment of obesity reduced BMI to 23 from previous 25 as a cut off point for obesity and it also gave a lower cut off point for waist circumference. Insulin secretory capacity of non-obese healthy subjectsThe insulin secretory capacity (expressed as HOMA%B) in normolipidemic Malay male subjects of the three age groups decreased with age and were 105.30, 95.93, and 72.60 respectively. The HOMA%B of normolipidemic Malay female subjects of different age groups was 106.50, 114, and 81.30 respectively. In male normolipidemic subjects, mean fasting insulin and HOMA%B were higher in the 30-39 years age group than in the age groups 40-49 years and 50 years and above. ConclusionIn healthy Malay subjects (strictly defined by our selection and inclusion criteria) insulin sensitivity correlated with HDL cholesterol and BMI. Despite aging, normolipidemic subjects can retain their insulin sensitivity within normal limits if they maintain their BMI and blood lipids within safe range. LimitationsThe sample we obtained represented population discrimination, by having a greater number of subjects in age group 30-39 years, and a lesser number in age group 50 years and above. The cause behind this was that a big number of the higher age group was rejected during screening mainly due to their higher BMI. To overcome these problem future researchers can take a bigger sampling population from age group 50 years and above. The values for BMI and waist circumference used were meant for Caucasians and not Asians. Normolipidemia was a criterion according to the NCEP ATP III (2001). Should this criterion be amended in the future, then this may have some bearing on the selection criteria and study conclusions. AcknowledgementsThe software for calculation of insulin sensitivity and beta-cell secretory status was obtained by personal communication from Dr. Jonathan Levy of Diabetes Research Lab, United Kingdom. We are thankful to Dr. CE Tan, Dr. SuChi Lim and Dr. E Shiong Tai of Singapore for their intellectual input during the preparation of the study design. This research was financially supported by Universiti Sains Malaysia (Grant Number 304/ PPSP/6131320). References
© Copyright 2006 - Malaysian Journal of Medical Science The following images related to this document are available:Photo images[mj06021t3.jpg] [mj06021t7.jpg] [mj06021t6.jpg] [mj06021t5.jpg] [mj06021t2.jpg] [mj06021t1.jpg] [mj06021t4.jpg] |
| |||||||||
