 |
| About Bioline | All Journals | Testimonials | Membership | News |
|
||||||
|
||||||
Malaysian Journal of Medical Sciences, Vol. 15, No. 1, Jan 2008, pp. 37-41 ORIGINAL ARTICLE An Approach for Assessment of Tumor Volume from Mammography in Locally Advanced Breast Cancer Gupreet Singh Medical Physics Unit, Department of Radiodiagnosis,
Institute Rotary Cancer Hospital, All India Institute of Medical Sciences,
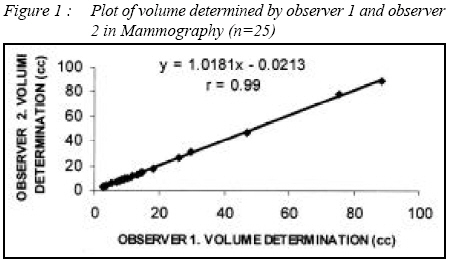
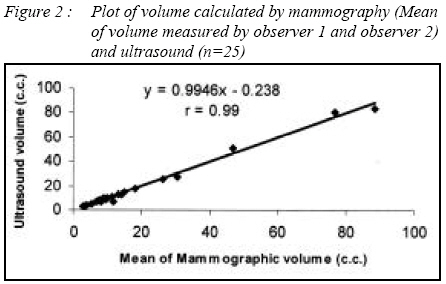
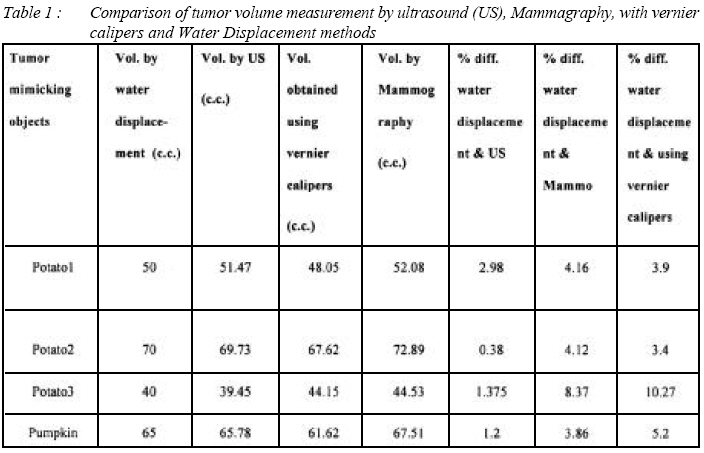
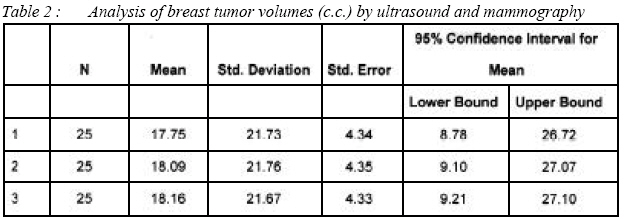
New Delhi-110029, India. Submitted-20-02-2007, Accepted-03-12-07 Code Number: mj08006 Tumor size is an important independent indicator in patients with carcinoma of the breast. Repeated size measurements during primary systemic therapy produce detailed information about response that could be used to select the most effective treatment regimen and to estimate the patient’s prognosis. Measurement of tumor burden with ultrasonography and computed tomography is being used with increasing frequency to assess the effectiveness of cytotoxic anticancer drugs. Standardization of assessment and results reporting are important steps that aim at increasing the amount of usable therapeutic information at the physician’s disposal. The purpose of our study is to calculate the tumor volume by mammography after demagnification and compare the tumor volume measured from this method with ultrasonography volumes. Key words : Mammography, tumor volume, magnification, locally advanced breast cancer, prognosis. Introduction Breast cancer is reported to be commonest cancer with an annual age adjusted incidence rate of 22-28 per 100,000 women per year in urban areas and 6 per 100,000 women per year in rural areas. Over 75,000 new cases of breast cancer are reported to occur in India per year. Majority of breast cancers in India (50-70%) present with locally advanced disease. In the coming year at current growth it will surpass the cervix cancer [1]. Currently neoadjuvant chemotherapy is a common approach which gives an opportunity to asses the tumor response where the benefits are mostly concentrated in a small number of patients who achieved optimal tumor burden reduction. A change in organ size is a predominant feature of a disease process or a manifestation of pathology elsewhere. Various radiological and clinical techniques have been attempted in the past to estimate tumor or organ volumes, but have been of limited utility due to unacceptable accuracy, poor reproducibility or difficulty in obtaining suitable images for volume measurements [2]-[4]. Quantification of tumor burden with ultrasonography and computed tomography is being used with increasing frequency to assess the effectiveness of cytotoxic anticancer drugs. Standardization of assessment and results reporting is an important step that aims at increasing the amount of usable therapeutic information at the disposal of the physician. Therefore it is necessary to develop a ‘common language’ to describe the results of cancer treatment and to agree upon internationally acceptable general principles for reporting and assessing data [5]-[7]. Since 1979, World Health Organization (WHO) used the radiological tumor response evaluation criteria. Whereby, the tumor is measured in two dimensions its maximum diameter (width) in the translation plane and its largest perpendicular diameter on same image (thickness) [8]. The purpose of our study is to potentially calculate the tumor volume by mammography after demagnifying the images and compare the tumor volume measured from this method with ultrasonography volumes. Measuring a mass is a tedious task for most radiologists. For the three dimensional measurement approaches, the criteria for partial treatment response is defined as greater than 65% reduction in tumor volume, stable disease being the size between that for partial response and that for progressive disease and disease progression is greater than 44% increase in volume [8]. The criterion for complete response was total tumor disappearance. Tumor size is an important independent indicator of prognosis in the patients with carcinoma of breast. Repeated size measurements during primary systemic therapy produce detailed information about response that can be used to select the most effective treatment regimen and to better estimate patient’s prognosis. Materials and Methods The oncology data base was reviewed for all female patients with biopsy proven breast carcinomas that were treated with standard chemotherapeutic protocols. Inclusion criteria required that the mass lesion should be clearly visible with that of mammography and on ultrasound. Delineation of tumor sizes from the mammograms as well as from the ultrasound was performed by senior radiologists. Tumors ranged from the clearly marginated to poorly marginated. Those that were judged by senior radiologists as not being measurable lesions were not included in the study. The sizes were measured with mammography and ultrasound. Tumor volumes were calculated using the formula of an ellipsoid. In mammography two views were used to measure tumor diameter which were in the craniocaudal view and the mediolateral view. In ultrasonography a 5 MHz linear array probe was used. The transducer was placed in transverse direction on the breast tumor, the width and depth are measured and then the transducer was placed in longitudinal direction which gives the another dimension of the breast tumor. The three greatest dimensions (referred to as a, b and c) were then used to calculate several estimates of tumor volume using the equations for the volume of a sphere ([4π/3]r3), Here r is average of a, b and c the volume of an ellipsoid V= (abcπ)/6. Where a and b are the maximum dimensions of tumor in cm from the craniocaudal view as well as mediolateral view respectively and c was maximum dimension measured from the mediolateral view. Spherical volume calculations were based on the average radius across all three axes. The comparisons were done among the volumes measured by mammography and ultrasound. The percentage variations between the two modalities were calculated. Demagnifying volume was obtained by dividing each dimension of mammography image by magnification factor. The volume measurement method by vernier calipers, ultrasound (US) and mammography method calibrated using tumor mimicking substances (like Potato, Pumpkin). These objects dipped in water were subjected to volume estimation by the above methods. Standard was taken as volume estimated by water displacement method. Result Figure 1 show the tumor volume determined by observer 1 plotted against the volume measured by observer 2. Regressing on linear scale shows the high correlation (r = 0.99) with the slope of 1.018. Figure 2 shows the tumor volume calculated by mammography (Mean volume measured by observer 1 and observer 2) plotted against the volume determined by ultrasonography. In this plot there is high correlation of tumor volumes (r = 0.99) and slope of 0.99. Estimates based on volume equations of an ellipse, a sphere of mammography differed from the ultrasound volume by a mean of -33.58% (95% confidence interval (CI) from -22.78 to 22.11), 40.68% (95% CI from -22.85 to 22.04) respectively. Discussion Pharmaceutical companies have developed an approval process for anticancer drugs on the basis of tumor shrinkage. Volumetric measurements would overcome difficulty estimating the size of lesions that are irregular in shapes and sizes. The tumor volumes measured in breast cancer cases by US may be taken as standard since calibration experiment (Table 1 ) showed that US is very accurate in measuring the volume of an irregular shaped subject (less than 3% error). The percentage difference between ultrasound and mammography volumes decreases after demagnification as shown in Table 2 . So mammography can also be used for accurate measurement of the volume and can help the radiologists screen the breast cancer patients used with volume. The maximum tumor volume was 88.71 cm3 and minimum tumor volume was 2.84 cm3. According to response evaluation criteria in breast tumors 4% patients shows the complete response, 25% shows the partial response, 63 % patients the stable disease and 8% shows the disease progression after chemotherapy in the present study. Volumetric measurement can help significantly for evaluating therapeutic response compared to unidimensional and bidimensional measurements. The ability to accurately calculate the in vivo volume of tumors also has clinical potential especially in oncology. Tumor volumes could be used to assess the progression of disease and success of therapy, such as response to irradiation or chemotherapy. Tumor volume using ellipsoid formula is preferred over other cubical and spherical methods. As most of the tumors are of irregular shapes so spherical formulae are not used and the cubical formulae overestimate the volume. For treatment evaluation stress is on reproducibility and accuracy of serial measurements. The rule for obtaining bidimensional measurement of a tumor is to find its longest diameter (length) and the dimension which is perpendicular to length. This method provides a fixed set of values that are not altered so producing reproducibility as right angle law is followed. Here is the first study to calculate the tumor volume using mammograms. However, manual measurement of tumor volume is time consuming and estimates based on simple geometric shapes are inaccurate. The errors, whenever they occur, are due to error in marking the tumor on the mammography film, which become significant in case of speculated, vague and diffused tumor mass instead of solid and well defined one. In routine reporting of regression or progression of tumor from the imaging film radiologists either use scale or try to infer the tumor size by visual assessment of the irregular tumor part appearing in the images. In such a situation a change of tumor sizes up to 20% may allude by visual perception [9-11]. A careful statistical analysis of the measurements of 16 experienced oncologists showed the false positive response rate in unchanged masses as measured by same investigator at 25% when 25% regression criteria (product of two diameters) was employed [12]. Even volumes by diameters measurement by calipers are reported to have large errors and measured the three mutually perpendicular diameters in mouse tumors by calipers and calculated tumor volume by the product of these diameters [13]. Tumors were excised and volumes were measured by Archimedes’s principle. Their correlation showed an error of 50% on mean diameter measurement at a given volume. Area (product of two perpendicular diameters), volume and diameter of tumor mass are frequently used in practice to indicate the size, growth or regression. CONCLUSION Tumor volume is a more representative quantity of three dimensional tumor mass which is generally of irregular shape and size. Thus, it is desirable to use mammography based tumor volume as response indicator which is not only accurate but better representative of tumor mass. This approach of assessment of tumor volume can be used for development of mammography computed tomography 3-D scans. References
© Copyright 2008 - Malaysian Journal of Medical Science The following images related to this document are available:Photo images[mj08006t2.jpg] [mj08006f2.jpg] [mj08006t1.jpg] [mj08006f1.jpg] |
| |||||||||