 |
| About Bioline | All Journals | Testimonials | Membership | News |
|
||||||
|
||||||
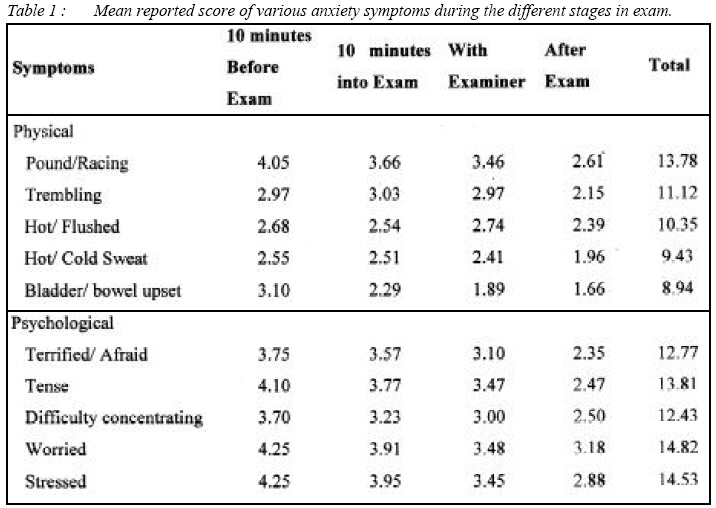
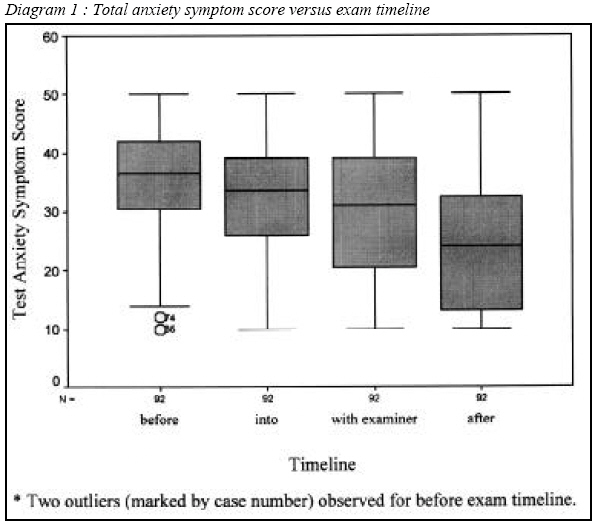
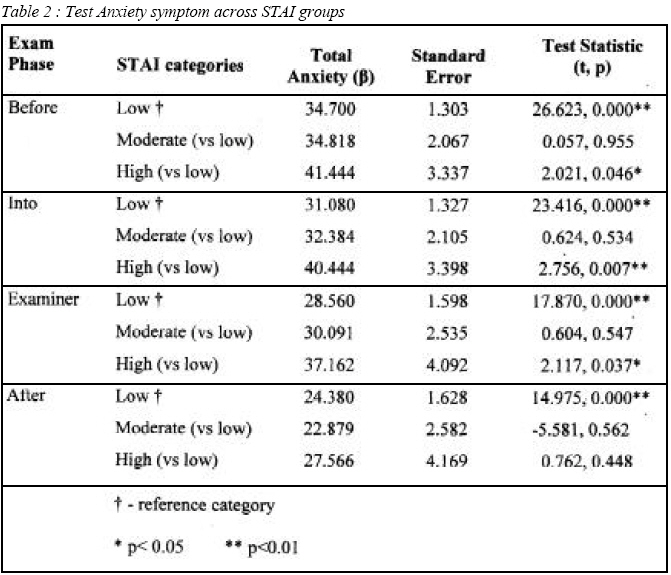
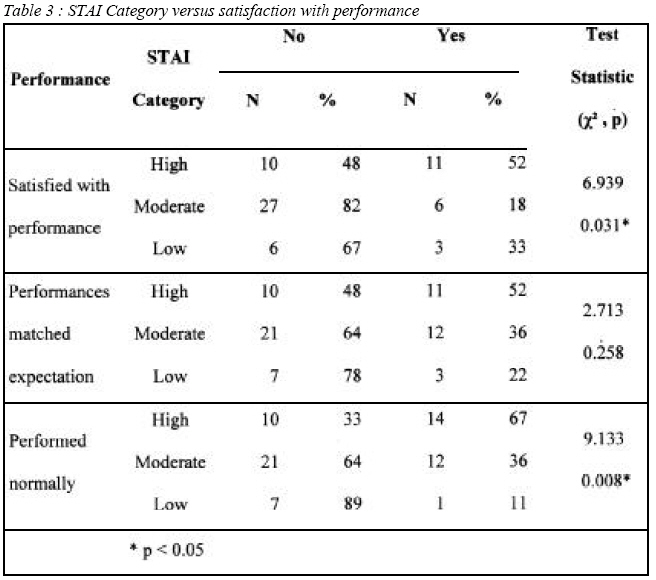
Malaysian Journal of Medical Sciences, Vol. 15, No. 2, April 2008, pp. 18-23 ORIGINAL ARTICLE Test Anxiety: State, Trait and Relationship with Exam Satisfaction Loh Tze Ping, Kavitha Subramaniam, Saroja Krishnaswamy Penang Medical College, No4, Jalan Sepoy Lines, 10450 Penang, Malaysia. Submitted-28-10-2007, Accepted-24-02-08 Code Number: mj08013 Test anxiety is defined as the reaction to stimuli that is associated with an individual’s experience of testing or evaluating situations. This study aims to examine the fluctuation pattern of anxiety symptoms during a clinical examination and its relationship with underlying anxiety traits. Fourth year medical students of Penang Medical College undertaking the Ophthalmology clinical examination participated in this study. First phase of the survey, on anxiety symptoms was conducted immediately after the Ophthalmology clinical examination while the second phase, on pre-existing anxiety traits was conducted six weeks later with the aid of STAI instrument. Responses for both stages were combined and analyzed. Sixty-three of 122 students responded to both phases of the study, giving a response rate of 52%. All symptoms except trembling peaked 10 minutes before the exam begun showing a downward progression with no resurgence thereafter. Students with pre-existing anxiety traits had high anxiety scores 10 minutes into the examination and while with the examiners. Anticipatory anxiety is a source of concern and can effect performance and appropriate steps should be taken to help the students with this. A few other studies should be done to conclude. Key words : Test Anxiety, trait, examination, satisfaction Introduction Test anxiety is defined as the reaction to stimuli that is associated with an individual’s experience of testing or evaluating situations (1). Test anxiety can be divided into two components: the trait and state (1, 2). While test anxiety trait is a fairly stable attribute, test anxiety state tends to be volatile over time (3, 4). Past studies have largely focused on the causes, effects and factors associated with test anxiety trait (5-9). Little is known about how the experience of anxiety symptoms may fluctuate during an examination. This study was carried out to examine the pattern of anxiety symptoms during a clinical examination and its relationship with test anxiety traits among medical students who were undertaking their Ophthalmology clinical examination at Penang Medical College. The student’s satisfactions with their examination performance and areas of perceived under-performance with contributing factors were also evaluated. Methodology Background The Ophthalmology clinical examination is part of the assessment of the Ophthalmology in the forth year medical course. Exam candidates are allowed forty minutes of unsupervised history taking and physical examination time with the patient. At the end of the forty minutes, the student will be assessed by two examiners on their history, physical examination and will participate in a case discussion for twenty minutes. Sampling and Selection of Participants All fourth year medical students of Penang Medical College who were undertaking the Ophthalmology clinical examination were invited to participate in this study. Students were recruited for the study upon consent. Participants were then given unique identification codes for administrative purposes while maintaining anonymity. Design The participants were assessed using self administered instruments in two phases. First phase of the survey was conducted immediately after the Ophthalmology clinical examination. Second phase was conducted six weeks later. Responses for both stages were combined using the identification codes given. Those who had responded in the first phase but failed to participate in the second were excluded for analyses involving comparison between both stages. Ethical Considerations The study was evaluated and approved by the Joint Penang Independent Ethics Committee (JPEC) for ethical considerations. Instruments First Stage The questionnaire for first stage survey was devised by the investigators for the purpose of this study. The questionnaire contained three parts. First section contained statements regarding physical and psychological symptoms of anxiety. The participants were asked to score on a Likert-type rating whereby a 1 was “I strongly disagree” and a 5 was “I strongly agree”. These symptoms were scored across four examination timelines: “10 minutes before the exam”, “10 minutes into the exam”, “when I’m with the examiner” and “Currently, after the exam”. Second part of the questionnaire assessed their satisfaction with exam performance. Finally, the third part evaluated if the students felt they had underperformed in any of the clinical examination components such as history taking, physical examination, discussion and their contributing factors. Second Stage Spielberger Test Anxiety Inventory-Trait (2) was used for the second stage of the survey. The instrument, which has been previously validated, assessed the test-anxiety trait of a person which consisted of Questionaire I & II (2). Analysis of Data Statistics Package SPSS version 12 was used to analyse the data. Descriptive statistical analyses and linear regression analysis with reference cell method were performed. Results Ninety-two out of 122 or seventy-five percent of the forth year students completed Questionnaire I. Of these, a further sixty-three students (69%) were successfully followed-up with Questionnaire II. This gave an overall response rate of 52%, which was acceptable considering the voluntary nature of this study. In this study, all symptoms except trembling peaked 10 minutes before the exam begun; thereafter, they showed a downward progression as the examination proceeded. Feeling worried, stressed and tensed were most intensely experienced by the students while the opposite is true for feeling hot/flushed and having hot/cold sweats. Feeling hot/ flushed, trembling and having hot/ cold sweats remained relatively stable throughout the examination while the rest of the other symptoms rapidly declined. Details are given in Table I. Overall anxiety scores for each timeline were calculated by adding the scores of individual symptoms. Fluctuation of the overall anxiety scores at different timeline is shown in Diagram 1. Assessment of exam satisfaction showed that immediately after the exam, 7 out of 10 respondents were not satisfied with their performance while only a third had thought their performance matched their expectation. When asked if “this was my usual performance”, only two fifths of the students responded with yes. A large majority of the students, 93% (n=86) stated that they have under performed in at least one of the sections of the examination. The highest rate of under performance was noted for discussion component (77%, n=66). This was followed by history taking with 74% (n=64) and physical examination (65%, n=56). “Nervousness” was the most often cited reason for underperformance, followed by time constraints and lastly lack of knowledge. However, for the discussion component, two fifths thought their underperformance was attributable to the lack of knowledge. Other reasons given included patient factor (e.g. uncooperative, language barrier), lack of practice, feeling stressed and lack of confidence. The students’ Spielberger Test Anxiety Inventory-Trait (STAI) scores were categorized into low (20 to 40), moderate (41 to 50) and high (51 to 80). Generally, most students had moderate to low STAI scores. Twenty-one (33%) students fell into the low STAI category while thirty-three (52%) had moderate scores and nine (14%) were in the high category. Linear regression analysis using reference cell methods was carried out to study association between STAI scores and test anxiety symptoms across different stages of the clinical examination. Low category for STAI score was used as the reference and additional impact to the total anxiety scores due to belonging to the moderate and high categories were studied. The outcome of the regression analysis is shown in Table 2. Those in high STAI group had significantly higher anxiety scores compared to those with in low STAI group, at 10 minutes into the examination as well as when the students were with the examiners. Such differences existed between low and high STAI groups only and moderate group did not vary from the reference group. Finally, participants with moderate to low STAI score were less satisfied with their performance while students with high STAI scores were more satisfied with their exam performance. Results are given in Table 3. Discussion This study hopes to shed some light on the less researched area of anxiety symptom patterns during an examination. The students mostly experienced the height of anxiety symptoms during the ten minutes before the exam, which suggested that most were having anticipatory anxiety. Our finding mirrored the study findings of Gottfried Spangler in which heightened anxiety was observed only before an examination as measured by state anxiety and perceived stress.(10) These symptoms quickly tapered down as the students proceeded with their examination. Surprisingly, the students did not report a resurgence of anxiety symptoms even when the examiners were with them. With this finding, the students may be helped by techniques previously suggested by Horne and Matsona whereby modeling and desensitization were found to be most effective in reducing test anxiety.(11) Future studies should evaluate the effectiveness of these techniques in lowering the anticipatory anxiety. An overwhelming majority of respondents in our study perceived that they had under-performed in their examination. As the assessments were made right after the exam, the students may be motivated to under-rate their performance to avoid disappointment when the actual result is known. As nervousness was the most often implicated reason for underperformance, exposing exam relaxation strategies to the student may help them cope better with exam situation. Trait-state relationship has been previously shown to be positively related by Eunsook Hong and Lewis Karstensson in 2002.(12) In our study, students with high STAI-Trait scores had higher anxiety intensity during the clinical examination (10 minutes into the exam and while with examiner) compared to those with low STAI-Trait score. While this echoed the findings of E. Hong et el (12), we found no significant differences in anxiety symptoms reported before or after the exam, which may be attributed to the relatively small sample size of ours. This suggested that people with more pronounced test anxiety trait display higher anxiety symptoms during the exam. Therefore, it may be useful to target those with high-test anxiety trait for intra-exam relaxation technique. In this study, we found that students with high-test anxiety trait score were more likely to be satisfied with their exam performance. This could partly be due to lower self-imposed expectations. Alternatively, the high-test anxiety trait may prompt earlier and better exam preparation. Conclusion Anticipatory anxiety was found to be the most prominent feature of state anxiety. There was a downward progression of anxiety symptoms as the exam proceeded with no resurgence. Students with high-test anxiety trait scores had significantly more anxiety symptoms during the exams in comparison to those with low scores. Anticipatory anxiety did not show any association with anxiety traits. References
© Copyright 2008 - Malaysian Journal of Medical Science The following images related to this document are available:Photo images[mj08013t2.jpg] [mj08013d1.jpg] [mj08013t3.jpg] [mj08013t1.jpg] |
| |||||||||