 |
| About Bioline | All Journals | Testimonials | Membership | News |
|
||||||
|
||||||
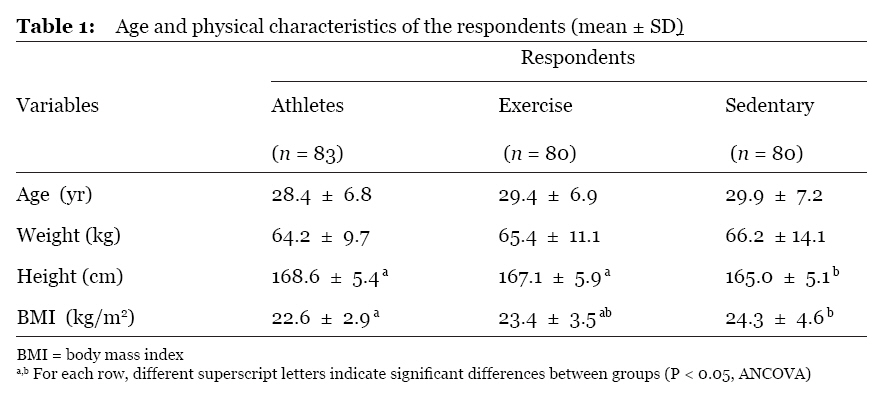
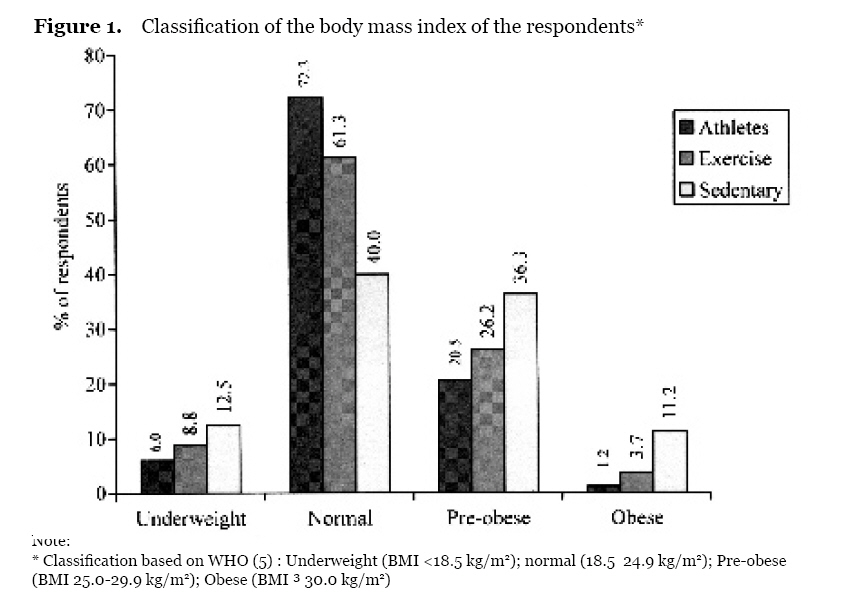
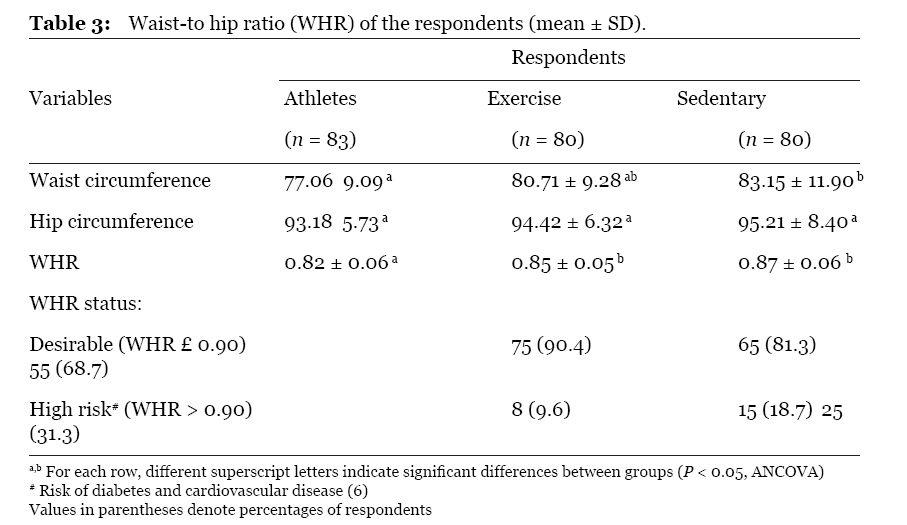
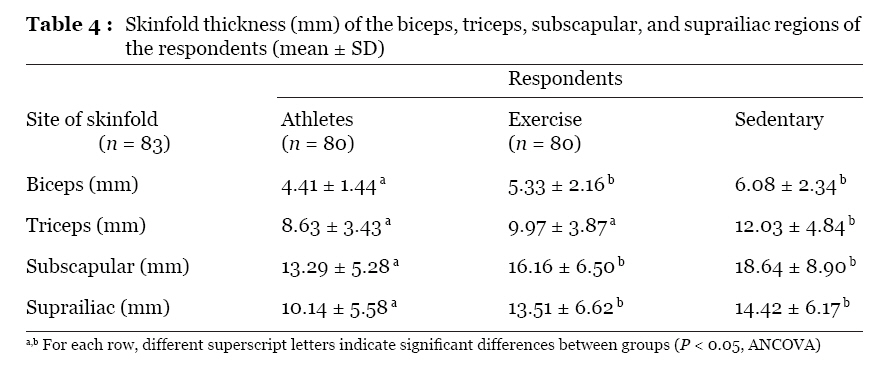
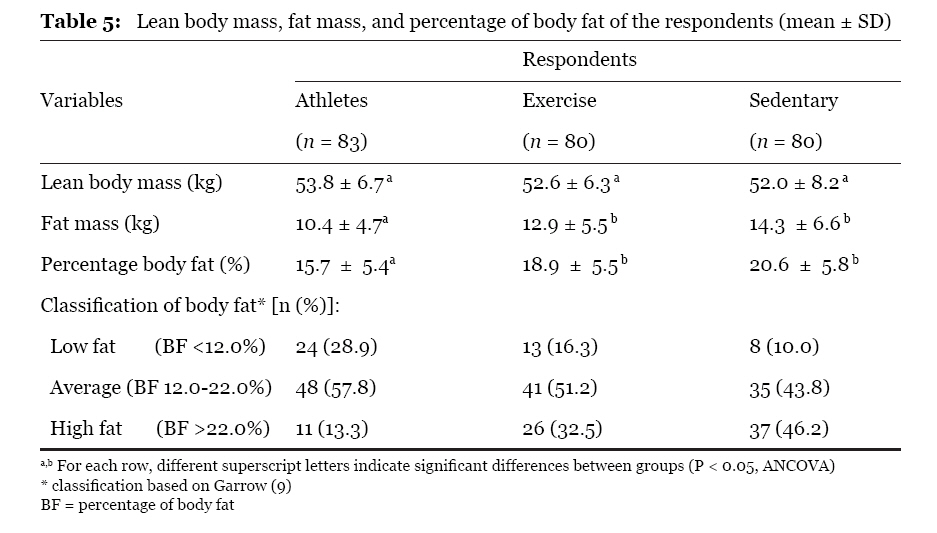
Malaysian Journal of Medical Sciences , Vol. 16, No. 2, April-Jun, 2009 pp. 4-9 ORIGINAL ARTICLE Body Mass Index and Body Fat Status of Men Involved in Sports, Exercise, and Sedentary Activites Wan Nudri Wan Daud1, Wan Abdul Manan Wan Muda2, Mohamed Rusli Abdullah1 1Department of Community Medicine, School of Medical Sciences, Universiti Sains Malaysia, 16150 Kubang Kerian, Kelantan, Malaysia Submitted: 26 Jan 2005 Code Number: mj09013 Abstract A cross-sectional study was carried out in Kota Bharu on three groups of men with ages ranging from 18 to 44 years. The study groups included 83 athletes representing various types of sports and levels of participation (athlete group), 80 active men who exercised a minimum of 30 minutes per day at least 3 times per week (exercise group), and 80 inactive men (sedentary group). The objectives of the study were to compare the body mass indices (BMIs) and body fat statuses among the three groups with different physical activity levels. The height and weight of respondents were measured using the Seca weighing balance with height attachment. Skinfold thickness of biceps, triceps, subscapular regions, and suprailiac regions of each respondent were measured using Harpenden skinfold calipers. Percentage body fat was calculated as the sum of the four measurements of skinfold thickness. The results showed that the mean (± SD) BMIs in the athlete, exercise, and sedentary groups were 22.6 ± 2.9, 23.4 ± 3.5, and 24.3 ± 4.6 kg/m2, respectively. The combined prevalence of pre-obese (BMI 25.029.9) and obese (BMI ³ 30.0) subjects was 21.7% in the athlete group, 29.9% in the exercise group, and 47.5% in the sedentary group. The mean (± SD) percentage of body fat in athletes was 15.7 ± 5.4%, which was lower than in the exercise (18.9 ± 5.5%) and sedentary (20.6 ± 5.8%) groups. The study revealed that individuals who are actively involved in physical activity, particularly in sport activities, have lower BMIs and percentage body fat values compared to sedentary people. Therefore, to prevent obesity, all individuals are encouraged to perform regular physical activity, particularly sports activities. Keywords: body fat, body mass index, obesity, physical activity. Introduction Obesity can be defined as an excessive accumulation of adipose tissue or fat in the body (1). The basic cause of obesity in most people is that they consume more calories than they expend, and the surplus of food energy is converted into body fat (2). Persons with excess body fat have an increased risk of developing a number of chronic diseases, including cardiovascular diseases, diabetes mellitus, gallbladder disease, osteoarthritis, gout, abnormalities of pulmonary function, and cancer (3). Excess body fat also has significant detrimental effects on physical performance (4). Therefore, measurements of the total body fat of individuals provide useful information. Although the benefits of regular physical activity on health status have been widely recognised, nutritional studies among physically active groups in Malaysia are still lacking. The objective of this study is to compare the body mass indices and body fat contents of athletes, individuals with a moderate level of exercise, and sedentary individuals. Materials and Methods This study was carried out among 243 male respondents, aged 18 to 44 years. The respondents studied included 83 sportsmen from eight different types of sports who had participated in various levels of competition (athlete group), 80 active men who had regularly exercised for a minimum of 30 minutes per day at least 3 times per week during the previous 3 months (exercise group), and 80 inactive men who reported no physical exercise during the previous 3 months (sedentary group). The athletes were randomly selected from the Kelantan State Sports Council, and several sports associations in Kota Bharu. They were actively involved in sports training with a minimum of 30 minutes per day at least 3 times per week. The respondents in the exercise and sedentary groups were randomly selected from several government departments in Kota Bharu. None of the respondents had a history of chronic diseases. The height and body weight of the respondents (barefooted and in light clothing) were measured to the nearest 0.5 cm and 0.1 kg, respectively, using a Seca weighing balance with height attachment. The body mass index (BMI) of each respondent was calculated by dividing body weight in kilograms by height in metres squared (kg/m2). Body weight classification of respondents based on BMI was determined as described by WHO (5). Waist and hip circumferences were measured using a non-stretchable tape to the nearest 0.1 mm. Waist circumference was measured at the mid-point between the iliac crest and the lower rib margin, while hip measurement was taken as the maximum circumference around the buttocks posteriorly and pubic symphysis anteriorly. The waist-to-hip ratio (WHR) was calculated for each respondent. A WHR cut-off point of greater than 0.9 as an indication of central obesity was used, as recommended by Bray (6). Skinfold thickness of biceps, triceps, subscapular and suprailiac regions of the respondents were measured using Harpenden Calipers (British Indicators, UK), as recommended by Durnin and Rahaman (7). All the measurements were taken on the left side of the body. Fat content as a percentage of body weight was calculated from the sum of the 4 measurements of skinfold thickness (8). The body fat classification of the respondents was determined as describe by Garrow (9). Lean body mass (LBM) and fat mass (FM) were also calculated for each respondent. Statistical analysis was done using SPSS version 9.0. Analysis of Covariance (ANCOVA) was used to determine differences in mean values between all groups. All values are expressed as mean ± SD. This study was approved by the Research and Ethics Committee, Universiti Sains Malaysia (USM). Results Table 1 shows the mean age and physical characteristics of the respondents. The mean age and body weight were not significantly different between the three respondent groups. The athlete and the exercise groups were significantly taller than the sedentary group. The mean BMIs for the athlete, exercise and sedentary groups were 22.6 ± 2.9 kg/m2, 23.4 ± 3.5 kg/m2 and 24.3 ± 4.6 kg/m2, respectively. The mean BMI was not significantly different between athletes and exercise groups. However, both of the active groups had significantly lower BMIs compared to the sedentary group. The BMI classification according to WHO (5) is shown in Figure 1. The combined prevalence of pre-obese (BMI 25.029.9 kg/m2) and obese (BMI 30.0 kg/m2) individuals was 21.7% in the athlete group, which was lower than in the exercise group (29.9%) and the sedentary group (47.5%). The mean waist-to-hip ratios (WHRs) among the respondents are shown in Table 3. The athletes had significantly lower mean WHR compared to others. Incidence of WHR above 0.9 (indicative of central obesity) was 9.6% in athletes, which was lower than in the exercise (18.7%) and sedentary (31.3%) groups. The mean skinfold thickness of biceps, triceps, subscapular, and suprailiac regions of the respondents are presented in Table 4.. The athlete group had the lowest mean skinfold thickness compared to the other groups. Thus, the athlete group had the lowest mean fat mass and percentage body fat as compared to the others (Table 5). The mean percentage body fats of the athlete, exercise and sedentary groups were 15.7 ± 5.4%, 18.9 ± 5.5% and 20.6 ± 5.8%, respectively. The incidence of “high fat” among the respondents in this study was determined according to Garrow (9) (percentage body fat more than 22.0%). The incidence was lowest in the athletes (13.3%), compared to almost half (46.2%) of the sedentary group and 32.5% of the exercise group. The mean LBM was not significantly different between the three groups (Table 5). Discussion The results of this study showed that the athlete group had the lowest mean BMI and percentage body fat compared to the exercise and sedentary groups. The exercise group also had a lower mean BMI compared to the sedentary group. The results can be explained by the difference in physical activity level among the groups. We found that on training days, the mean time spent by the athlete group for physical exercise or sports training was 124 minutes per day, while for the exercise group it was 67 minutes per day. The results are similar to other studies, which have reported that higher activity levels are associated with lower BMI and total body fat (10,11). The combined prevalence of pre-obese (BMI 25.029.9 kg/m2) and obese (BMI ³ 30.0 kg/m2) individuals in the study groups was the lowest in athletes (21.7%) compared to the other groups. The combined prevalence of pre-obese and obese among the athlete group in this study was also lower than the reported figures of 24% of the general male population in a rural area in Malaysia (12), and 29.5 to 45.0% of the general population in urban areas in Malaysia (1316). However, the combined prevalence of pre-obese and obese individuals in the athlete group was higher compared to the 12% of 84 male national athletes reported by Wan Nudri et al. (17). Yet, it is interesting to note that the mean BMI of the athlete group in this study (22.6 ± 2.9 kg/m2) was similar to that of the national athletes (22.9 3.5 kg/m2) reported earlier (17). Based on BMI, the prevalence of pre-obese and obese individuals in the active groups could be considered to be rather high (21.7% of the athletes and 29.9% of the exercise group). However, it is important to note that BMI has limitations in classifying obesity among active individuals, because BMI does not distinguish between weight associated with fat and weight associated with muscle (17,18). For the present study, this situation was true for the athlete group but not for the exercise group. Based on percentage body fat (9), the prevalence of “high fat” (body fat > 22.0%) or “really pre-obese or obese” among the athlete group was only 13.3%, while among the exercise group it was 32.5%. The athletes had significantly lower mean WHR compared to others. WHR provides an index of regional fat distribution and has proven valuable as a guide to health risk. According to Bray (6), men who have WHR values above 0.9 have higher risks of mortality due to diabetes and cardiovascular diseases. Fat distribution is a more important risk factor for morbidity and mortality than being overweight per se and has a relative risk ratio of ³ 2 (6). WHR measurements of adult populations have not been studied extensively in Malaysia. The available data show that the mean WHR of the general population ranges from 0.84 to 0.91 (12,19,20), which is higher than the mean WHR (0.82) of the athletes in the present study. The athlete group had the lowest mean percentage body fat compared to the other groups. However, the mean percentage body fat of the athlete group (15.7 ± 5.4%) in this study was slightly higher compared to the 13.8 ± 4.5% value of national athletes (17). A study in Nigeria among national athletes and the general population reported that the mean percentage body fat among the athletes was 15.8 0.02%, which was lower compared to non-athletes of 18.1 ± 0.05% (21). A study in Malaysia of the general population by Chee et al. (22) on 117 male adults aged 1958 years reported that the mean percentage body fat was 21.0 ± 4.7%. Ismail et al. reported that the mean percentage body fat among 20 Malaysian male soldiers, a relatively physically active group, was 16.6 ± 3.4% (23). The results from the present study, together with findings from other studies locally and in other countries reveal that individuals who are actively involved in physical activities, particularly sports activities, have better health statuses compared to less active groups, as shown by the lower BMIs and percentage body fats. Physical activity is associated with protective effects and decreased risk of cardiovascular disease and cardiovascular disease mortality. A study of Harvard alumni indicated that adopting a physically active lifestyle involving walking, climbing stairs, and playing sports delays all-cause mortality and extends longevity up to 1.6 years (24). Sedentary alumni who expended less than 1,500 kcal/week were at a 39% higher risk of early death than their more active counterparts (24). Therefore, all individuals are recommended to perform regular physical activities. According to public health recommendations, all individuals should accumulate a minimum of 30 minutes of moderate physical activity on most and preferably all days of the week (25). Conclusions Physically active groups, especially athletes had BMIs and percentage body fats compared to less active groups. Therefore, besides maintaining a healthy diet, all individuals are encouraged to participate in sports or other physical activities for a minimum of 30 minutes per day at least 3 times per week to avoid the emergence of chronic diseases. Acknowledgements The authors would like to thank the University Sains Malaysia for funding this study under the short-term IRPA research grant (account no: 305/PPSP/6121046). The authors also thank Sister Eshah, Ms Wan Zalawati, Dr. Rohana, Mrs. Mazlita, Mrs. Ruhaya, Mr. Shahrim Nizam, Mr. Azizi, and Mr. Zulfakharudin who assisted the study. Author contributions Conception and design: WAMWM, WNWD Statistical expertise: MRA All authors have contributed equally to the analysis and interpretation of the data, drafting of the article, critical revision of the article for important intellectual content, and final approval of the manuscript. References
© Copyright 2008 - Malaysian Journal of Medical Science The following images related to this document are available:Photo images[mj09013t1.jpg] [mj09013t5.jpg] [mj09013t3.jpg] [mj09013t4.jpg] [mj09013f1.jpg] |
| |||||||||
