 |
| About Bioline | All Journals | Testimonials | Membership | News |
|
||||||
|
||||||
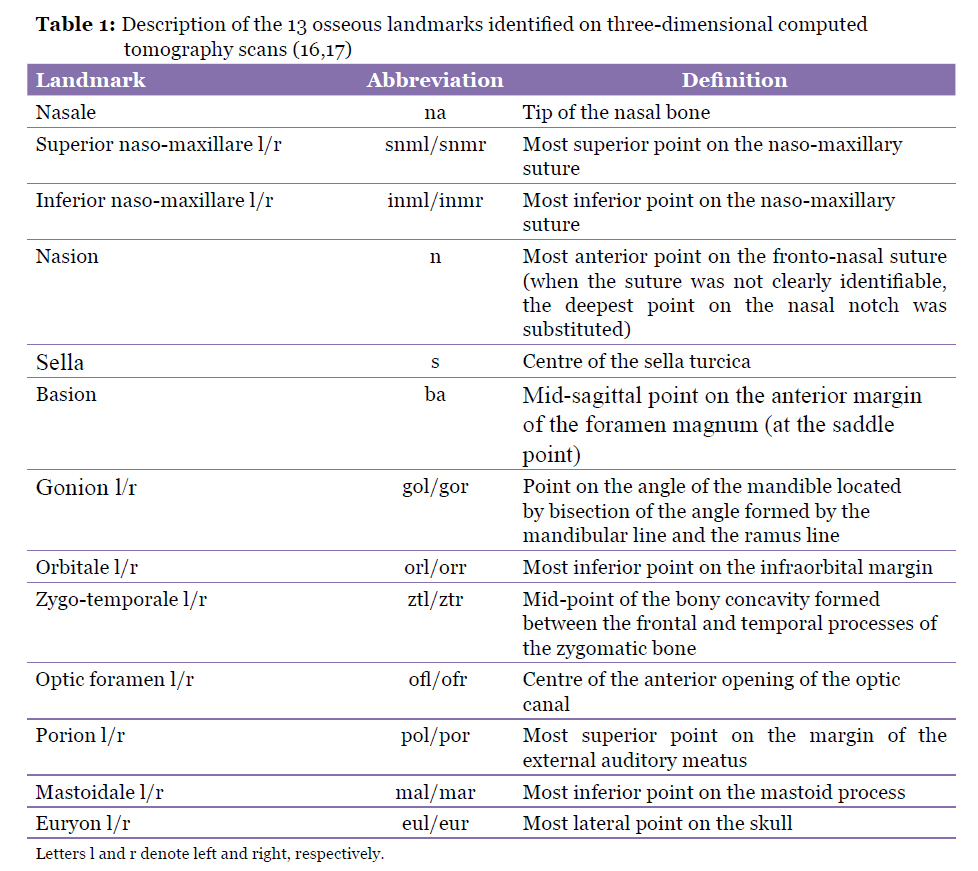
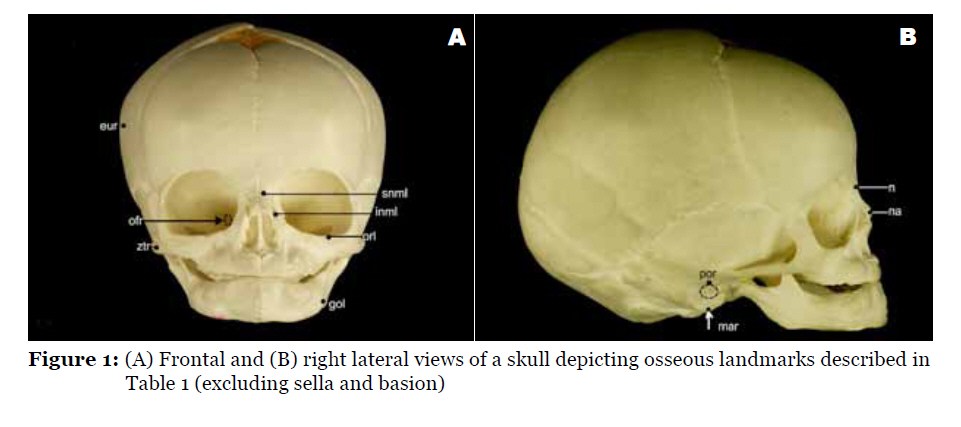
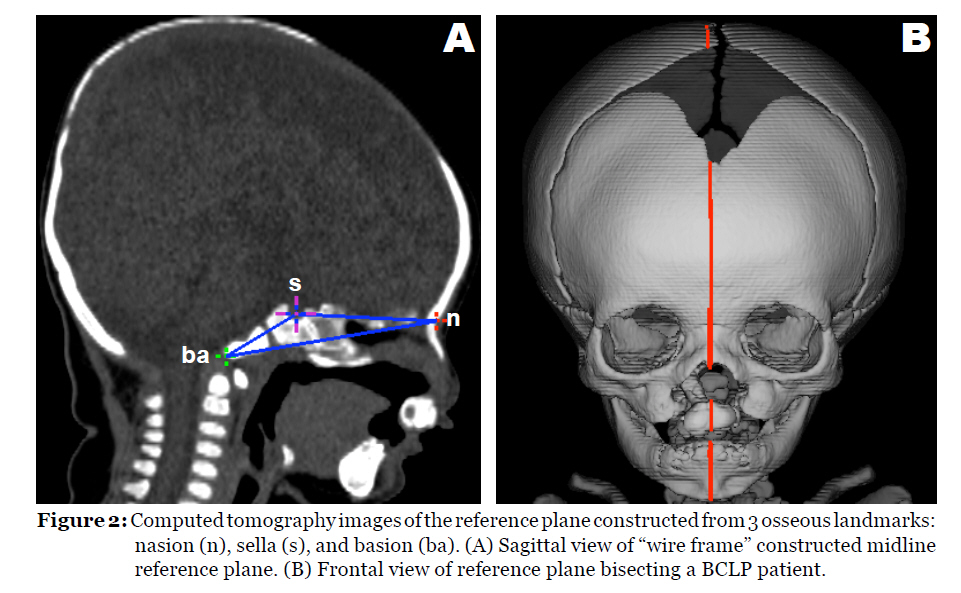
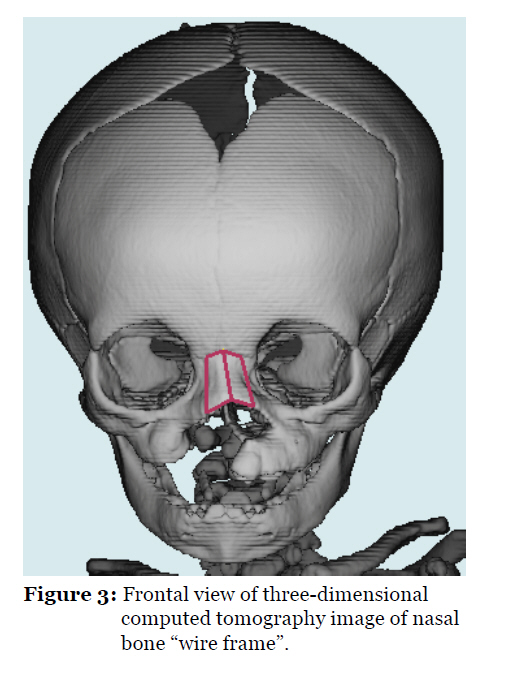
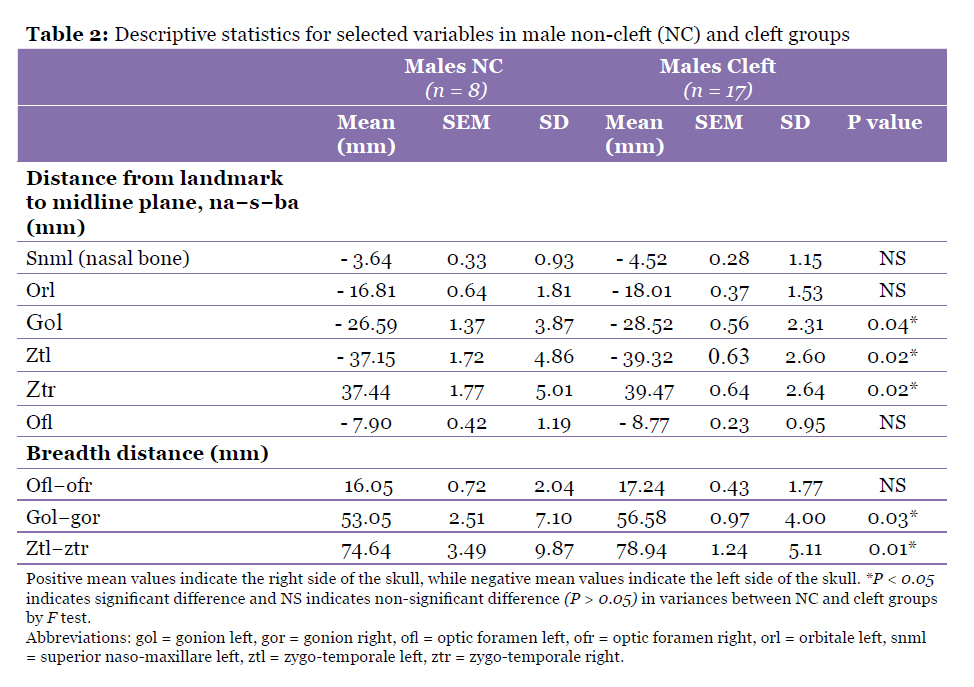
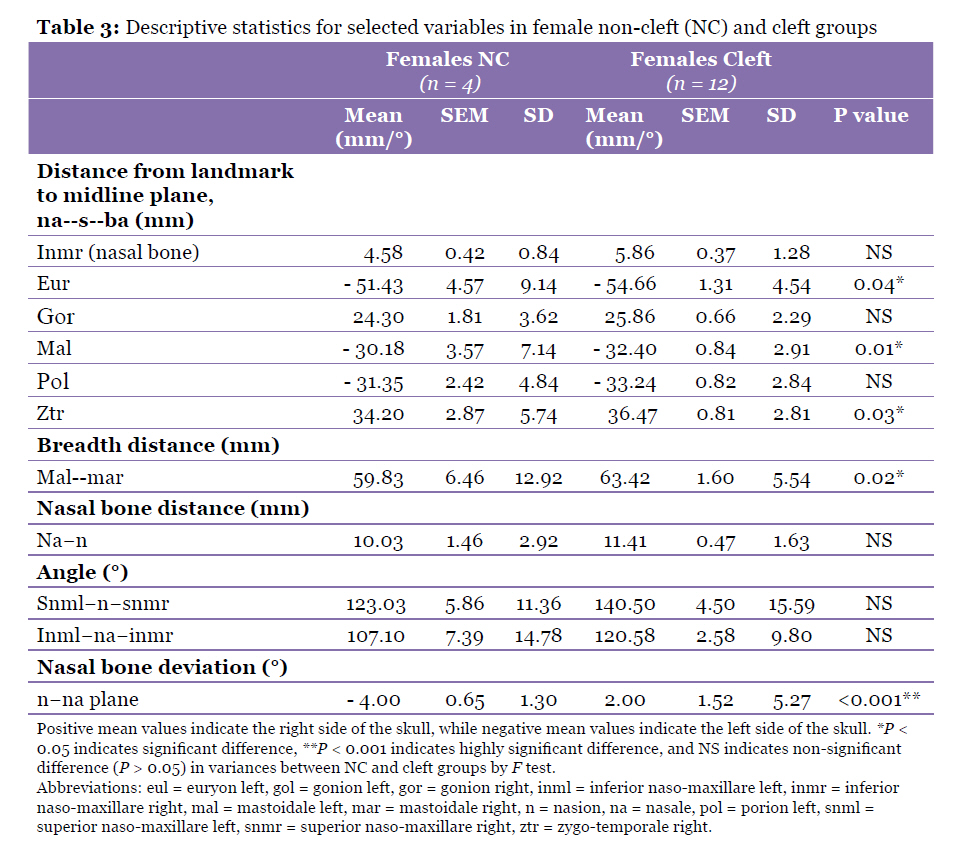
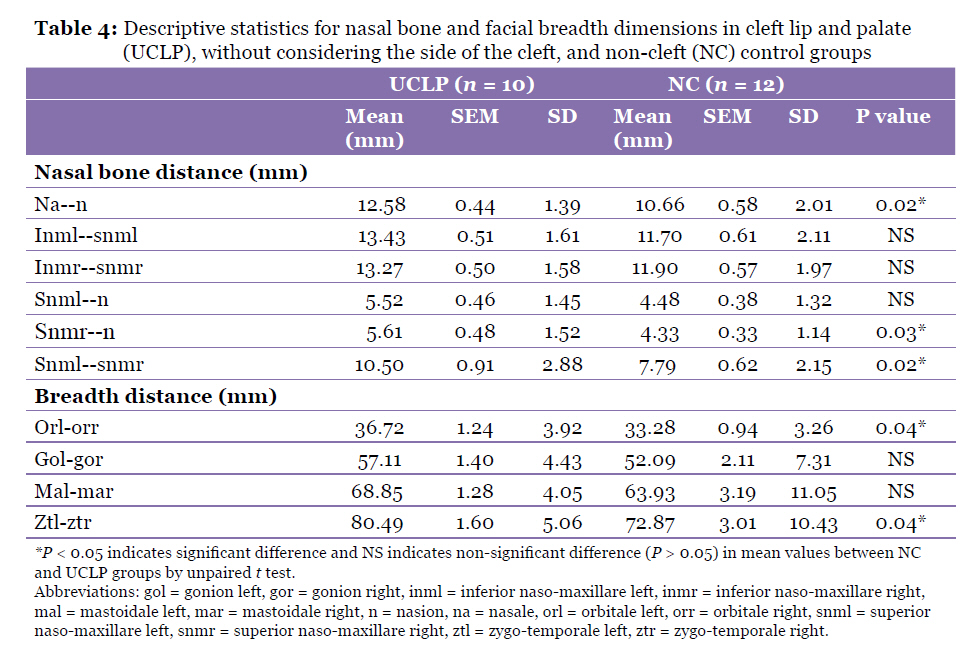
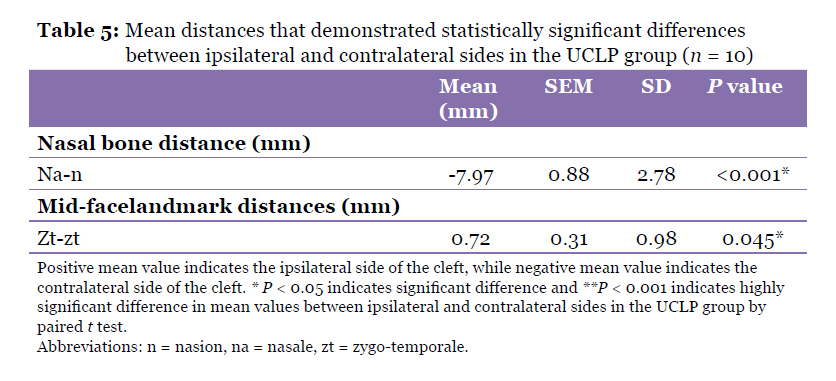
Malaysian Journal of Medical Sciences, Vol. 17, No. 3, 2010, pp. 25-35 Original Article A Three-Dimensional Computed Tomography Analysis of Craniofacial Asymmetry in Malaysian Infants with Cleft Lip and Palate Nikki Tziavaras1, Suzanna Mihailidis1, Zainul Rajion2, Asilah Yusof 2, Peter John Anderson1,2,3 , Grant Townsend1 1Craniofacial Biology Research Group, School of Dentistry, University of Adelaide, South Australia 5005, Australia Correspondence: Dr Suzanna Mihailidis, BDS, BEc, PhD (Adelaide), Craniofacial Biology Research Group, School of Dentistry, The University of Adelaide, South Australia 5005, Australia, Tel: + 61 (0)8 83035968 Fax: + 61 (0)8 83130793 Email: suzanna.mihailidis@adelaide.edu.au Submitted: 26 Nov 2009 Code Number: mj10045 Abstract Background: The application of three-dimensional computed tomography (3D CT) to analyse craniofacial morphology in individuals with cleft lip and palate (CLP) enables detailed assessments to be made of asymmetry in the region of the cleft and in regions distant from the cleft. The aim of this study was to compare craniofacial morphology in a sample of Malaysian infants with unoperated CLP with a control sample of unaffected Malaysian infants. Keywords: cleft lip, cleft palate, facial asymmetry, infant, radiology, three-dimensional imaging, tomography Introduction Patients with orofacial clefts present with a variety of problems including dental anomalies, malocclusions, disorders of speech and hearing, and secondary facial deformities (1,2). Non-syndromic cleft lip, with or without cleft palate, is relatively common. It demonstrates a prevalence that ranges from 0.04 to 0.79 per 1000 live births (3) and 1 in every 500 to 550 live births, with the highest rates observed among the Asians (4). Although functional or iatrogenic factors are generally thought to affect normal facial morphology and growth potential (5,6), it is understood that there is an underlying genetic basis for the formation of clefts (7). Specifically, the MSX1 gene has been associated with cleft palate, and the MSX1 and TGFβ3 genes have been associated with cleft lip, with or without cleft palate (7,8). Conversely, other researchers have found little evidence supporting these findings (9). Changes in facial growth and development in cleft children likely reflect the combined effect of genes and the environment; that is, clefts result from multifactorial influences that affect the growth potential of the face and the overall symmetry of the soft tissues and facial bones (5). Regardless of the pathogenesis or genetics, anomalous developmental conditions, such as cleft lip and palate (CLP), are often associated with increased levels of asymmetry, which have been described as fluctuating or directional asymmetry (10). Fluctuating asymmetry refers to small, random differences in size between sides of the body, for example the face, and is thought to reflect developmental instability, whereas directional asymmetry involves a consistent trend in which one side is larger or smaller than the other and may be influenced by homeobox genes (10–12). The assessment of facial asymmetry is an important component of evaluating the success of surgical repair in CLP and is linked to psychological issues such as perceptions of attractiveness and intelligence (13). Therefore, the present study included an assessment of asymmetry by comparing landmark measurements from the left and right sides of the face. Methodologically, cephalometric and panoramic radiographs have traditionally served as the primary option for the radiographic analysis of craniofacial morphology. However, there are limitations in the measurement of asymmetry using two-dimensional (2D) radiographs, such as the super-imposition of structures and the reliance on machine positioning relative to the external auditory meati, which can be asymmetric within individuals (14). Hence, three dimensional (3D) imaging techniques have been developed to overcome the shortcomings of conventional 2D methods and were applied in the present study; specifically, 3D computed tomography (CT) was used. Other available 3D imaging techniques include morphoanalysis, laser scanning, stereolithography, 3D ultrasonography, 3D facial morphometry, digigraph imaging, Moiré topography, and contour photography (1). Data obtained with 3D CT scanning can be used for soft and hard tissues analysis, whereas methods based on laser techniques are used mainly for the analysis of soft tissue surfaces. Consequently, 3D CT scanning was deemed most suitable for data collection in our study. The overall aim of this study was to compare the craniofacial morphologies in a sample of unoperated Malaysian infants with CLP with those in a sample of age-matched, unaffected, non-cleft (NC) Malaysian infants. Differences in morphologies of the nasal bones were emphasised. A midline plane constructed from the landmarks basion (ba), sella (s), and nasion (n) was used to assess asymmetry in the selected craniofacial variables in both the CLP and the NC groups. Materials and Methods The Malaysian patient database established at the Australian Craniofacial Unit (ACFU), Adelaide Women’s and Children’s Hospital, provided the 3D CT scans of the subjects. The Malaysian cleft sample comprised 29 randomly selected individuals (12 females, 17 males): 10 with unilateral CLP (UCLP), 5 with bilateral CLP (BCLP), 7 with cleft lip and primary palate (CLPP), and 7 with isolated cleft palate (ICP). The control (NC) sample consisted of 12 Malaysian infants (4 females, 8 males) with no craniofacial abnormalities. Ideally, CT scans obtained from normal individuals would provide the ideal control group; however, the radiation dose involved in acquiring CT scans of healthy individuals cannot be justified. There should be sufficient medical and diagnostic reasons for performing a CT investigation. Hence, the NC subjects in the present study were patients with medical conditions that were sufficiently significant to justify the performance of CT scans (for example, meningitis and mild hydrocephalus). However, these conditions did not cause abnormalities in craniofacial growth and morphology (15), as confirmed by preliminary comparisons of the cranial base and facial dimensions of individuals with mild hydrocephalus and of other controls, which revealed estimates within the normal measurement range. All individuals included in the study were of Malay ethnicity. The age of the cleft patients ranged 1.1–12.2 months with a mean of 3.8 (SD 2.5) months, whereas the age for the NC group ranged 0.4–11.9 months with a mean of 4.8 (SD 2.8) months. Ethical approval was obtained from the Adelaide Women’s and Children’s Hospital Research Ethics Committee. The Persona software package developed at the ACFU was utilised for 3D reconstruction of the craniofacial images and determination of the 3D coordinates of osseous landmarks on a silicon graphics computer workstation. This package enables the display of the CT scan data simultaneously around a 3D marker in windows showing axial, sagittal, and coronal sections, and it provides an accurate 3D reconstruction of the external craniofacial bones and the cranial base. The Persona software package enables the 3D positions of landmarks to be located with high precision, which allows the automatic generation of slices through selected points. The thickness of the scan data slices can vary 1.25–2.00 mm. Preliminary analyses using 68 landmark comparisons (61 distances, 7 angles) indicated the presence of random measurement errors ranging 0.2–1.1 mm for distances between landmarks, whereas the random errors for angular variables ranged 1.0°–2.7° (15). In general, the measurement errors were considered relatively small and unlikely to bias the results. In the present study, 13 osseous landmarks were located on the mid-facial region of subjects due to their close proximity to the clefts (Table 1, Figure 1) (16,17). A midline reference plane was created using the following landmarks: ba, s, and n (Figure 2). Breadth variables were then estimated by measuring the distances from mid-face osseous landmarks to the midline reference plane, whereas nasal bone dimensions were estimated by measuring the distances and angles between nasal osseous landmarks (Figure 3). The influence of gender was investigated by comparing variables between male and female subjects in both cleft and NC samples. To explore the presence of any association between the side of the cleft and the direction of nasal bone deviations, the UCLP and NC samples were compared as follows: bilateral variables that coincided with the location of the cleft were measured, and asymmetry was assessed by subtracting the ipsilateral from the contralateral measurements. The data were screened and subsequently corrected for outliers when necessary. Double determinations were performed to assess the magnitude of any systematic or random errors, and Dahlberg statistics were calculated for each variable (18). Although the 2 groups were as closely matched for age as possible, the age range in the cleft group was slightly greater than that in the NC group. Additional age adjustments were applied to the data following the regression analyses of each variable against age in both the cleft and NC samples. Hence, all of the presented data are age-adjusted. Comparison of the mean values and variances between male and female cleft and NC groups were performed using unpaired t tests and F tests with a significance level of P < 0.05. Comparisons between measurements on right and left sides of the face within the UCLP group and within the NC sample were conducted using paired t tests. The R (R Foundation for Statistical Computing, Vienna, AT) and Excel (Microsoft Corporation, Redmond, WA, US) statistical programmes were used to analyse the collected data. Results Male cleft and NC samples Table 2 shows selected landmark distances which revealed the greatest differences in mean values between male cleft and NC samples. Cleft males exhibited greater distances from mid-face landmarks (snml, orl, gol, ztl, ztr, and ofl) to the midline reference plane (na-s-ba) and greater breadth distances (ofl-ofr, gol-gor, and ztl-ztr) than did NC males but none of these differences in mean values was significant statistically. However, 5 of the variables (gol, ztl, ztr, gol-gor, and ztl-ztr) displayed significantly unequal variances (P < 0.05), with variances in NC males exceeding those in cleft males. Female cleft and NC samples Table 3 presents selected landmark distances and angles which showed the greatest differences in mean values between female cleft and NC samples. All variables were larger in the female cleft group than the NC group, including the distances from mid-face landmarks to the midline plane (inmr, eul, gor, mal, pol, and ztr) and the mid-facial breadths (mal-mar). Dimensions of the nasal bone that showed the largest differences between the female cleft group compared with the NC group were na-n and inmr. Angulations depicted by the variables snml-n-snmr and inml-na-inmr were also larger in the female cleft group compared with the NC group. None of these differences in mean values was significant statistically, although the difference in mean values for inmr to the midline plane and snml-n-snmr both reached borderline significance (P = 0.05). Five of the variables (eul, mal, ztr, mal-mar, and n-na plane) showed significant heterogeneity in their variances (P < 0.05 each), with variances in NC females exceeding those in cleft females for all variables except n-na plane. . The nasal bone in the female cleft group showed a significant deviation to the right compared with the NC sample (P < 0.05) and this angle also showed significantly greater variability in the cleft group compared with the NC group (P < 0.05). UCLP and NC samples Comparison of the UCLP and NC samples (prior to consideration of the cleft location) revealed several statistically significant differences in mean landmark distances, as reported in Table 4. All nasal bone dimensions were larger in the UCLP group than the NC group, with significant differences in dimensions na-n, snmr-n, and snml-snmr (P < 0.05 each). Facial breadth distances were also larger in the UCLP group than the NC group, with significant differences in dimensions orl-orr and ztl-ztr (P < 0.05 each). Table 5 presents the bilateral variables that were associated with significant differences between right and left sides of the face when the location of the cleft was considered. To determine cleft-side (ipsilateral) to non-cleft-side (contralateral) dimensional differences, measurements for the ipsilateral side of the cleft were subtracted from those obtained for the contralateral side of the cleft. The results showed that the distances from the ipsilateral zt and the contralateral zt to the midline reference plane were significantly different (P < 0.05), with a larger distance measured on the contralateral side of the cleft. Additionally, a significant degree of deviation (P < 0.001) was observed for the nasal bone variable na-n, which deviated away from the cleft side. In the NC sample, no significant differences were detected between the left and right sides of the face. Discussion Despite several growth theories (19), our understanding of the cellular and molecular control mechanisms involved in human craniofacial development remains incomplete. It is believed that during the course of normal craniofacial development, the histogenesis and functional maturity of muscles, nerves, and vessels may influence one another (19). Abnormal craniofacial development, such as clefting, is also likely to influence the growth and development of adjacent facial and dental structures, which can result in noticeable alterations in facial shape and symmetry. By comparing landmark variables between cleft and NC individuals by gender, it was possible to explore the dimensional impact of clefting on the adjacent facial structures and to assess whether clefting affects males and females differently. Hence, our findings provide information that is important for practising dentists, who play an important role within the multidisciplinary team of health professionals that manage cleft patients. Earlier research on sex differences in CLP has demonstrated little variation in the craniofacial morphology of infants (20) or children aged 6 to 10 years (21,22). Our study demonstrated that mean measurements tended to be larger in the cleft sample than the NC sample, for both males and females. There were also some variables that showed significant heterogeneity in variances between cleft and NC samples for both sexes. Mid-facial breadths in the combined cleft sample revealed that an orofacial cleft may influence facial growth away from the immediate cleft location and contribute to asymmetry. Asymmetry in cleft patients has been reported in the orbital, maxillary and nasal regions (23). Similar results were obtained in the present study; the left optic foramen and orbitale in the male sample tended to be further from the midline compared with the contralateral side. There was also some evidence that the zygoma bone in the mid-face region may be affected, which indicates a possible direct influence of the cleft on horizontal mid-facial breadths in comparison with unaffected individuals. We found that regardless of the cleft type, the mandible showed some tendency to be larger in the cleft sample compared with the NC sample, which differs from previous research (24). In general, clefts can influence facial growth away from the immediate cleft location, and these changes in facial morphology may subsequently influence oral function and alignment and growth of the dentition. Very few studies have reported on the size and orientation of the nasal bones in CLP patients using either radiographs (25) or 3D CT (26), and to our knowledge, no studies have provided results concerning asymmetry. We found that males with clefts tended to show larger superior portions of the left nasal bone and greater left mid-facial breadths compared with the NC group, which suggested potentially left-dominant facial growth. In females, clefts had a somewhat different effect on nasal bone morphology, which tended to be larger superiorly and deviated to the right with a flatter and longer shape. This morphology suggested a possible effect of the cleft on the prominence of the nasal bridge. Results reported in the literature investigating nasal bone morphology range from reports of considerably shorter nasal bones in subjects with cleft lip compared with subjects with cleft palate (25), to longer nasal bones in cleft patients from 6 years of age through to adulthood compared with non-cleft individuals (26). A combination of the cleft location together with normal lateral growth of the frontal bone and maxilla may explain the increase in nasal bone angulation observed superiorly. It is possible that the inferior dimensions of the nasal bone are less affected by CLP because they form the superior portion of the nasal cavity and are therefore influenced to a lesser degree by the surrounding craniofacial bones. Furthermore, the facial muscles may affect the growth and deviation of facial bones, including the nasal bones (19). It is important to bear in mind that there are differences in craniofacial morphology among ethnic groups and caution is needed in extrapolating findings from one population to another. Nevertheless, head breadth dimensions in Malaysian infants in the 0–1 age group are similar to those reported for Caucasians (15). Analysis of the UCLP group showed that severe clefts together with dominant lateral growth of the skull resulted in a number of significant differences between the UCLP and the NC groups. These findings are supported by previous research with respect to transverse asymmetry in individuals with UCLP (27,28,29). Nasal bone lengths in UCLP tended to be longer in both vertical and horizontal dimensions compared with the NC group. This result is supported by evidence showing that UCLP individuals have a high frequency of disproportionately wide noses in relation to the nose height both pre- and post-surgical treatment (30), whereas other researchers have documented that children with UCLP have significant nasal asymmetry that persists after primary surgery (13). In the present study, a significant degree of nasal bone deviation away from the cleft was detected in the UCLP group. The 3D CT technology employed in this study provides more accurate and reliable measurements compared with earlier methodologies that utilise coronal cephalometric or panoramic radiographs. These methods are limited due to super-imposition; for example, landmarks that are positioned more posteriorly, such as s and ba, may be difficult to locate due to overlap with more anteriorly positioned anatomical structures. Furthermore, cephalometric results rely on positioning the radiographic unit relative to the external auditory meati, which can exhibit intra- and inter-individual variations. Although there are advantages in using the 3D CT methodology, technological advances lead to the loss of some comparability between studies with software updates, e.g., differences in the definitions and identification of landmarks between different software programs. A relatively small sample size and pooling of the different types of clefts for some of the analyses present further limitations to the present study. However, considering the difficulties involved in obtaining samples from unoperated CLP patients for whom CT scans are available, we think that the sample size is acceptable. It is expected that infants with an isolated cleft palate (n = 7) are more likely to demonstrate facial morphologies that are more symmetric than those of infants with UCLP. Hence, analyses that explored differences in facial asymmetry between cleft and NC groups (Tables 4 and 5) were not based on pooled cleft data and included only UCLP infants from the cleft group. Given that the aims of the present study were to compare craniofacial morphology, including asymmetry, between samples of unoperated infants with CLP (regardless of the cleft type) and a control NC sample of unaffected infants, we consider the aims to have been adequately met by the pooling of cleft types for some but not all of the presented analyses. An additional issue related to the sample is the age distribution in the cleft and NC groups. The age range in the cleft group was slightly greater, i.e., 1.1–12.2 months and a mean of 3.8 (SD 2.5) months, than that in the NC group, i.e., 0.4–11.9 months and a mean of 4.8 (SD 2.8) months. A few older children were included in the cleft group because their primary operation had been postponed due to other health problems, such as upper respiratory tract infection and aspiration pneumonia. Although this represents a limitation of the present study, the cleft and NC groups were age-matched as closely as possible. They demonstrated very similar age distributions, means, and SDs, and all of the presented data were age-adjusted. Our assumption that the midline points (n-s-ba) can reliably represent a mid-facial plane that divides the face into two equal halves has been drawn from the literature (27,31); however, this may be debatable. For example, the spatial position of n could be affected by the type of cleft, and those of ba and s may be affected in subjects with hydrocephalus. Therefore, preliminary analyses were conducted and revealed that the positions of the 3 landmarks were apparently not significantly affected by abnormalities in craniofacial morphology in either the cleft or NC groups. A number of investigators have reported significant differences in the size and shape of the cranial base of individuals with CLP compared with NC individuals. In contrast, very few differences in post-natal cranial base morphology and growth have been noted between individuals with isolated cleft lip and NC individuals. In the present study, the cranial base values (n-ba and n-s-ba) did not differ significantly between the groups. Although not demonstrated in our study, a trend toward a greater cranial base length in NC individuals compared to cleft individuals has been reported previously (32). Conclusion Differences in mid-facial breadths and nasal bone dimensions were associated with clefting (UCLP versus NC). The nasal bones of individuals in the UCLP group deviated away from the cleft. It is important for members of the multidisciplinary team that manages cleft patients to have an understanding of how clefts affect not only dental and oral structures but also other surrounding anatomical structures. This study shows that CLP affects the size and orientation of the nasal bones and is also associated with alterations in the morphology of other facial bones at positions distant from the region of the cleft. Acknowledgements This research was supported by the Australian Dental Research Foundation. We gratefully acknowledge the guidance and expertise of Dr David Netherway in the planning and execution of this study. Authors’ contributions Conception and design: NT, ZR, AY, GT References
© Copyright 2010 - Malaysian Journal of Medical Science The following images related to this document are available:Photo images[mj10045t5.jpg] [mj10045t4.jpg] [mj10045t3.jpg] [mj10045f1.jpg] [mj10045f2.jpg] [mj10045f3.jpg] [mj10045t1.jpg] [mj10045t2.jpg] |
| |||||||||
