 |
| About Bioline | All Journals | Testimonials | Membership | News |
|
||||||
|
||||||
Indian Journal of Medical Sciences, Volume 57, Number 9, September 2003, pp. 394-399 Urinary fluoride levels and prevalence of dental fluorosis in children of Jhajjar District, Haryana J P Yadav, S Lata* Reader; *Research Scholar, Department of Bio-Sciences, M.D. University,
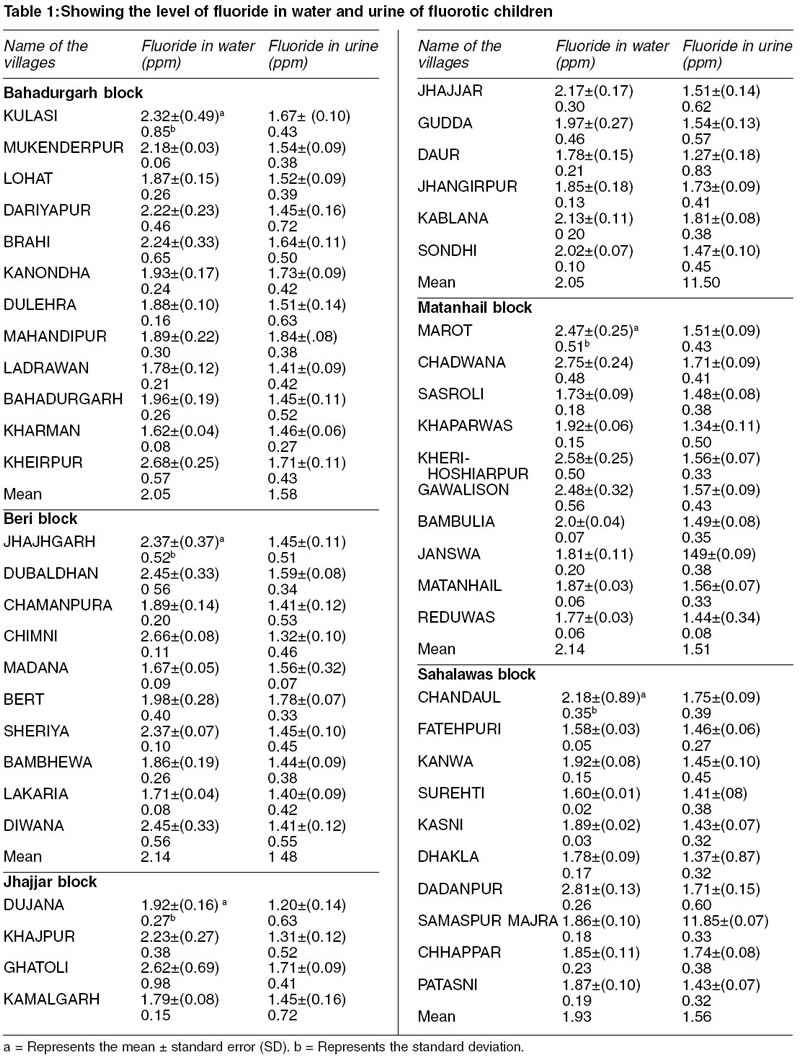
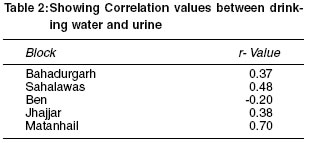
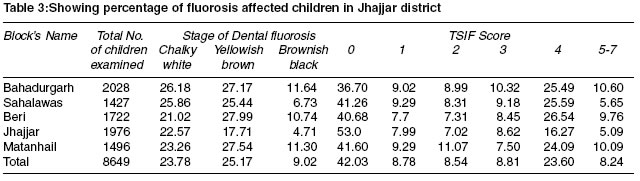
Rohtak-124001, Haryana, India. Accepted Date: 23-08-2003. Code Number: ms03022 ABSTRACT A study was conducted in the Jhajjar district of Haryana to assess the fluoride excretion in the population exposed to environmental fluoride and efforts were being made to correlate the results with dental fluorosis. The mean fluoride concentration in drinking water samples of Bahadurgarh, Beri, Jhajjar, Matanhail and Sahalawas blocks of Jhajjar district were 2.05 mg/L, 2.14 mg/L, 2.05 mg/L, 2.14 mg/L and 1.93 mg/L respectively. The mean urinary fluoride concentration was 1.58 mg/L in Bahadurgarh, 1.48 in Beri, 1.50 in Jhajjar, 1.51 in Matanhail and 1.56 in Sahalawas. The mean prevalence of fluorosis on the basis of stage of dental fluorosis was highest of yellowish brown type and on the basis of TSIF score, score 4 type fluorosis was highest in most of the blocks of Jhajjar district. The study revealed that more than 50% of the individuals were found to be affected with flurosis in this district. INTRODUCTION When assessing the safety of various levels of fluoride ingestion it is important to consider the fluoride intake from all potential sources. These sources might include drinking water, fluoride oral care products and the environment as well as food and beverages. As urine is the main excretion route for ingested fluoride, analysis of the fluoride concentration in urine is a useful way to estimate the overall fluoride intake of a population.1 It has been shown that dental fluorosis and fluoride content of enamel, plaque, saliva, urine, nails and hair are directly related to fluoride levels of drinking water and dietary fluoride intake.2 The main objective of the present study was to consider the comparative analysis of the water fluoride in drinking water and excretory level of fluoride in urine samples. Furthermore, the prevalence of fluorosis was assessed since high prevalence is a sign of an over exposure to fluoride. MATERIAL AND METHODS The area of Jhajjar district is 1834 sq. kms. and geographically situated at 28037'N latitude and 76039'E longitude and 214 meter above the mean sea level. This district consists of 262 villages. All these villages represent Jhajjar district. In most of the villages, ground water is the only source of drinking water. The ground water sources include - hand pumps, tube wells and open wells. In the present study only 52 villages were chosen, 10 villages from each block except Bahadurgarh block (12 villages surveyed). These villages were chosen on the basis of fluoride concentration where it was more than 1.5 ppm, detected after preliminary survey in this district.3,4 Water samples from various drinking water sources (hand pumps, tube wells, open wells) were collected from each village. A total of 10 samples were collected from the selected locations of each village representing the water quality of the whole area. Fluoride concentration was determined spectrophotometrically by using acid zirconyl and SPADNS reagents. Sodium fluoride was used to prepare the standard solution. The fluorosis data was taken from the school going children of the villages to investigate the impact of fluoride on dental health. Performa prescribed by Rajiv Gandhi Drinking Water Mission5 was used to score the incidence and degree of manifestation of dental fluorosis. The recently prescribed Tooth Surface Index of Fluorosis (TSIF) was also used to determine the prevalence of dental fluorosis following the method described by Jackson et al.6 To analyse the level of fluoride in urine, the spots urine samples of school going children were collected from 10 to 12 villages of each block of the district where fluoride concentration was more than 1.5 ppm. The urine samples were collected in nonreactive plastic containers and brought to the laboratory in an ice box. A total of 550 urine samples from 52 villages were collected and analysed for fluoride content by using SPADNS method. RESULTS The data on fluoride distribution in water and urine samples of fluorotic children along with standard error, standard deviation and range have been given in table. In the 12 villages of Bahadurgarh block the fluoride distribution of water samples ranged from 1.62 ppm to 3.52 ppm. The mean value of fluoride was highest in the Kheirpur village (2.68 ppm) and lowest in the Khaiman village (1.62 ppm) while in urine samples fluoride content ranged from 0.31 ppm to 2.85 ppm. The mean value of fluoride in urine was highest in Mahandipur village (1.84 ppm) and lowest in Ladrawan village (1.41 ppm) (Table 1). The water and urine samples collected from 10 villages of Beri block revealed the distribution of fluoride in the range from 1.56 to 3.05 ppm and 0.24 to 2.24 ppm respectively. The mean value for fluoride in water was highest in the Chimni village (2.66 ppm) while lowest in Madana village (1.67 ppm). The range of fluoride varied from 1.52 ppm to 4 ppm in water samples collected from Jhajajr block with the mean value lowest in Daur village (1.78 ppm) and highest in Ghatoli village (2.62 ppm). Likewise in urine samples fluoride ranged from 0.05 to 2.64 ppm having the mean lowest value in Dujana village (1.20 ppm) and highest in Kablana village (1.81 ppm). The water samples collected from 10 villages of Matanhail block showed fluoride concentration in the range of 1.52 ppm to 3.16 ppm. The mean value of fluoride was highest in Chadwana village (2.75 ppm) and lowest in Sasroli village (1.73 ppm). Likewise fluoride concentration in urine sample ranged from 0.15 to 2.64 ppm. The mean value of fluoride was highest in Chadwana village (1.71 ppm) and lowest in Khaparwas village (1.34 ppm). In the 10 villages of Sahlawas block the fluoride distribution was ranged from 1.58 to 3.14 ppm. The mean value for fluoride was highest in Dadanpur village (2.18 ppm) while lowest in Fatehpuri village (1.58 ppm). The fluoride content in urine sample range of 0.24 to 2.80 ppm with the mean highest value in Samaspur-Majra village (1.85 ppm) and mean lowest value in Dhakla village (1.37 ppm). In order to observe the relationship of fluoride with urine, correlation analysis was undertaken and results have been given in Table 2. The positive correlation has been observed between drinking water fluoride and urinary fluoride in all the blocks except Beri block. Percentage of fluorosis affected children in Jhajjar district has been given in Table 3. A total of 8649 individual were screened, out of which 57.97% were observed to be affected by dental fluorosis. The stage of dental fluorosis among these individual were chalky white, 23.78%, Yellowish brown, 25.17% and Brownish black, 9.02%. The percentage distribution of dental fluorosis according to TSIF score was also determined. Any examined permanent tooth surface having a TSIF score 0 was defined as that the children were not affected with fluorosis. TSIF score 1 was defined as being fluorosis. As the score increased (2 to 7) the severity of fluorosis among children increased. The severity of fluorosis was highest in Bahadurgarh block (10.60%) and lowest in Jhajjar (5.09%). In the Jhajajr district TSIF score 4 was found most prevalent. The children having TSIF score 4 showed the staining on tooth enamel that may range from light to very dark brown. DISCUSSION Fluctuations in the fluoride concentration in the drinking water samples have been reported from various blocks of Jhajjar district. The mean fluoride concentration in the drinking water in the villages of Jhajjar district was higher than the value recommended by WHO. It is known that fluoride concentration in urine has a direct relation with intake of fluoride ion. It is reported that persons, who have for a long time consumed fluoride bearing water and have reached a steady state of balance, ultimately excrete via urine every day an amount of fluoride essentially equivalent to the amount consumed. Therefore, urinary fluoride excretion is an index of total exposure.7 In the present study it was reported that urinary fluoride concentration fluctuates with the fluctuation of fluoride concentration found in the drinking water. Early studies indicate that urinary fluoride levels increase with age between 1 and 12 years of age. A study comparing urine samples from English and Sri Lankan subjects reported a mean fluoride level of 1.19 mg/L already in 4 years old children. An Australian study even reported a mean fluoride concentration of 1.72 in 3-4 years old in a community with a water fluoride level of 1 mg/L.8-12 In the present study, large individual variations were observed, which may be the result of both different eating and drinking habits and the fluctuation of fluoride levels in the drinking water. Other factors that may account for inter-individual differences are urine pH, glomerular filtration rate, urine flow rate and kidney status. In the present study it is clear from the data that urinary fluoride concentration was found to be correlated with intake of fluoride through drinking water. Estimating fluoride excretion by means of 24-h samples is more reliable than spot or single sample.8 This sample procedure has been extensively used to determine optimum level of fluoride. As fluoride is rapidly excreted after intake with the peak within 2h, spot or single samples may not reflect the average concentration and even less the total fluoride intake. Furthermore, the consumption of large amounts of liquids dilutes urine and lower fluoride concentration. In some studies, urinary fluoride concentration has been used as an indicator for fluorosis risk. The present data given in Table 3 also shows that as the degree of fluorosis increases from normal to severe, fluoride concentration in urine is increased. This observation needs to be supplemented by blood fluoride determination of fluorotic subjects at different stages of mottling and TSIF score. REFERENCES
Copyright 2003 - Indian Journal of Medical Sciences. The following images related to this document are available:Photo images[ms03022t3.jpg] [ms03022t2.jpg] [ms03022t1.jpg] |
| |||||||||