 |
| About Bioline | All Journals | Testimonials | Membership | News |
|
||||||
|
||||||
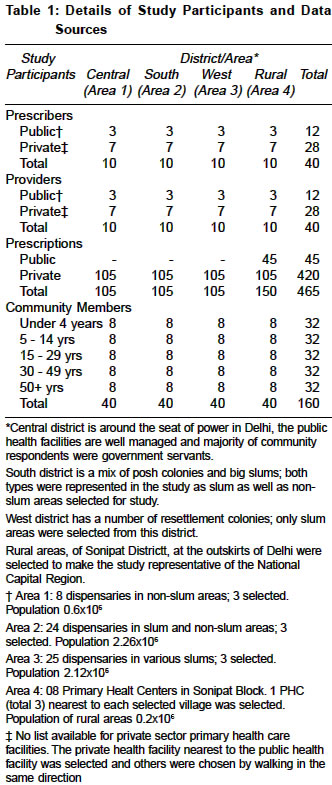
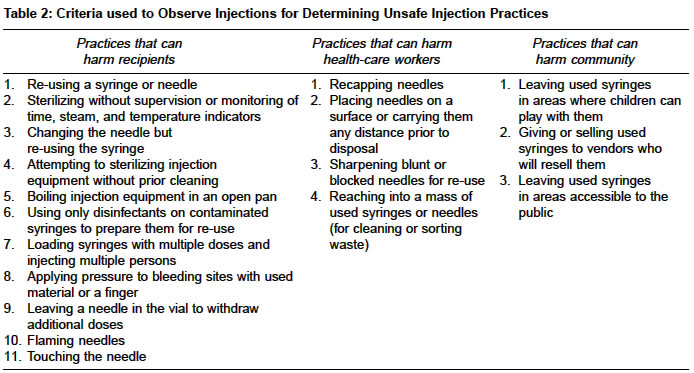
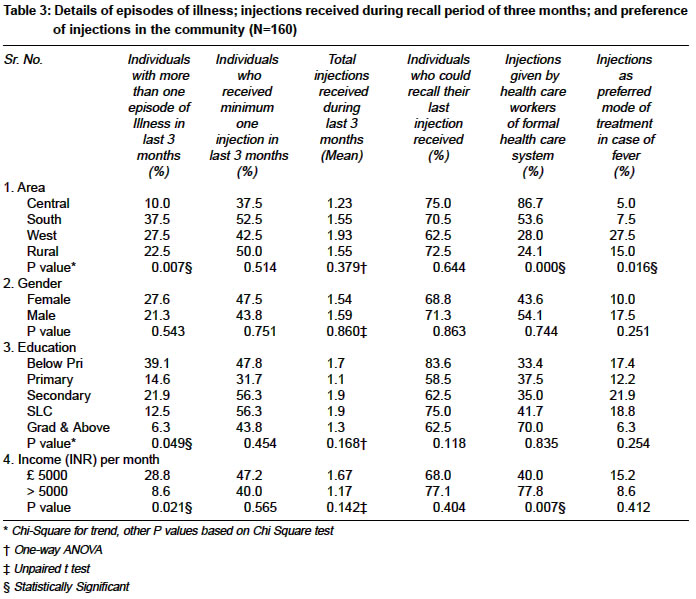
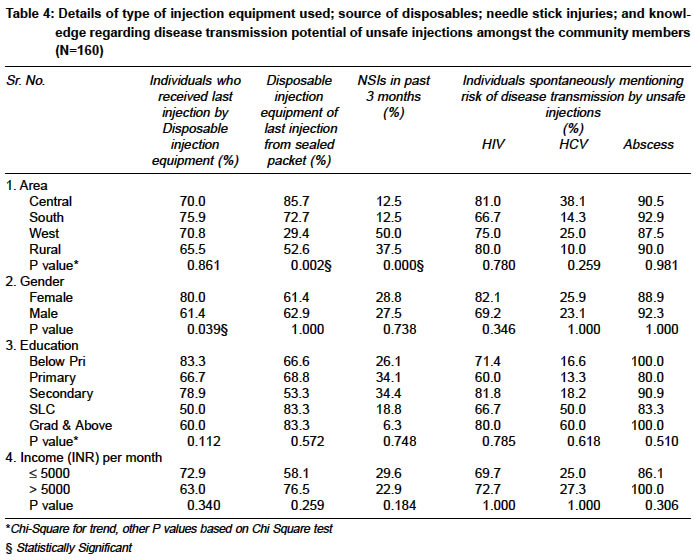
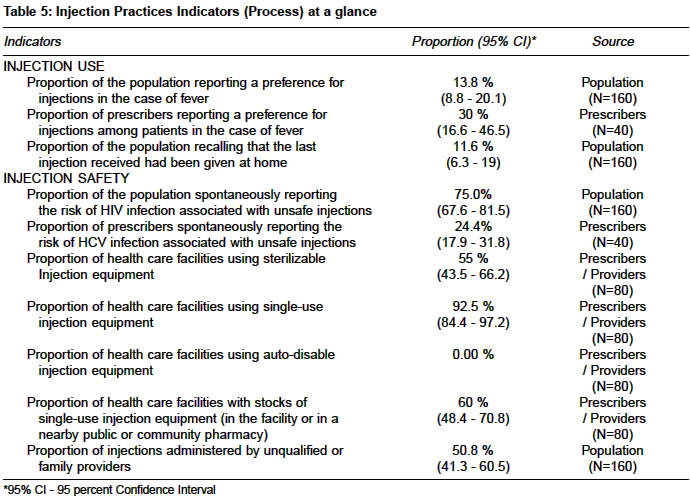
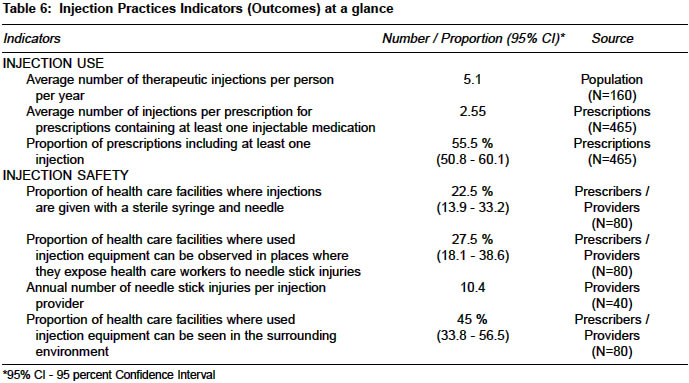
Indian Journal of Medical Sciences, Vol. 58, No. 8, Aug, 2004, pp. 334-344 Original Article Injection practices in a metropolis of North India: Perceptions, determinants and issues of safety Kotwal Atul, Priya R, Thakur R, Gupta V, Kotwal J, Seth T Center of Social Medicine & Community Health, Jawaharlal Nehru University, New Delhi - 110064 Code Number: ms04060 ABSTRACT BACKGROUND: At least 50 percent of the injections administered each year are unsafe, more particularly in developing countries, posing serious health risks. An initial assessment to describe injection practices; their determinants and adverse effects can prevent injection-associated transmission of blood borne pathogens by reducing injection frequency and adoption of safe injection practices. AIMS: To assess the injection practices in a large metropolitan city encompassing varied socio-cultural scenarios. STUDY SETTING AND DESIGN: Field based cross sectional survey covering urban non-slum, slum and peri-urban areas of a large metropolitan city. METHODS AND MATERIAL: Injection prescribers, providers and community members selected by random sampling from the study areas. Pre tested questionnaires assessed knowledge and perceptions of study subjects towards injections and their possible complications. Observation of the process of injection and prescription audit also carried out. STATISTICAL ANALYSIS: MS Access for database and SPSS ver 11 for analysis. Point estimates, 95percent confidence intervals, Chi Square, t test, one-way ANOVA. RESULTS: The per capita injection rate was 5.1 per year and ratio of therapeutic to immunization injections was 4.4:1. Only 22.5percent of injections were administered with a sterile syringe and needle. The level of knowledge about HIV and HBV transmission by unsafe injections was satisfactory amongst prescribers and community, but inadequate amongst providers. HCV was known to a very few in all the groups. The annual incidence of needle stick injuries among providers was quite high. CONCLUSION: A locally relevant safe injection policy based on multi disciplinary approach is required to reduce number of injections, unsafe injections and their attendant complications. Keywords: Injection practices, Perceptions, Determinants, Injection safety, Transmissible infections Injections are a skin piercing procedure performed with a syringe and needle to introduce a substance for prophylactic, curative, or recreational purposes and are among the most frequently used medical procedures, with an estimated 12 billion injections administered each year worldwide.[1] Breaks in safe injection practices coupled with overuse of injections may expose the recipients, healthcare workers, or the community to several harms including life-threatening infections.[2] Most of the curative injections are unnecessary, ineffective or inappropriate and people residing in South East Asia region receive more than 5 injections per capita per year. At least 50 percent of the injections administered in developing countries each year are unsafe posing serious health risks.[3] Unsafe injections can transmit parasitic (malarial), fungal, bacterial, and viral infections like Hepatitis B (HBV), Hepatitis C (HCV), and HIV.[2] Some like abscesses and septicemias may appear relatively quickly, other infections may not be obvious for years or decades. In addition, unsafe injections may also increase the risk of local trauma and nerve damage.[3] A few available studies in India have identified and described the misuse of injections but most are without a systematic description and assessment of the problem. Very few of these studies have tried to understand and analyze the misuse of injections[4],[5] and fewer seem to have been designed to develop appropriate interventions. The available studies differ in their design, sampling, setting, participants and analysis thus preventing any meaningful comparisons among areas and over a period of time.[6],[7],[8],[9] Region specific studies with a standardized methodology, addressing relevant issues comprehensively are required as the high frequency of injections reported contrasts with the paucity of data available to describe them.[10] Safe Injection Global Network (SIGN) is a global alliance that aims to be a catalyst in the transition to safe injection practices i.e. reduced frequency, increased safety and appropriate sharps waste management, by coordination, advocacy, standardization, etc.[11] However, technologies, advocacy and information education and communication (IEC), are irrelevant in the absence of concordance with local social and cultural context and locally relevant research into various aspects of injection practices is required.[12] The present study was carried out to provide comprehensive data from assessment of injection practices in a large metropolitan city encompassing varied socio-cultural scenarios with an overall aim of initiating an informed debate among various stakeholders and to an eventual formulation of locally relevant injection safety policy. MATERIALS AND METHODS The study was conducted in New Delhi, the capital of India. Three districts (central, south and west) were included in the study based on simple random sampling from nine districts of Delhi. A list of villages at the outskirts of Delhi (Sonipat Block of District Sonipat) was made and three such villages were selected by simple random sampling to make the study representative of the situation in National Capital Region. It was decided to study primary level care facilities as the majority of injections are usually administered in these facilities and coupled with information from general population they are probably a useful reflection of all injections being given in Delhi. The sampling strategy included two steps: a) sampling of primary level care facilities, b) selection of prescribers, injection providers and members of the general public on the basis of the sampled primary level care facilities. The health care facilities were selected by stratified random sampling in each district/area and were chosen in such a way that public health facilities comprised 30 percent and private comprised 70 percent of the sample, to represent the situation in reality. Details of sampling universe in each area and selection of health facilities are provided in [Table - 1]. In each health care facility, one or more prescriber and/or one or more injection provider was selected by simple random sampling. 15 prescriptions from consecutive patients of each prescriber were reviewed to calculate the proportion of prescriptions including at least one injection. (This information was obtained from all private prescribers and 3 public of rural area only as public health facilities in other areas were not using any therapeutic injections for out patients as per the official directive and were administering only immunization injections). An attempt was made to describe the safety of injections through observation of all prescribers and providers, using a structured format. The criteria used for safe/unsafe injections are given in [Table - 2]. Field method of randomization (spinning a bottle) was used to select individuals from the general population in the catchment area of the selected health care facility. The sample was made more representative by recruiting participants by age and gender in proportion identical to the general population. Adult caregivers were asked to answer questions pertaining to children less than 10 years of age. To allow for comparisons across settings using an annual number of injections per person, collection of information at the individual level was preferred to collection of information at the household level as household sizes and age structure may differ. The study questionnaires, exploring the knowledge, perceptions and practices, were adapted from those proposed in SIGN document,[13] pretested in north district of Delhi and suitably modified. Due approval was obtained from the institutional ethical committee. Informed consent form was designed based on guidelines issued by Indian Council of Medical Research, New Delhi.[14] The purpose of study; voluntariness of participation; and refusal to participate at any stage was explained to each and every participant, in the language they understood, and signatures obtained before data collection. Prior briefing on the objectives of the study and the method of data collection were given to the data-collectors, who included doctors and trained research assistants. The study was conducted between April and September 2003. Sample size and Statistical Analysis: Taking the proportion of individuals in general population receiving an injection in last three months as 50 percent, at chance error as ±8 percent, 95 percent confidence and 80 percent power, the sample size required was 150. Database was created in MS Access and SPSS ver 11 was used for analysis. The 95 percent confidence interval was calculated for all point estimates. Appropriate statistical tests of significance like Chi Square, Chi Square for trend, t test and ANOVA were applied wherever required. RESULTS The details of selection of health care facilities, prescribers, providers and community members are shown in [Table - 1]. The general population sample (N=160) from four sites was similar in respect of educational level (P = 0.377), occupation (P = 0.986) and visits to doctor during recall period (P = 0.131). However central district had more individuals with higher income per month than other areas (P = 0.000). The important outcome measures from the population data are depicted in [Table - 3] and [Table - 4]. Overall, 45.6 percent (95 percent CI, 37.7 - 53.7) (All figures in parenthesis immediately after any estimates in percentages reflect 95 percent Confidence Intervals) study subjects received minimum one therapeutic injection and 28.8 percent (21.9 - 36.4) received a preventive injection during last three months. 70 percent (62.3 - 77.0) of those interviewed could recall their last injection and only 47.2 percent (40.4 - 59.6) received an injection from health care workers of formal health care. Thus, more than 50 percent of injections were administered in the non - formal health care system and at home by friends and relatives. Though 70.5 percent (61.2 - 78.8) received their last injection by disposable equipment, the syringe and needle came out of a sealed packet for only 61.6 percent out of these. 28.1 percent (21.3 - 35.7) of individuals suffered at least one needle stick injury (NSI) during the recall period. The proportion of general population reporting a preference for injections for the treatment of fever was only 13.8 percent (8.8 - 20.1) but a large proportion, 58.8 percent (50.7 - 66.5), said it all depends on the doctor. Thus, only 25.6 percent (19.1 - 33.1) of population explicitly preferred oral medication for fever. Risk of unsafe injections likely to spread HIV, HBV and HCV was known to 75.0 percent (67.6 - 81.5), 77.5 percent (70.2 - 83.7) and 24.4 percent (17.9 - 31.8), respectively. However, knowledge regarding risk of abscess due to unsafe injections was widely prevalent as it was mentioned by 90 percent (84.3 - 94.2) of the community members. [Table - 5] and [Table - 6] depict the injection practices indicators (process and outcome) at a glance. The proportion of prescriptions including at least one injection (OT8 indicator) (OT8 indicator is defined as the number of prescriptions with at least one injection (excluding immunizations) out of the total number of prescriptions surveyed) was 55.5 percent (50.8 - 60.1). The ratio of therapeutic to immunization injections as per reported workload by prescribers and as per self-reported injections by community was 5:1 and 4.4:1, respectively. Individuals received 5.1 therapeutic injections per person per year. 30 percent (16.6 - 46.5) of prescribers reported patients′preference for injections for fever whereas 42.5 percent (27.1 - 59.1) said that patients accept whatever is prescribed for them. Common conditions for which the prescribers used injections were: fever, pain, injuries, and infections and common medications administered were: antibiotics, antipyretics, tetanus toxoid and vitamins. Risk of HIV infection due to unsafe injections was known to 97.5 percent (86.8 - 99.9) of prescribers and 77.5 percent (61.5 - 89.2) of providers. Risk of HBV infection was known to 87.5 percent (73.2 - 95.8) of prescribers and 52.5 percent (36.1 - 68.5) of providers. However, association between HCV and unsafe injections was known to only 30 percent (16.6 - 46.5) of prescribers and 5 percent (0.6 - 16.9) of providers. The number of NSIs among providers, during last three months, ranged from 2 to 24 i.e. 8 to 96 per provider per year. The incidence of NSIs was very high amongst providers of public health facilities using sterilizables for immunization. An analysis of workload of government health facilities showed that mean number of NSIs per average immunization session was 2.7 (2.2 - 3.3, Poisson). (Primary level care facilities in Delhi giving only immunization injections. Each facility having two providers sharing workload of washing, packing and sterilizing syringes and needles. An average immunization session involving 75 injections). In the private sector, though all prescribers and providers cleaned skin, prior to injection, only 30.4 percent (18.8 - 44.1) used sterile swab for this with 10 percent (4.4 - 18.7) even using dirty/used swabs. Despite all claims about the adequate availability of injection equipment, many of the prescribers and providers were observed to be reusing the syringe while changing only the needle. The used injection equipment was casually placed on table / pan by the providers. New unused equipment was taken out for economically better off patients. The public sector prescribers and providers in the three districts were using sterilizables for immunization injections and had a reserve of disposable injection equipment. The process of sterilization, use, washing, packing, etc at these facilities was appropriate. Only in 22.5 percent (13.9 - 33.2) of health care facilities, injections were given with a sterile syringe and needle. Both sterilizable and disposable injection equipment were being used by 92.5 percent (84.4 - 97.2). Auto-disable injection equipment for immunization and/or curative injections was not being used by any health facility. An adequate stock of injection equipment was seen in 60 percent (48.4 - 70.8) and sufficient number of sharps containers was in only 37.5 percent (22.7 - 54.2). The inappropriate disposal of used injection equipment leading to a potential risk of NSIs to the health care workers and the community members was seen in 27.5 percent (18.1 - 38.6) and 45 percent (33.8 - 56.5) of facilities respectively. Thin polythene bags or ordinary cardboard boxes were used in place of sharps containers and all biological wastes were dumped in these non puncture-proof containers. In a few of the settings, the waste was burnt in an open space and the residue was left without further treatment. DISCUSSION Indian studies show an increase from 1.2 injections per person per year in 1987[4] to 2.46 in 2001[9] and 2003.[15] Our study result of 5.1 is much more than these studies but similar to 5 in Moldova[16] and 5.3 in Uganda[17] and much lower than 8.4 found in Pakistan.[18] Our study ratio of curative to immunization injections (4.4:1) is much less than 20:1 quoted in WHO fact sheet.[1] This may be due to a large number of injections of tetanus toxoid administered to all ages, irrespective of the type of injury and the date of past administration. Our study has corroborated the findings of studies in Tanzania[19] and India[5] showing that health workers seem to be convinced about the superiority of injections and therefore administered far too many injections than are medically justified. Only 13.8 percent of the population(maximum in urban slums, 28 percent, least in central area, 5 percent) preferred injections, and similar to results in Faridabad[9] and Indonesia,[20] a large number (59 percent), had total faith in doctor in this matter. Thus, the main factors responsible for the high number of injections relate to the prescribers, probably to sustain economic incentives.[21] Among general population, 49 percent received last injection with a disposable syringe from sealed packet, which is almost similar to 42.9 percent obtained in south India.[15] Only 22.5 percent of the injections were safe which was less than 35.4 percent reported in South India.[15] Even this might be an overestimation of safe injections as it was based only on observation of the injection process. Standards of autoclaving and sterilization of the injections administered with a sterilized reusable syringe and needle were not assessed and verified. The annual incidence of NSIs among the providers was lower than that found in South India (23.6)[15] but much higher than 2.23 observed in developed countries.[22] The high incidence seen in the present study may arise from the prevalence of washing, sterilizing, and reusing disposable needles, greater patient turnover, less staff, lacunae in training and retraining, etc. Most NSIs occurred during the process of washing the needles and providers using sterilizable injection equipment reported more injuries. Almost 28 percent of the community members also suffered NSI, during the past three months, because of unsafe disposal of injection and other medical wastes. The inadequate knowledge regarding role of unsafe injection practices in transmission of HCV in all the three groups studied and the fact that only about 36 percent of providers were fully immunized against HBV, is a pointer to the need for efforts in this direction. The large number of injections being administered by informal providers (registered medical practitioners and indigenous system practitioners) in our study is similar to that found by other researchers in India[6],[7] and other developing countries.[23],[24] This clearly points to easy availability of injectable drugs, lack of effective policies and programs, a cadre of injectionists with limited biomedical training and the reinterpretation of modern medicine along the lines of existing illness paradigms. An important area of discussion and formulation of appropriate policy pertains to the choice of technology regarding injection equipment as our study and various other studies have shown: reuse and unsafe disposal of disposables; inadequate sterilization of sterilizables; and NSIs to providers using sterilizables. The costs of each technology coupled with manpower requirements and training have to be considered and evaluated before deciding upon a safe and appropriate technology.[25] The number of injections can be reduced by efforts to wean prescribers and providers and also populations away from injection overuse and encourage towards oral medications. CONCLUSION AND RECOMMENDATIONS The problem of unsafe and unnecessary injections is complex and solutions will not be straightforward. Efforts could be made to teach the prescribers/providers to choose treatment wisely based on evidence and provide all medication by safest and most appropriate route. Supervision and monitoring of all aspects of injections in health care settings along with programs to educate the community about hazards of unsafe injections are required. But knowledge alone will not be helpful as reasons for injection overuse and misuse have to be understood and addressed at a deeper level. In fact only a locally relevant, broad based, multi disciplinary, continuing program addressing policies, standards, systems, behavior and technology may ensure injection safety. Study Limitations ACKNOWLEDGEMENT The researchers are grateful to the community members and health care workers who kindly consented to be part of the study.REFERENCES
Copyright 2004 - Indian Journal of Medical Sciences The following images related to this document are available:Photo images[ms04060t4.jpg] [ms04060t6.jpg] [ms04060t3.jpg] [ms04060t2.jpg] [ms04060t1.jpg] [ms04060t5.jpg] |
| |||||||||