 |
| About Bioline | All Journals | Testimonials | Membership | News |
|
||||||
|
||||||
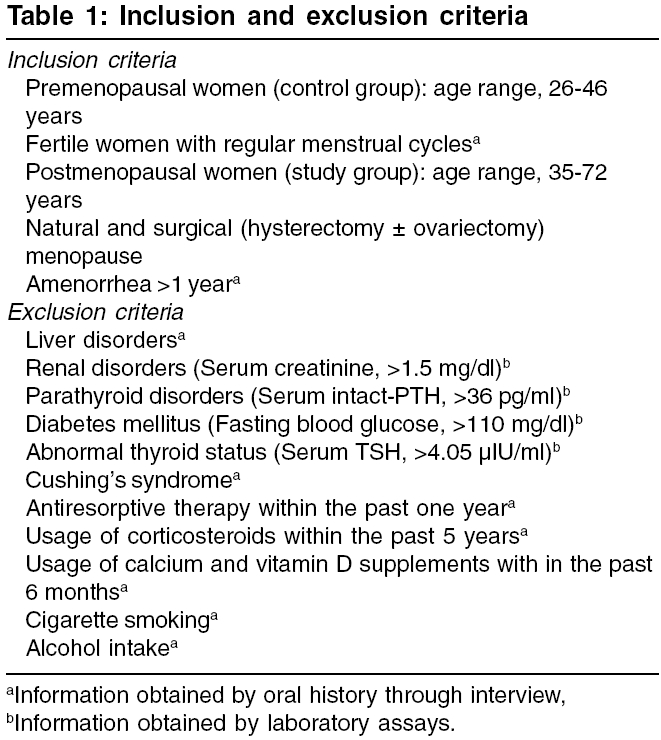
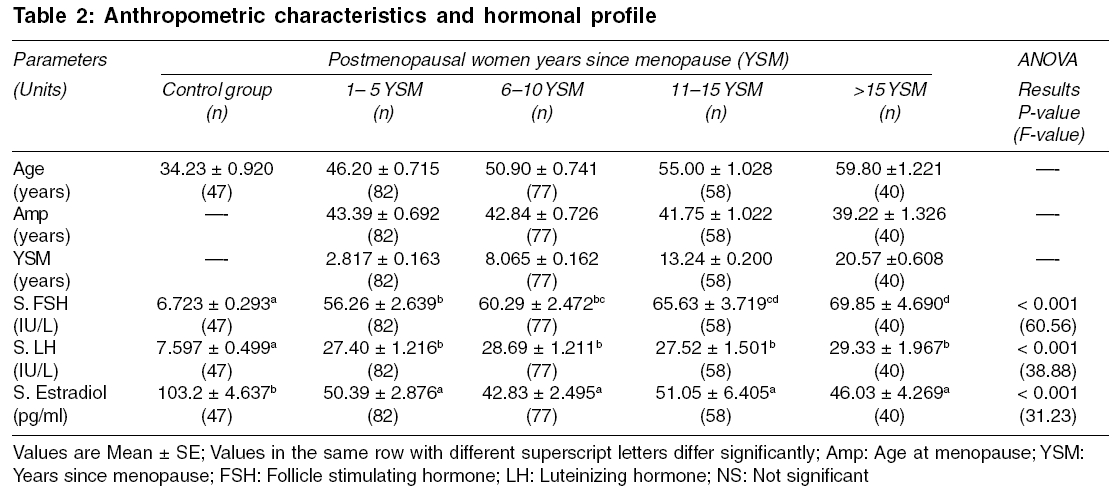
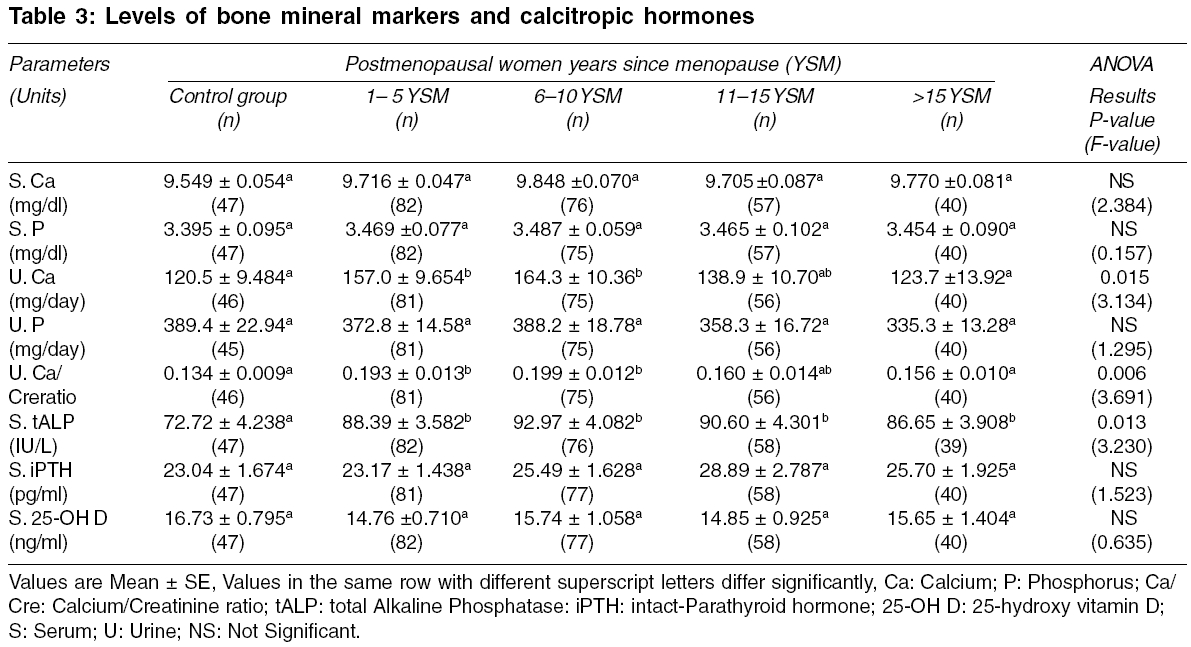
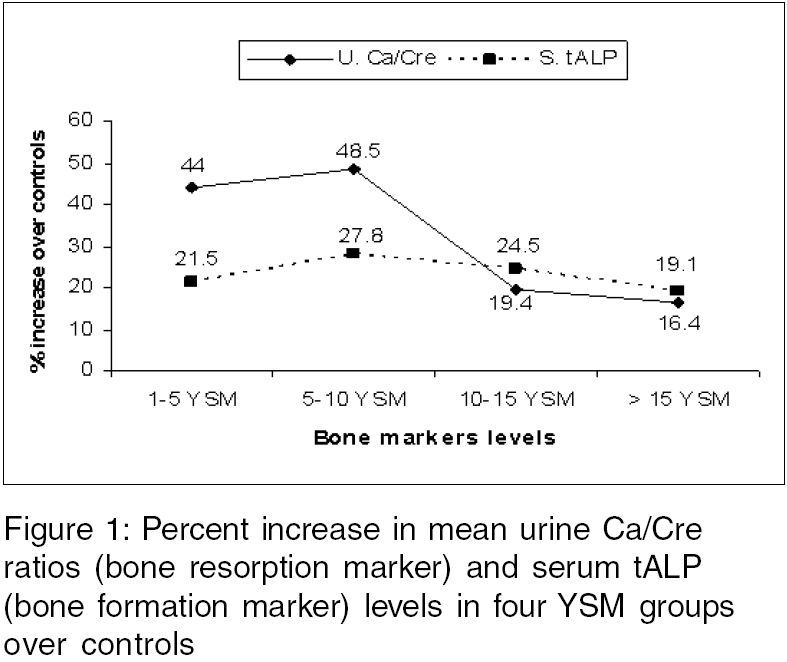
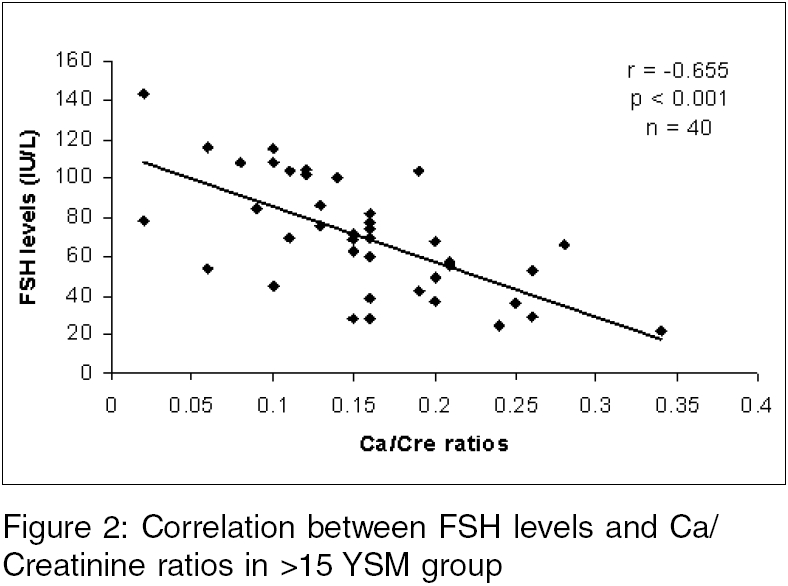
Indian Journal of Medical Sciences, Vol. 60, No. 5, May, 2006, pp. 190-198 ORIGINAL CONTRIBUTIONS Influence of years since menopause on bone mineral metabolism in South Indian women M Suresh, Naidu Dhananjaya M. Department of Biotechnology, Sri Venkateswara University, Tirupati, Andhra Pradesh, India Code Number: ms06028 Abstract BACKGROUND: Although an increase of bone turnover has been documented at the time of menopause, the subsequent abnormalities of bone resorption and formation in the elder women have not been investigated.AIM: To assess bone turnover among different YSM (years since menopause) groups of postmenopausal women. SETTINGS AND DESIGN: A case control study in a tertiary care hospital. MATERIALS AND METHODS: Forty-seven premenopausal (control) women and 257 postmenopausal women were included in this study. Based on YSM, the postmenopausal women were divided into four groups namely, 1-5 YSM (n=82), 6-10 YSM (n=77), 11-15 YSM (n=58) and >15 YSM (n=40). The levels of calcium, phosphorus, total alkaline phosphatase, FSH, LH, estradiol, intact-paratharmone and 25-hydroxy vitamin D in serum and urine levels of calcium, phosphorus and bone resorption marker calcium/creatinine(Ca/Cre) ratios were analyzed in all subjects. STATISTICAL ANALYSIS USED: One way ANOVA followed by Duncan's multiple range test. RESULTS: Significantly increased levels of FSH (P<0.001) and declined levels of urine calcium (P=0.015) and Ca/Cre ratios (P=0.006) were observed in >15 YSM group over 1-5 and 6-10 YSM groups. An inverse correlation was observed between serum FSH levels and urine Ca/Cre ratios (r = -0.655, P<0.001) in >15 YSM group. Comparable deficient estradiol levels were observed in all YSM groups. CONCLUSIONS: The risk of bone resorption is greater in early years than late years of menopause. The decreased bone resorption risk in late postmenopausal women might be due to increased FSH levels. However, further studies are required to explore this finding. Keywords: Years since menopause, bone turnover, follicle stimulating hormone Introduction In 1941, Albright et al[1] first detected that estrogen deficiency is a major pathogenic factor of osteoporosis in postmenopausal women. Estrogen deficiency during menopause causes rapid bone loss, especially in the early years after menopause. Hui et al[2] (Indianapolis), Ribot et al[3] (France), Hedlund and Gallagher[4] (Omaha, NE) worked on their country women and reported that rapid bone loss was observed especially in the first 4-7 years after menopause. Mazzuoli et al[5] (Italy) stated that the early hormone-dependent bone loss commences in the first year after menopause and is arrested within 6 years after the onset of menopause. In a recent study, Garcia-Perez et al[6] observed elevated bone resorption marker levels in Spanish women of ≤ 2 YSM group compared to> 2 YSM group. Although an increase of bone turnover has been documented at the time of menopause, the data on the subsequent abnormalities of bone resorption and formation in the elder women has to be improved. And also no study reported the levels of gonadotropic hormones, estradiol, calcium, phosphorus, bone markers and calcitropic hormone in late postmenopausal women of south India. Hence, the present study was aimed to assess the bone turnover in different YSM (years since menopause) groups of South Indian postmenopausal women to demonstrate the relationship between the bone loss and YSM. Most of the above studies used bone mineral density (BMD) to measure postmenopausal bone loss. In the present study, bone mineral markers were used which have more advantages over BMD (since bone mineral markers provide a more representative indicator of overall skeletal bone loss than BMD measurements at a single skeletal site) in predicting the postmenopausal bone loss. Materials and Methods Subjects Methods The fasting blood glucose levels, serum and urine levels of calcium, phosphorus and creatinine and serum total alkaline phosphatase (tALP) levels were measured using automated analyzer (model: Synchron CX4; make: Beckman). These biochemical parameters have been estimated for three consecutive days and the mean value of each parameter was taken as an observation. Immunoradiometric assay kits were used to estimate serum TSH (supplied by Baba Atomic Research Centre, Mumbai, INDIA), FSH, LH and iPTH (supplied by Diasorin, Stillwater, Minnesota, U.S.A.) levels. Serum E 2 and 25-OH D (kits supplied by Diasorin, Stillwater, Minnesota, U.S.A.) levels were estimated by radioimmunoassay. The normal laboratory (kit) ranges for serum Ca, P, tALP, Cre, TSH, iPTH, 25-OH D were 8.0-10.5 mg/dl, 2.5-4.8 mg/dl, < 110 IU/L, < 1.5 mg/dl, 0.17-4.05 mIU/ml, 9.0-36.0 pg/ml,> 20.0 ng/ml and urine Ca, P, Ca/Cre were < 250.0 mg/day, 300-1300 mg/day, < 0.16 respectively. The quality control sera provided with the kit, gave values of 4.0 IU/L (range: 3.3-5.0 IU/L) in FSH, 4.1 IU/L (range: 3.2-4.8 IU/L) in LH, 108.8 pg/ml (range: 70-130 pg/ml) in E 2 , 34.2 pg/ml (range: 24.8-46.0 pg/ml) in iPTH, 16.0 ng/ml (range: 9.0-21.0 ng/ml), in 25-OH D and 2.4 IU/L (range: 1.7-2.8 IU/L) in TSH assays. For all the above assays, the intra- and inter-assay CVs were found to be fewer than 8% and 12% respectively. Statistical analysis Results The mean levels of fasting blood glucose, serum creatinine and serum TSH were 89 mg/dl, 0.83 mg/dl and 1.89 µIU/ml in premenopause women and 94 mg/dl, 0.86 mg/dl and 1.92 µIU/ml in postmenopausal women respectively. The results of the anthropometric characteristics (age, age at menopause and years since menopause), FSH, LH and E 2 levels in controls and four YSM groups of postmenopausal women were represented in [Table - 2]. The mean YSM of the four groups of women was 2.817, 8.065, 13.24 and 20.57 years respectively. The mean age of control group was 34.23 years. Significantly elevated FSH and LH levels and significantly declined estradiol levels were observed in all YSM groups compared to controls ( P < 0.001). Also, the levels of FSH were found to be elevated significantly in> 15 YSM group compared to 1-5 and 6-10 YSM groups and in 11-15 YSM group compared to 1-5 YSM group. No significant difference was observed with respect to LH and E 2 levels among the different YSM groups. The results of serum and urine levels of calcium and phosphorus, bone turnover markers such as serum total alkaline phosphatase (bone formation marker) and urine calcium/creatinine ratios (bone resorption marker) and calcitropic hormones (serum intact-PTH and 25-hydroxy vitamin D) levels in premenopause (control) and in various YSM groups were depicted in [Table - 3]. The levels of urine calcium were found to be elevated significantly in women 1-5 YSM and 6-10 YSM than in women> 15 YSM and controls ( P =0.015). The bone formation marker, serum total alkaline phosphatase (ALP) levels were found to be elevated by 21.5%, 27.8%, 24.5% and 19.1% in four YSM groups respectively over controls [Figure - 1] and the elevated levels of total ALP were significant at P = 0.013. Significantly elevated urine calcium/creatinine ratios were observed in women 1-5 and 6-10 YSM than in women> 15YSM and control group ( P =0.006). The elevated urine calcium/creatinine ratios were found to be 44.0%, 48.5%, 19.4% and 16.4% in four YSM groups over control group [Figure - 1]. The levels of calcitropic hormones such as serum intact-parathyroid hormone and 25-hydroxy vitamin D were found to be identical in the control and YSM groups. Significant negative correlation was observed between serum FSH levels and Ca/Cre ratios in> 15 YSM group of postmenopausal women (r=-0.655; P < 0.001) [Figure - 2]. This association was not observed in other YSM groups. Discussion On the basis of previously reported data,[7],[8] serum 25-hydroxy vitamin D concentration was defined as deficient when ≤ 10 ng/ml, insufficient when 10-20 ng/ml and sufficient when ≥ 21 ng/ml. In the present study, the 25-hydroxy vitamin D levels in premenopause and YSM groups were found to be between 10 and 20 ng/ml, which indicates vitamin D insufficiency. This finding is in line with Harinarayan[9] study, who reported that 82% of south Indian women were vitamin D insufficient. The ground factors that influence the vitamin D status are duration and intensity of UV light exposure, the surface area of the skin exposed, the degree of melanin pigment in the skin, the amount of substrate available in the skin for conversion to vitamin D and the intake of vitamin D.[10],[11] Though the 25-hydroxy vitamin D levels were insufficient, the intact-PTH levels in this study were found to be within the normal range in control and all YSM groups. In another study, Harinarayan et al[12] also proved that the serum intact-PTH levels were relatively equal to control group in the background of vitamin D insufficiency. The comparable levels of intact-PTH in all YSM groups and controls indicate that the possibility of PTH-mediated bone resorption is absent. The earlier studies[13],[14] suggested that estimation of total ALP levels in serum is a useful marker in assessing mineralization activity of osteoblasts in postmenopausal women. Similarly, urine calcium/creatinine ratios are well-defined markers in assessing the rate of bone resorption.[15],[16] In the present study, bone formation marker serum tALP and bone resorption marker urine Ca/Cre ratios were used to assess bone turnover. Increased levels of bone formation (as evidenced by increased tALP levels) and bone resorption (as evidenced by Ca/Cre ratios) markers indicate high bone turnover in all YSM groups over controls. Since the intact-PTH levels were found to be within the normal limits, high bone turnover in all the YSM groups may be due to estrogen deficiency alone. It is well known that estrogen deficiency induces the synthesis of cytokines by the osteoblasts, monocytes and T-cells and thereby stimulates the bone resorption by increasing the osteoclast number and osteoclast activity. The increased bone resorption consequent to estrogen deficiency causes osteoporosis in postmenopausal women. In case of premenopausal women, the sufficient estradiol levels inhibit the synthesis of cytokines and thereby lower the bone resorption rate.[17] In the present study, the elevated bone resorption marker levels (as evidenced by increased Ca/Cre ratios) in parallel with elevated bone formation marker levels (as supported by increased tALP levels) over controls indicates that the bone resorption and formation are independent and coupled processes in all YSM groups of postmenopausal women. But the increment in total ALP levels was 21.5%, 27.8%, 24.5% and 19.1% whereas the increment in Ca/Cre ratios were 44%, 48.5%, 19.4% and 16.4% in all four YSM groups respectively over controls [Figure - 1]. From the [Figure - 1] it is understandable that the bone formation and resorption rates are greater than controls. Further, the rate of bone resorption overcomes bone formation in 1-5 and 6-10 YSM groups, whereas in 11-15 and> 15 YSM groups, the rates of bone formation and bone resorption are more or less equal. This indicates that the bone resorption risk is greater in early postmenopausal women (≤ 10YSM) compared to late postmenopausal women (>10 YSM). It is obvious from [Figure - 1] that the bone formation rate was appeared to be higher compared to bone resorption rate in late menopausal women (>10YSM). This kind of appearance may be due to drastic declination in bone resorption rate from 48.5% in 6-10 YSM group to 19.4% in 11-15 YSM group, but not due to significant improvement in bone formation rate in late postmenopausal women. The mean serum estradiol levels in premenopausal women (controls) are 103.2 pg/ml. Where as in postmenopausal women of 1-5 YSM, the mean serum estradiol levels are 50.39 pg/ml. That means there was a 50% fall in estradiol levels in 1-5 YSM group of postmenopausal women. Usually, the sudden decline in estradiol levels during the early years of menopause is due to malfunction of ovaries. Generally the bone resorption in postmenopausal women takes place in two ways.[17] One is due to estrogen deficiency and another is due to elevated PTH levels. Since the intact-PTH levels were found to be normal in this study, the increased risk of bone resorption is due to rapid decline in estradiol levels from normalcy to abnormal lower levels. Hence, the present study assumed that the high bone resorption risk early postmenopausal women are due to rapid decline in estrogen levels. Whereas in late postmenopausal women, the reasons for decreased bone resorption risk are unclear so far. Mazzouli et al[5] informed that estrogen-dependent bone loss begins in the first year after menopause and is arrested within six years after the onset of menopause. In the present study, from the [Figure - 1] it is obvious that the bone loss consequent to estrogen deficiency commences in the first year and does not cease. But, the resorption rate is decreasing after 10 years of the onset of menopause. Mazzouli et al[5] also reported that bone resorption prevails over bone formation in the first 2 YSM, whereas the osteoblastic activity relatively prevails from YSM 3 to YSM 5. In the present study, the rate of bone resorption dominates bone formation in first 10 years after menopause, whereas in next 10 years the mineralization activity of osteoblasts becomes more or less equal to osteoclasts activity. Kato et al[18] studied 546 healthy women (215 premenopausal, 164 bilateral oophorectomized and 167 natural menopausal) to clarify the time course changes in bone metabolic markers after menopause. They estimated bone metabolic markers (bone formation markers: serum alkaline phosphatase, osteocalcin and intact osteocalcin; bone resorption markers: urine excretion of hydroxyproline, pyridinoline and deoxypyridin- oline) and lumbar bone mineral density (L2-4) by means of DEXA (Dual Energy X-ray Absorptiometry). After dividing the subjects according to the length of time after menopause, he observed a triphasic pattern of lumbar bone loss: there was a rapid phase in the first 5 years after menopause, a plateau phase in the second 5 years and a slow phase beginning 10 years after menopause. Nilas and Christiansen[19] study, which proved the rate of bone loss declines with the increasing menopausal duration. Rogers et al[20] studied 60 postmenopausal women (ages, 49-62 years), 43 of whom had gone through a natural menopause 1-20 years previously and 17 of whom had undergone hysterectomy 3-22 years ago and indicated the higher rates of bone loss in the early postmenopausal period. The results of the present study corroborates with the above findings. In this study, the estradiol levels were found to be deficient (< 55 pg/ml) and these levels were comparable in all YSM groups. But the FSH levels were found to be increased with increase in YSM and a significantly increased FSH levels were observed in> 15 YSM group compared to 1-5 and 6-10 YSM groups [Table - 2]. Furthermore, a significant negative correlation was observed between FSH levels and urine Ca/Cre ratios [Figure - 2]. The levels of urine calcium and urine calcium/creatinine ratios, which reflects bone resorption, were found to be greater in 1-5 and 6-10 YSM groups compared to> 15 YSM group, indicating high bone resorption risk in early postmenopausal women [Table - 3]. Elevated FSH levels, decreased bone resorption risk (assessed by the declined Ca/Cre ratios) and negative correlation between the FSH levels and Ca/Cre ratios in elder postmenopausal women (>15 YSM group) indicates that high FSH levels (approximately 70 IU/L) might play a vital role in preventing the bone erosion. However, further studies are required to strengthen this view. Also, there is a lack of data to discuss the present views on FSH levels and their role in alleviating bone attrition in late postmenopausal women. Conclusion The elevated bone formation and bone resorption markers levels in all YSM groups over controls indicated that high bone turnover in postmenopausal women is due to estrogen deficiency alone, since the intact-paratharmone levels were found to be normal in all YSM groups. But, the high bone resorption rate than the bone formation rate in 1-5 and 6-10 YSM groups over controls and increased Ca/Cre ratios in 1-5 YSM group and 6-10 YSM group compared to> 15 YSM group indicate that the bone resorption risk is high in early postmenopausal women (≤ 10YSM), which is assumed to be due to a rapid decline in estrogen levels. Hence, estrogen replacement is needed to avoid higher risk of bone resorption at early years of menopause. Elevated FSH levels, declined bone resorption marker levels and inverse relationship between FSH levels and Ca/Cre ratios in long durational postmenopausal women (>15 YSM group) indicates that high FSH levels might be one of the important determinants in alleviating bone attrition.References
Copyright 2006 - Indian Journal of Medical Sciences The following images related to this document are available:Photo images[ms06028t1.jpg] [ms06028t3.jpg] [ms06028t2.jpg] [ms06028f2.jpg] [ms06028f1.jpg] |
| |||||||||