 |
| About Bioline | All Journals | Testimonials | Membership | News |
|
||||||
|
||||||
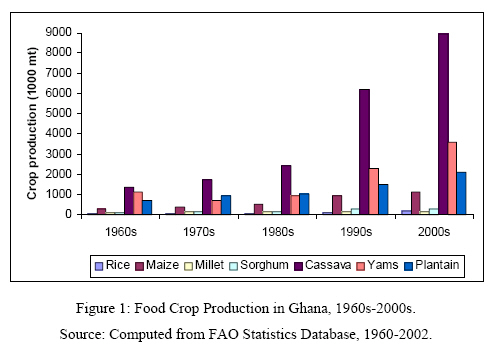
African Journal of Food Agriculture Nutrition and Development, Vol. 7, No. 2, 2007 SUPPLY AND UTILISATION OF FOOD CROPS IN GHANA, 1960-2000. Samuel Nii Ardey Codjoe 1* *Samuel Nii Ardey Codjoe, Regional Institute for Population Studies, University of Ghana, P.O. Box LG 96, Legon, Accra, Ghana. Tel: 233-21-500274 or 233-244-365916, E-mail: scodjoe@ug.edu.gh. Code Number: nd07009 ABSTRACT Agriculture is the main economic activity of the majority of the population living in Ghana. It contributes over 40% of Gross Domestic Product and employs about half of Ghana's labour force. Due to that much attention has been placed on sustainable management of agricultural resources in the country. About 13,628,179 hectares representing 57.1% of Ghana's total land area of 23,853,900 hectares, is suitable for agriculture. However, total area under cultivation in 2000 was 5,808,600 hectares representing 42.6% of the agricultural area. Agriculture in Ghana is mainly on a smallholder basis, although there are some large farms and plantations, particularly for cocoa (1,200,000 ha); oil palm (285,000 ha); seed cotton (62,000 ha); tobacco (1,600 ha); and coconut, banana, kola, etc. (1,502,500 ha). The main system of farming is traditional with the use of hoe and cutlass. Even though there is little mechanised farming, subsistence farming is widespread, especially in northern Ghana. In the 1970s, Ghana was virtually self-sufficient in the production of maize, cocoyam, cassava, and plantain. In 1981-1983, the demand for all these crops except cassava exceeded production. From 1969 to 1983, annual total agricultural production declined by almost 1% while per capita production declined almost 4%. Food supply per person dropped almost 30%. Supply (import and export) and utilisation (for food, feed, seed, farm manure, waste and other uses) of food crops have consequences for food production in Ghana. Using data from the Food and Agriculture Organisation and the Ghana Ministry of Food and Agriculture Census, this paper assesses production, supply and utilisation of food crops in Ghana from 1960 to 2000. It also assesses the trend and pattern of population growth for the same period. Multiple regression models are used to ascertain the statistically significant predictors of food crop (rice, maize, millet, sorghum, cassava, yam and plantain) production in five periods, namely 1960s, 1970s, 1980s, 1990s and 2000s. The analysis shows that wastage, food imports, growth in human population, the utilisation of certain food crops as feed, food and on farms as manure, significantly influenced the production of food crops in Ghana at one point in time or the other in the five decades. Keywords: Supply, Utilisation, Food crops, Ghana, Sub-Saharan Africa. INTRODUCTIONThe world's population grew slowly over much of the past; it was not until after 1990 that growth accelerated and population in 1992 was 5.5 billion. World population has since been increasing at a rate of about 1.7% per annum, with a corresponding doubling time of 40 years. In contemporary times, a gradual decrease in the fertility rate has slowed in a number of countries, notably in China and India, which resulted in an upward revision in population forecasts to just under one billion people during the 1990s [1]. It has been estimated that population growth will reach 7.5 billion people by 2020 and 98% of the growth will be in developing countries. However, world population is expected to stabilise at about 9 billion people by 2050 [2]. In the early 1960s, most nations of the world were self-sufficient in food; currently only a few countries are. Within the period 1950-1984, the introduction of high-yielding crops and energy intensive agriculture brought in the Green Revolution, which culminated in increased crop production mainly in Asia [3]. For example, global grain output increased by a factor of 2.6 at the time [1]. Although food production has tripled in developing countries in the last 30 years, thus, keeping up with population growth, the scenario has been the opposite in sub-Saharan Africa. Predictions of food security look bleak. For instance, it is estimated that crop production (grains, roots and tubers) must increase by 40% and meat products by 58% by 2020 to meet expected demand caused by population growth and increased incomes [2]. However, there is large-scale degradation of the natural resource base used for agriculture in the tropics [4], and soil fertility depletion has been the root cause of food insecurity in Africa [5, 6]. Agriculture is the main economic activity of the majority of the population living in Ghana. It contributes over 40% of Gross Domestic Product and employs about half of Ghana's labour force [7]. As a result, much attention has been placed on sustainable management of agricultural resources in the country. Out of Ghana's total land area of 23,853,900 hectares, 13,628,179 representing 57.1% is suitable for agriculture. However, total area under cultivation in the year 2000 was 5,808,600 hectares representing 42.6% of the agricultural area [8]. This implies that a substantial proportion of Ghana's agricultural area remains unutilised. Agriculture in Ghana is predominantly on a smallholder basis, although there are some large farms and plantations, particularly for cocoa (1,200,000 ha, i.e., 39%); oil palm (285,000 ha, i.e., 9%); seed cotton (62,000 ha, i.e., 2%); tobacco (1,600 ha, i.e., 0.1%); and coconut, banana, kola, etc. (1,502,500 ha, i.e., 49%). Main system of farming is traditional with the use of hoe and cutlass. While there is little mechanised farming, subsistence farming is increasingly practised, especially in northern Ghana. In the 1970s, Ghana was virtually self-sufficient in the production of maize, cocoyam, cassava, and plantain. In 1981-1983, the demand for all these crops except cassava exceeded production. From 1969 to 1983, annual total agricultural production declined by almost 1% while per capita production declined almost 4%. Food supply per person dropped almost 30% [9]. Poor performance in food production can be attributed in part to external economic conditions, physical conditions (for instance, the drought and bushfires of 1982-1983), deficient agricultural policies, low priority given to food production in the past, inadequate support for the agricultural sector and an emphasis on capital-intensive agriculture and industry to the neglect of the larger traditional farming sector. Other reasons for poor performance include: the failure to appreciate the roles and needs of women in agriculture, the persistence of low agricultural technology, a lack of pricing and marketing incentives for farmers in the past, and, until recently, insufficient research and financial support for the small farmer. The result on the agricultural sector has been very limited growth in capital formation, employment, productivity, and incomes. Supply (import and export) and utilisation (for feed, seed, farm manure, waste, other uses and food) of food crop as well as rapid population growth has had consequences for food production in Ghana [10]. This paper assesses production, domestic supply and utilisation of food crops in five decades, namely 1960s, 1970s, 1980s, 1990s and 2000s in Ghana. Also it assesses trend and pattern of population growth for the same period. Multiple regression models are used to ascertain the statistically significant predictors of food crops (rice, maize, millet, sorghum, cassava, yam and plantain) production during the period. MATERIALS AND METHODS Food crop production and population dataFood crop production data was measured by the total production (metric tons) of the major food crop in Ghana, namely, maize (Zea mays), rice (Oryza sativa), cassava (Manihot esculenta), yam (Dioscorea spp.), plantain (Musa x paradisiaca), sorghum (Sorghum bicolar), and millet (Panicum colonum). The data were derived from the Ghana Ministry of Food and Agriculture Censuses, and the Food and Agriculture Organisation's (FAO) Statistical database [11]. The main sources of data for determining the size of the population in Ghana are derived from the Population Census Reports of Ghana for 1960, 1970, 1984 and 2000 [12,7]. Regression modelsMultiple regression models are used to ascertain the statistically significant predictors of food crop (rice, maize, millet, sorghum, cassava, yam and plantain) production in five decades, namely 1960s, 1970s, 1980s, 1990s and 2000s. The dependent variable is total tons of food produced in the decade, and the independent variables are total amount of food crop consumed as food, used as feed, seed and farm manure on farms. The rest include total amount of food crop imported, exported and wasted. The final independent variable is the human population of Ghana in the decade. RESULTS Trends in food crop productionFigure 1 shows average production of the various food crops in Ghana for five decades, namely, 1960s, 1970s, 1980s, 1990s and 2000s. The data for the period 2000s only covers three years, i.e., 2000 to 2002. The leading food crop produced in Ghana in all five periods was cassava, followed by yam, plantain, maize, sorghum, millet and rice in that order. Cassava, plantain and maize productions increased in all five decades by annual rates of 13.6%, 4.9% and 7.8%, respectively (Figure 2). Yam production decreased between the 1960s and 1970s. However, yam production increased in the 1980s through the 2000s by a rate of 13.2% per annum. Between the 1960s and 2000s, yam production increased at a rate of 5.3% per annum. Sorghum production also increased by an annual rate of 5.7% between the 1960s and 1970s. However, sorghum production declined by a rate of 0.4% per annum in the following decade. Sorghum production then increased at an annual rate of 9.9% between the 1980s and 1990s, and decreased again by 0.3% per annum between the 1990s and 2000s. Furthermore, millet production increased by 10.8% per annum in the first three decades, i.e., from the 1960s to 1990s. However, it declined slightly by 0.1% per annum between the 1990s and 2000s. Finally, rice production increased by 7.6% per annum between the 1960s and 1970s. It however, declined by 0.6% per annum in the period between the 1970s and 1980s. Rice production picked up again from the 1980s until the 2000s, increasing by an annual rate of 23%. Supply of food cropsImports, exports and production are considered under supply of food crops. Ghana did not import millet, sorghum, yam and plantain in the 1960s. However, it imported an average of 36.7, 2.2 and 0.3 thousand metric tons (tmt) of rice, maize and cassava, respectively (Table 1). In the 1970s, 1980s, 1990s and 2000s, rice, maize and sorghum were the only food crops imported into Ghana. Total rice imported into Ghana exceeded production levels by 27%, 24% and 20% in the 1960s, 1980s and 1990s, respectively. The periods where rice production exceeded rice imports were the 1970s and the period between 2000 and 2003 (referred to as the 2000s). In the 1970s and 2000s, rice produced in Ghana exceeded rice imported by 27% and 45%, respectively. Maize imports constituted 0.9%, 5.0%, 5.6%, 0.9% and 1.0% of production levels in the 1960s, 1970s, 1980s, 1990s and 2000s, respectively. Furthermore, sorghum imports were 1.6%, 4.7%, 0.5% and 1.0% in the 1970s, 1980s, 1990s and 2000s, respectively. Table 1: Supply and utilisation of food crops in Ghana, 1960s-2000s
The traditional food crops that Ghana exported were cassava, yam (over the entire period) and maize (1970s, 1990s and 2000s). In the 1960s, Ghana exported an average of 0.2 tmt of cassava and 1.8 tmt of yam. In the 1970s, maize, cassava and yam exports were 1.4, 0.1 and 1.6 tmt, respectively. The trend continued in the 1980s with 0.6 and 0.3 tmt of cassava and yam exports, respectively. However, from the beginning of the 1990s, Ghana introduced rice exports and this trend continued in the 2000s. In the 1990s, Ghana exported a modest 0.9 tmt of rice, which rose by 53% in the 2000s. It must be mentioned that rice export was not necessarily as a result of surplus over local demands. Per capita supply of rice decreased between the 1960s and 1980s from 7.5 tmt to 7.1 tmt. However, in the 1990s it increased from 13.3 tmt to 21.5 tmt. Per capita supply of maize increased from 26.4 to 40.8 tmt between the 1960s and 1990s. However, it declined in the 2000s. With regard to millet, per capita supply increased from 7.1 tmt in the 1960s to 9.5 tmt in the 1970s. From the 1970s, it declined to 5.7 tmt in the 2000s. Per capita supply of sorghum has been very erratic. It increased from 8.6 tmt to 10.9 tmt between the 1960s and 1970s. It then declined to 7.8 tmt between the 1970s and 1980s, and increased again in the 1990s to 11.7 tmt. Per capita supply of sorghum further declined to 9.2 tmt in the 2000s. Cassava was the only food crop with a per capita supply that increased for all periods, i.e., from 124.4 in the 1960s, to 128.0 in the 1970s, 132.5 in the 1980s, 201.5 in the 1990s and 213.8 in the 2000s. Food crops utilisation in GhanaGhana utilised some of its food crops domestically as food for humans, feed for livestock, seed for planting, and farm manure. Some of the food crops were also wasted mainly due to lack of transport facilities to cart food crops from production centres to markets. In the 1960s and 1970s, maize was solely used as feed mainly for poultry. However, rice was introduced in the 1980s and millet in the 1990s as feed, and both were used only in the periods they were introduced. In the 1980s, rice utilised as feed was 2.2 tmt and in the 1990s, millet used as feed was 2.0 tmt. Cassava was also introduced as feed in the 1980s and has been maintained till now. Cassava is mainly used in non-poultry livestock production, i.e., for goats, sheep, pigs and some ruminants. The utilisation of cassava as feed ranged from 333 tmt in the 1980s to 1646.7 tmt in the 2000s. Furthermore, Ghana used an average of 5.6, 26.2, 26.5, 55.9 and 65.7 tmt of maize as feed in the 1960s, 1970s, 1980s, 1990s and 2000s, respectively. The cereals (rice, maize, millet and sorghum) have been utilised as seed for replanting in Ghana over the years. An average of 3.0, 14.2, 1.8 and 2.4 tmt of rice, maize, millet and sorghum, have been, respectively, used as seed per annum between the 1960s and 2000s. A proportion of all food crop type was wasted in Ghana during the 1960s-2000s. Food wastage ranged from 5.4 tmt (rice) in the 1960s to 2681.7 tmt (cassava) in the 2000s. In all the five periods, rice was the only food crop that had its consumption level as food exceeding its production level in Ghana. Rice consumption exceeded its production by 183.6%, 141.1%, 192.7%, 195.9% and 241.6% in the 1960s, 1970s, 1980s, 1990s and 2000s, respectively. All the other food crops had their production levels exceeding consumption levels. Maize, millet, sorghum, cassava, yam and plantain consumption levels in Ghana have, respectively, constituted 76.3%, 73.5%, 65.4%, 64.4%, 69.6% and 90.1% of production levels in the period 1960-2002. Population dynamics in GhanaGhana had a population of 6,726,815 in 1960, which grew to 18,912,079 in 2000 (Table 2). The period between 1960 and 1970 experienced a 27% increase in the population, compared to 44% increase in 1970-1984. On the other hand, the period 1984-2000 registered a 54% increase in population. The population of the country almost doubled within a period of 24 years (1960-1984) and almost tripled within a period of 40 years (1960-2000). Table 2: Population of Ghana by Region, 1960 –2000.
Source: Computed from 1984 Population Census of Ghana, Special Report on Localities
by Local Authority and 2000 Population and Housing Census, Special Report on
20 Largest Localities. Furthermore, while the Ashanti region had the highest populations in 1960 (1,109,133), 1970 (1,481,698), 1984 (2,090,100) and 2000 (3,612,950), the Upper West Region had the lowest populations in 1960 (288,706), 1970 (319,865), 1984 (438,008) and 2000 (576,583). The Greater Accra Region recorded the highest increases in population for all the three periods (57% in 1960-1970, 68% in 1970-1984, and 103% in 1984-2000). The lowest increase were in the Upper West Region (11% in 1960-1970), the Volta and Central Regions (28% in 1970-1984) and the Upper East Region (19% in 1984-2000). The Greater Accra Region had the highest growth rates (2.9%, 3.3% and 4.4% in 1960-1970, 1970-1984 and 1984-2000, respectively) for all the periods. The lowest growth rates of 0.6% was recorded in the Upper West Region in 1960, 1.6% in 1970-1984 in the Central and Volta Regions, and 1.1% in the Upper East Region in 1984-2000. DISCUSSION Relationship between supply, utilisation, population, and food crop production in GhanaThe analysis in Table 3 shows that amount of rice wasted was a significant predictor of rice production in the 1970s, 1980s and 1990s. In the 1990s, however, imports also predicted rice production in Ghana. A metric ton of rice imported into Ghana in the 1990s decreased rice production by 0.1 metric ton. Maize imports, wastage and maize utilised for food significantly influenced its production in the 1960s. A metric ton of maize imported and also utilised for food decreased its production by 6 and 1 metric tons, respectively. In the 1990s, a metric ton of maize utilised for feed on farms also increased its production by 14.9 metric tons. [Table 3: About here] Table 3: Parameters of multiple regression models explaining factors influencing food crop production in Ghana, 1960s - 1990s
Table 3: Continued
In the 1960s a metric ton of millet consumed as food and a person added to the population of Ghana, increased millet production by 1.6 and 0.01 metric tons, respectively. Furthermore, in the 1990s millet production decreased by 43.8 metric tons as a result of the amount of millet used as farm manure. It increased by 3.7 metric tons despite the fact that an average of 117,400 metric tons were consumed as food in the same period. With regard to sorghum, a metric ton of sorghum imported into Ghana in the 1980s decreased its production by almost a metric ton. Cassava consumed as food increased its production in the 1960s, 1970s and 1990s. The other factors that increased cassava production in the 1970s and 1990s, were cassava exported from Ghana, the human population, and cassava utilised as feed. The factors that influenced yam production in the 1990s include yam exports, yam consumed as food and the human population. Finally, the amount of plantain consumed as food increased its production in the 1970s and 1980s. The role of population in food crop productionPopulation predicted millet production in the 1960s, cassava production in the 1970s and yam production in the 1990s. In the 1960s and 1970s, an additional person added to the population of Ghana, increased millet and cassava production each by 0.01 metric ton. However in the 1990s a unit increase in the human population declined yam production by 0.003 metric ton. This implies that population pressure on food crop production in Ghana was felt mainly in the 1990s and beyond. CONCLUSIONTrends show that the leading food crops produced in Ghana in all five periods were cassava, followed by yam, plantain, maize, sorghum, millet and rice in that order. Rice, maize, cassava and sorghum were the only food crops imported into Ghana over the years. Furthermore, the traditional food crops that Ghana exported were cassava, maize, and yam although rice was also exported in the 1990s and 2000s. Cassava was the only food crop with a per capita supply that increased for all periods. For the rest of the food crops per capita supply was erratic. With regard to utilisation of food crops in Ghana, maize was the only food crop used as feed mainly for poultry in the 1960s and 1970s. However, rice was introduced in the 1980s and millet in the 1990s as feed, and both were used only in the periods they were introduced. Cassava was also introduced as feed in the 1980s and has been maintained till recent times. The cereals (rice, maize, millet and sorghum) have been utilised as seed for replanting in Ghana over the years. Furthermore, rice was the only food crop that had its consumption level as food exceeding its production level in Ghana in all the five periods. The other food crops had their production levels exceeding consumption levels. Finally, the analysis show that wastage, food imports, growth in human population, the utilisation of certain food crops as feed, food and on farms as manure, significantly influenced the production of food crops in Ghana at one point in time or the other in the five decades. REFERENCES
Copyright 2007 - Rural Outreach Program The following images related to this document are available:Photo images[nd07009t6.jpg] [nd07009t5.jpg] [nd07009t1.jpg] [nd07009t4.jpg] [nd07009t2.jpg] [nd07009f2.jpg] [nd07009f1.jpg] [nd07009t3.jpg] | |||||||||||||||||||||||||||||||||||||||||||||||||||||||||||||||||||||||||||||||||||||||||||||||||||||||||||||||||||||||||||||||||||||||||||||||||||||||||||||||||||||||||||||||||||||||||||||||||||||||||||||||||||||||||||||||||||||||||||||||||||||||||||||||||||||||||||||||||||||||||||||||||||||||||||||||||||||||||||||||||||||||||||||||||||||||||||||||||||||||||||||||||||||||||||||||||||||||||||||||||||||||||||||||||||||||||||||||||||||||||||||||||||||||||||||||||||||||||||||||||||||||||||||||||||||||||||||||||||||||||||||||||||||||||||||||||||||||||||||||||||||||||||||||||||||||||||||||||||||||||||||||||||||||||||||||||||||||||||||||||||||||||||||||||||||||||||||||||||||||||||||||||||||||||||||||||||||||||||||||||||||||||||||||||||||||||||||||||||||||||||||||||||||||||||||||||||||||||||||||||||||||||||||||||||||||||||||||||||||||||||||||||||||||||||||||||||||||||||||||||||||||||||||||||||||||||||||||||||||||||||||||||||||||||||||||||||||||||||||||||||||||||||||||||||||||||||||||||||||||
| |||||||||
