 |
| About Bioline | All Journals | Testimonials | Membership | News |
|
||||||
|
||||||
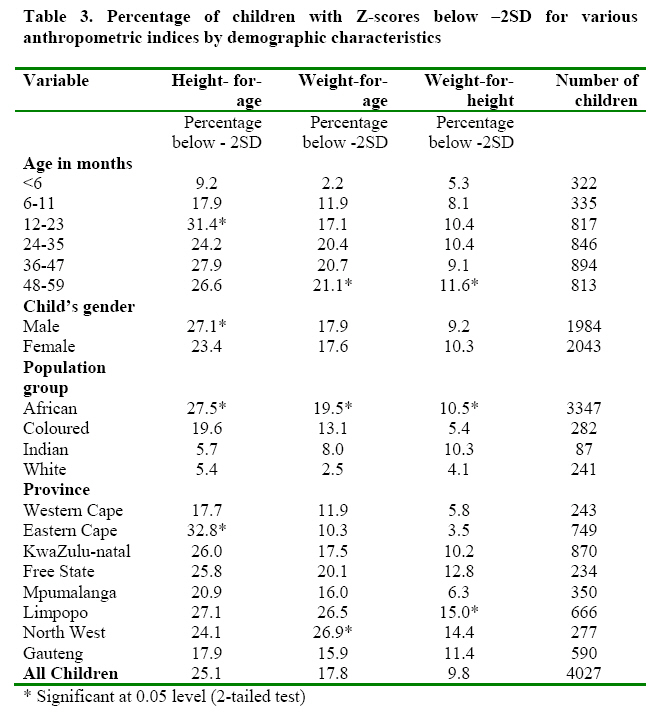
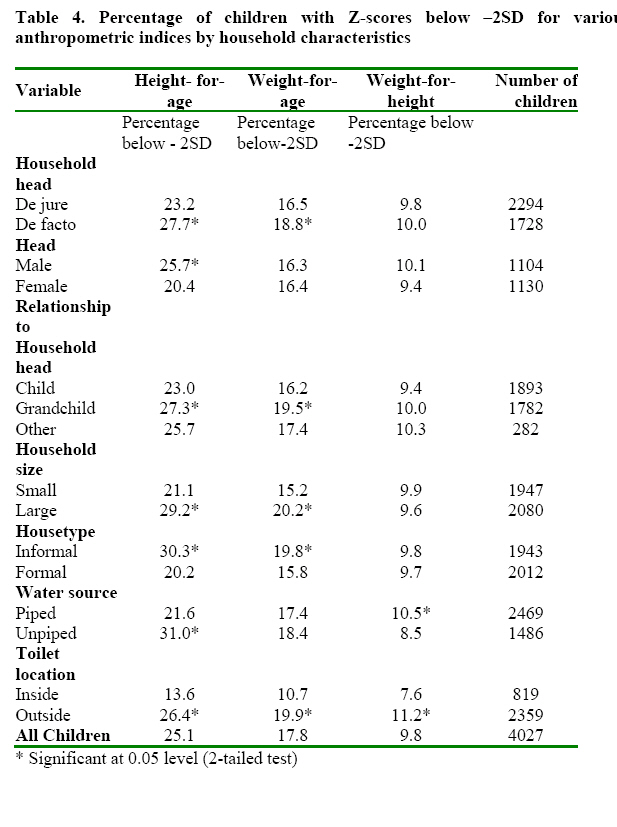
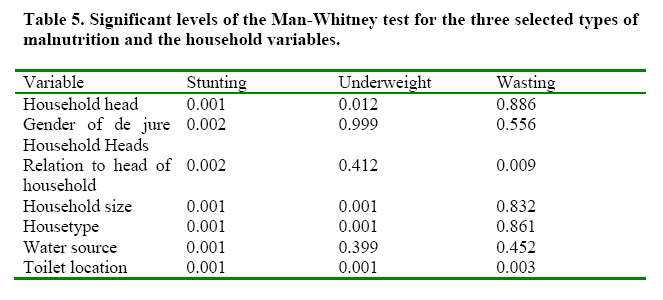
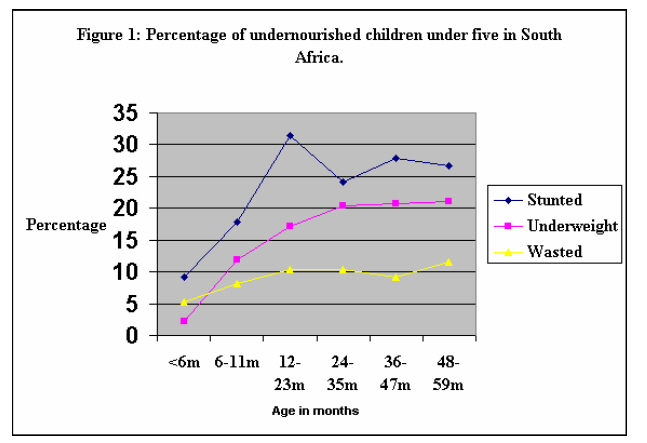
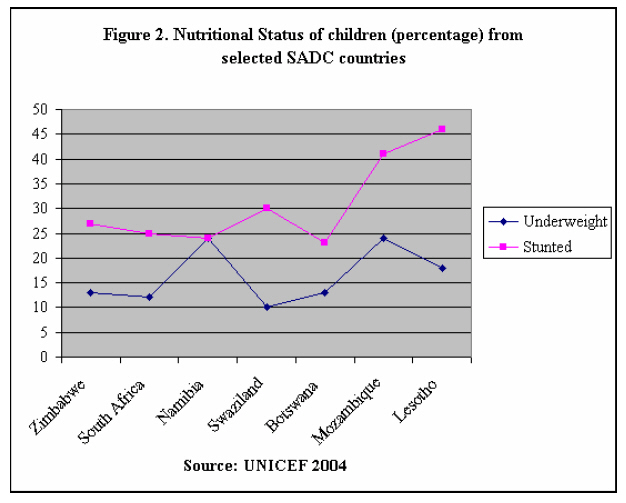
African Journal of Food Agriculture Nutrition and Development, Vol. 7, No. 5, 2007 CHILD NUTRITIONAL STATUS AND HOUSEHOLD PATTERNS INSOUTH AFRICA Nolunkcwe Bomela1* *Corresponding author email: nolunkcwe.bomela@up.ac.za 1Department of Sociology University of Pretoria, Lynnwood Road Pretoria, South Africa 0001 Tel: + 27 12 42 03 302 Fax: + 27 12 42 02 873 Bioline Code: nd07040 ABSTRACTAbout 25% of all children under 5 years in South Africa are severely malnourished. The objective of this study was to assess the comparative effect of person-related and household characteristics on nutritional status of children <5years old in South Africa before 1994 realization of democracy. A secondary analysis of 4 027 children under 5 years from the 1993 Living Standards and Measurement Survey (LSMS) conducted by the Southern Africa Labour and Development Research Unit (SALDRU) in South Africa was performed. Only children with plausible Z-scores (n = 4 027) were selected for subsequent analyses. The influence of person-related and household related characteristics on the nutritional status of children were assessed, taking into account variables such as, gender of household head, de jure and de facto household head, relationship of child to household head, size of household, type of toilet facility and type of dwelling. Statistical Package for Social Scientists (SPSS/PC+) was used for the analysis. Chronic malnutrition and underweight were significantly pronounced in children from households with de jure household heads (P<0.05). However, chronic malnutrition was markedly prevalent among children from male-headed households. Thus, the presence of the de facto household head and the gender of the head of the household are important in determining nutrition outcomes. Furthermore, children of the head of the household had better nutritional status (P<0.05) than the grandchildren and other children in the household. Both person related and household related variables were significantly associated with malnutrition, but at varied levels. Household expenditure, particularly on the basic needs of life, is the most frequently used measure of socio-economic status in nutritional analysis studies. Expenditure is considered as precisely representing the household’s reserves that influence the health status of its members. In the absence of variables used for measuring household expenditure proxy variables are used. The proxy variables (type of dwelling, household size, water source, and toilet location) for economic status of households seem to influence nutritional status more directly while the person related variables seem to indirectly influence nutritional status. Key words: Nutritional Status, Under Five, Stunting INTRODUCTIONChild health and nutrition problems are amongst the most challenging in less developed countries including South Africa. In this respect, an understanding of the nutritional status of children has far-reaching implications for better development planning and for the future of the current generations. Various child health indicators like under five-mortality rate, Infant Mortality Rate, nutritional status, immunizations, and others reveal remarkable improvement in the health of pre-school children. The mortality rate among children under five years of age is still relatively high and their nutritional status very poor. About half of all child deaths worldwide are associated with malnutrition. Furthermore, about 75% of these deaths are linked not to severe malnutrition but to mild and moderate forms, and are concentrated in South Asia and sub-Saharan Africa [1]. While diseases such as whooping cough, measles, and tuberculosis can be prevented and controlled through immunizations, other problems like diarrhoea and malnutrition require public health policies and often large-scale interventions to improve nutritional status of children under five. The synergy between diarrhoea and malnutrition is well-documented [2]. Currently, South Asia has the highest percentage of stunted children (44%, a decline of 8% from 52% in 1998) followed by sub-Saharan Africa with 38% indicating an 8% increase from 30% in 1998 [3, 1]. In some African countries, up to 50% and more of young children are stunted, but half of them are within the normal range of weight-for-age, and otherwise healthy in spite of their small stature. As far as the prevalence of being underweight is concerned, South Asia has again the highest levels at 46% even though indicating a 5% decline from 51% in 1998; this is followed by sub-Saharan Africa with 29% [3, 1]. Between age one and ten years, weight-for-height is nearly independent of age. Although, when children of the same height who are less than one year are compared, the older child tends to be heavier [4]. South Asia (15%) has the highest levels of wasting followed by sub-Saharan Africa at nine percent. Major worldwide surveys on malnutrition, like the Demographic and Health Surveys (DHS), use indicators that are comparable across countries and through time including: birth order, birth interval, education of the mother, residence, mother's age. Thus, there is considerable knowledge regarding the effect of these indicators on child nutritional status. However, there is a dearth of knowledge as far as the effect of person–related and household characteristics on child nutritional status is concerned. South Africa is no exception in this regard. Efforts have been made in South Africa to estimate the prevalence of malnutrition through the analyses of data on anthropometry and micronutrients. Biological risk factors such as age of child and birth intervals, as well as mother's education and housing characteristics have also been examined [5-7]. However, very little, if any is known about the relationship between a child's nutritional status and the characteristics of the household in which he/she lives. Characteristics such as the gender of the household head are rarely explored. (According to the South African Census of 2001, in South Africa a household head is defined as “the person who is the main decision-maker in the household'. This definition applies to all major decisions taken within the household). Widespread poverty and the increasing levels in the feminization of poverty worldwide could have significant influences in household resource allocation including food. Such knowledge is critical in the South African context because of the high as well as increasing proportion of female-headed households in the country. This study examined the relationship between malnutrition among children under five years of age and the characteristics of the households in which they live. It is expected that this study will contribute to our understanding of the underlying factors that help explain prevalence for malnutrition in under fives in South Africa. Even though the results may seem out-of-date, this study drew on the most recent large-scale data sets that had anthropometric indicators. The most recent DHS (2004) is still ongoing. Once the results are available, it will be possible to see the extent to which progress has been made (or not) to address key issues in child nutrition in the country. The 1998 DHS did not collect any data on child anthropometry [8]. METHODSIn this article secondary data from the Living Standards and Measurement Survey (LSMS) carried out in South Africa in 1993 was used to assess the nutritional status of children under five. The LSMS is a nationally representative household sample survey. It included South Africa as it existed at the time, the former homelands and the former independent states. The data set contains 58 data files. One of them contains both the raw measurements of heights and weights as well as the Z-scores. Variables needed for this article were found in 6 different files. Raw anthropometric data (weight and height) were converted into nutritional indicators. The survey involved a total of 8 848 households in which a total number of 5 686 children were identified. Since the focus of this study is on children less than five years old, all children who fell in this category and who had plausible Z-scores on height-for-age, weight-for-age and weight-for-height were selected for subsequent analyses. The total number of children with plausible Z-scores was 4 027. The lack of significant information from the LSMS dataset, for the complete study of nutritional status of under fives cannot be over emphasized. The analysis is, therefore, limited to relevant person related and household related variables available from the data set including nutritional status measures. Variables on major individual and household level factors influencing children’s nutritional status were identified. At the individual level, the child’s gender, age, and race can plausibly influence feeding patterns, health care and nutritional status. At the household level, variables potentially affecting children’s nutritional status include, gender of household head, whether the household head was the de jure or de facto head, relationship of child to household head, household size, and the region of residence. The physical environment of the household is represented by variables for water source, type of housing, and toilet location. The data were analysed using Statistical Package for Social Scientists (SPSS) version 11.0 [9]. Frequencies for non-continuous data and mean values for continuous data were obtained before carrying out statistical analysis. The relationship between the background variables and the nutritional status of the child was established through the administration of the chi-square test. In, addition the Mann-Whitney U test which is a non-parametric test substituting for the student t-test and the Kruskal-Wallis test, which is the counterpart of the one-way ANOVA, were performed to test for significant differences between the independent variables and the nutritional status of the children across categories of identified influencing factors. Most research on malnutrition relies on standardized rates of height, weight and age. The same standard may be used for both cross-sectional and longitudinal anthropometry, at either the individual or the population level. The standardized measurements used most commonly for children are height-for-age indicating stunting, weight-for-age indicating underweight and weight-for-height indicating wasting. Child nutritional status in this study was calculated using the WHO/CDC/NCHS international reference population distributions for the three indicators [10, 11]. The main objectives of the study were to determine the prevalence of malnutrition in under fives using the three indicators: stunting, underweight and wasting. Person-related characteristics such as gender of household head, and household related characteristics like piped water supply and toilet location were examined. The direct link between water supply and toilet location is well documented [2]. Lack or poor supply of quality water is associated with many incidences of water-borne diseases such as diarrhoea, which in turn lead to susceptibility to infection, and loss of weight. The location of the toilet affects the maintenance of hygienic environment in the home. In operationalisation of terms such as proxy measures of socio-economic status, the categorization of housing types into formal and informal dwellings seemed to be a good proxy for the economic status of the household. RESULTS Nutritional status by Demographic CharacteristicsThe discussion on child nutritional status is based on the results presented in Table 3, 4 and 5. The national prevalence of stunting was found to be highest (25.1%), followed by underweight (17.8%) and wasting (9.8%), respectively. Similar to the findings in many other sub-Saharan populations, these results clearly identify stunting as a malnutrition problem in South Africa. The expected overall better nutritional status among the non-African population especially the white population was observed in the results (Table 3). The African children consistently showed high levels of stunting, underweight and wasting (P<0.05), whereas the lowest prevalence was found among the white children. For example, for every one stunted white child there were five stunted African children. The wide gap between the nutritional status of Africans and whites could be due to the unequal size of the two groups. Africans comprised 84% of the surveyed group, while whites comprised 6.1% of the surveyed group. The distribution of the children by race and province in the sample is similar to both the 1996 [12] and 2001 [13] censuses of South Africa. The performance of Indian and coloured children fell between that of the African and the white children. Data for the Indian population are not included in the analysis due to the small numbers in the sub-sample. The data further indicates that malnutrition is concentrated in the poorer provinces (P<0.05). Extremely high prevalence of stunting was found in the Eastern Cape (32.8%) and Limpopo (27.1%) provinces. These are the two provinces with the lowest mean income of R1 479 and R1 234 per month, respectively according to Census 2001. Western Cape (17.7%) and Gauteng (17.9%) had the lowest levels with the remaining provinces falling between the extremes. Data for Northern Cape are not included due to the small numbers of indexed children in this sub-sample. About half of the identified children in the Eastern Cape (15.7%) and KwaZulu-Natal (13.6%) were severely malnourished. Underweight seems to be more prevalent in Limpopo (26.5%) and in the North West (26.9%) while Western Cape and the Eastern Cape had the lowest levels. About one in ten of the under five-year old children in Limpopo were severely underweight. A similar situation was found in the North West. The results on wasting from Limpopo (15.0%) and North West (14.4%) reinforced the emerging pattern that these were provinces where the nutritional status of under fives was poorest. Expectedly children from the Western Cape and Gauteng had relatively better nutritional status while the remaining provinces fell in between the two provinces. Once again, the pattern largely reflects the poor economic development in the other provinces. The prevalence of stunting is low just after birth, rising to about 31% between ages 12 and 23 months, and falling thereafter until about age 3, but picks up between age 3 and 4 and then declines (Figure 1). Stunting becomes increasingly common as children become older (P<0.05), and almost twice as many more children are stunted by the time they are 12 months and older (18%). Stunting decreases between 24-35 months probably because most of the children have stopped breastfeeding; they are now eating solids after the weaning months (12-23). The prevalence of underweight was lowest amongst children under six months (2%). However, after 6 months of age the percentage of children who are underweight increases substantially and gradually and reaches a high at 48-59 months with 21% of the children underweight (P<0.05). Contrary to what is commonly found in most countries, especially in developing countries, (wasting in the 12-23 months age group, the age at which weaning usually occurs), wasting was most common among children in the 12-35 months (21%) as well as in the 48-59 months age group (12%). Highly significant differences (P<0.05) were obtained between the different age groups on the measures of stunting, underweight and wasting. The levels of stunting of boys seemed to be significantly higher than that of girls, 27.1% and 23.4%, respectively, while there was no statistical significant difference in underweight and wasting [14]. Nutritional Status by Household CharacteristicsThe proportion of children who were underweight and suffering from current malnutrition in Male Headed Households did not appear significantly (P>0.05) different from the pattern found in Female Headed Households. However, chronic malnutrition (25.7%) was markedly prevalent (P<0.05) among children from Male Headed Households. About half of these children were severely stunted. Contrary to theoretical expectation, children in Female Headed Households may in fact exhibit better nutritional outcomes than those in Male Headed Households. There are studies that show this to be the case [15, 16]. The study emphasizes the relevance of decision-making in the allocation of resources and suggests that the allocation of available foods in Female Headed Households may be favourable to children compared to the strategy adopted in Male Headed Households. Chronic malnutrition and underweight were significantly (P<0.05) pronounced in children from households with de jure Household Heads compared with children from households with de facto Household Heads. A considerable number of children from households with de jure Household Heads were moderately stunted (28%). The prevalence of acute malnutrition was quite similar (P>0.05) in children in the two types of household headships. The study results further revealed that the children of the head of household had better nutritional status (P<0.05) than the grandchildren and other children in the household. This pattern is particularly reflected in the high proportion of grandchildren and others who were identified as chronically malnourished (28%) and underweight (19.5%). It is clearly demonstrated from the LSMS data that both chronic malnutrition (29%) and underweight (21%) were significantly (P<0.05) more prevalent in large households compared to small households. The average household size in South Africa is currently four persons per household [12,13]. More than a quarter of the children living in informal structures were stunted (P<0.05) compared to 20% found in formal structures. Although stunting was more prevalent among under-fives without treated water (31%) underweight and wasting were not. In fact, the results showed that a higher proportion (10.5%) of children from homes with piped water were identified as wasted (P<0.05) compared to their counterparts from homes with untreated water (8.5%). Was this significant? The location of the toilet facility was the only variable in the whole analysis that revealed that malnutrition, irrespective of its manifestation, is significantly worse among children from households where toilet facility is located outside the home. Stunting levels were highest (26.4%) followed by underweight (19.9%) and wasting (11.2%). DISCUSSIONA number of lessons can be drawn from the analyses of the relationship between the prevalence of malnutrition of children under five years and their household characteristics using data from the LSMS survey. The study results confirmed that stunting or chronic malnutrition is the most prevalent form of malnutrition amongst under-fives in South Africa, as is the case in other developing countries. A comparison between South Africa and other Southern African Development Community (SADC) member countries (Figure 2) indicates that fewer (25%) under fives in South Africa suffer from chronic malnutrition compared to countries such as Mozambique (41%), Angola (45%) and Lesotho (46%). The civil wars in Mozambique and Angola could have contributed to this situation. On the other hand the poorer economy of Lesotho compared to that of South Africa could have been a contributing factor to the poor nutrition levels found at the time. The study also showed a higher proportion of children who were underweight (17.8%) compared to what was found by the South African Vitamin A Consultative Group (SAVACG) (9.8%) [17]. About a third of the children were underweight. Furthermore, South Africa compares well with other countries in Southern Africa ranking at number six (18%) with Mozambique and Namibia having the highest underweight levels at 24% and 28%, respectively (Figure 2). If the Southern Africa Labour and Development Research Unit (SALDRU), which conducted the LSMS, had collected morbidity data on the children, they could probably have shed some light on the relatively high proportions of children who were found to be underweight and wasted in the study. The overall proportion of children wasted, although low, showed a four-fold difference between the SALDRU (9.8%) and the SAVACG (2.6%) studies. Indicating the concentration of wasting in the 0-59 months age group, whereas the SAVACG study included children in the 6-71 months. Some light has been shed on the little known relationship between a child's nutritional status and the type of household he/she belongs to in South Africa. A considerable number of children who were stunted were from households with a de jure Household Head. One of the major factors responsible for the absence of de facto household heads in South Africa is the male labour migration system. Absent de facto heads tend to be largely males. It was also found that contrary to the possible economic advantage [18, 19] of Male Headed Households, the prevalence of malnutrition appeared not to be different from the pattern found in Female Headed Households. Surprisingly, more children were identified as stunted in Male Headed Households compared to those in of Female Headed Households. These results throw light on the possibility that, as shown by studies from the Dominican Republic and Colombia, the nutritional status of under fives in Male Headed Households in South Africa may not be significantly different from that of children in Female Headed Households [15,16]. An intriguing and important lesson from the Dominican Republic study is the need to examine household resource allocation strategies in Male Headed Household and Female Headed Households. The nutritional status of the biological children of the household was remarkably better than that of the grandchildren and other children found in the household. Similarly, children from large households exhibited poorer nutritional status than their counterparts from small households. This finding reinforces the earlier discussion that household strategies and decision-making on the allocation of resources are more important variables in identifying the risk factors associated with child malnutrition. These differences in children's nutritional status could be a reflection of the unequal access to household resources. Indeed, some studies have shown that children who do not live with their parents are at a much higher risk of being malnourished than those who live with them [17, 18]. Two assumptions concerning large households and childcare are important here. First, it is usually assumed that in a large household "...several adults maybe available to undertake childcare duties..."[19]. This may not necessarily be the case in practical terms. Childcare is still primarily a woman's work, the presence of a number of women, the nature of their economic activity; time budgets (especially time allocated to household chores) are important considerations. The demands on a woman's time for economic activity and household chores may not leave time for adequate childcare [20, 21]. Thus, a large number of women in a household does not guarantee adequate childcare for under fives. Second, the traditional assumption is that every child in a large household receives "a smaller piece of the family pie." Contrary to this expectation, a number of studies do highlight the painful truth that the "pie" (household resources) may not be equally distributed among children in a large household. A large proportion of children from such households may not have access to adequate food (quality and quantity), enough time allocated to their care, personal hygiene, preventive and curative health care. In most settings where differential allocation does occur, it does not happen in the case of staple foods [22]. Children in poor countries are generally submitted to a monotonous diet of staple foods intensifying micronutrient deficiencies [23]. As has been demonstrated elsewhere, the housing structure and the sanitation facilities available were significantly identified as risk factors in the prevalence of malnutrition. A major lesson from this data relates to the whole question of sanitation. The type of housing structures obviously limits the construction and the proper positioning of a toilet facility in the home. CONCLUSIONThe results of this research have implications for policy makers attempting to improve child health. In summary, these findings underscore the need to make the improvement of the nutritional status of children a priority in South Africa. Furthermore, a concerted effort by the government to eliminate the continued labour migration system is of ultimate importance in addressing the high malnutrition levels found in households with de jure household heads. In addition, nutrition surveillance at national level needs to be done on a regular and continual basis in order to decrease the percentage of malnourished children to acceptable international levels. REFERENCES
© Copyright 2007 -Rural Outreach Program The following images related to this document are available:Photo images[nd07040f2.jpg] [nd07040t5.jpg] [nd07040t4.jpg] [nd07040t3.jpg] [nd07040t2.jpg] [nd07040t1.jpg] [nd07040f1.jpg] |
| |||||||||
