 |
| About Bioline | All Journals | Testimonials | Membership | News |
|
||||||
|
||||||
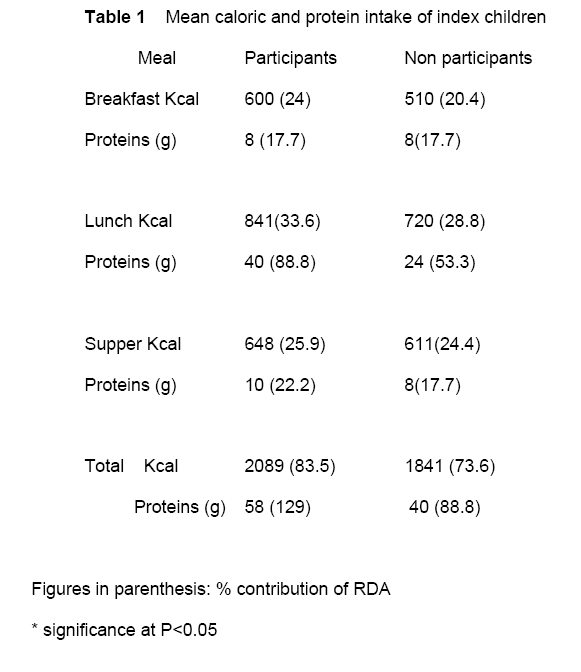
African Journal of Food Agriculture Nutrition and Development, Vol. 7, No. 6, 2007 IMPACT OF SCHOOL LUNCH PROGRAMMES ON NUTRITIONAL STATUS OF CHILDREN IN VIHIGA DISTRICT, WESTERN KENYABetty Musamali1 Corresponding author: mbetti2005@yahoo.com 1P.O Box 424, Bondo, Kenya Code Number: nd07048 ABSTRACTMalnutrition exists in some form in every country. Protein Energy malnutrition is the commonest and the most devastating form of malnutrition among children under five years of age and school children. This suggests that interventions in the school aged children can help reduce levels of malnutrition and its related effects on childrens' health and education. School feeding Programmes (SFP), which have been initiated in many countries including Kenya, have been shown to improve academic performance and nutritional status in developing and industrialized countries. However, the effects of School Lunch programmes (SLP) in Vihiga District have not been evaluated. The purpose of this study was to determine the role of SLP in improving the nutritional status of school children in Emuhaya Division of Vihiga district, Kenya. The objectives of the study were: to compare the nutritional status of participants (children who participate in the school lunch) and non-participants (children who do not participate in the school lunch) and to assess the diet quality of the school and home lunch. It was hypothesized that the nutritional status of participants was better than that of the nonparticipants. Three hundred and twenty pupils (index children) and their parents were randomly selected for the purpose of the study. Anthropometric measurements, 24-hour recall, interview schedules and observed weighed technique were the instruments used in data collection. Using Statistics, frequencies, means, correlations and multiple regressions were generated and used to analyze socio-economic data and effect of SLP on nutritional status. Food composition tables and Epi Info version 6 were also employed to analyze the diet quality of the school and home lunch and anthropometric data respectively. The results indicated a positive association between the school lunch and nutritional status. The diet quality of the school lunch and nutritional status of participants were significantly higher than that of the non-participants. SLP had a positive significant effect on the nutritional status of participating children. More schools and parents in similar environments should therefore be encouraged to venture into the SLP because of their positive outcome on nutritional status as well as the diet quality of participating children. Key words: School Lunch Programmes, Nutritional status INTRODUCTIONAn understanding and awareness of the heavy burden of malnutrition among school children is growing. However, even though a better picture of the nutritional status of this age group is being built, the extent of the burden of malnutrition is still not fully known [1]. Malnutrition in this age group can be addressed by focusing on relevant policies and programmes [2]. The main nutritional problems facing the school-aged children are stunting, underweight, wasting and anemia. However children can exhibit catch up growth if their environment improves [1]. Thus school-based interventions like school feeding programmes (SFP) aimed at alleviating hunger can also help improve nutritional status of school children if well planned [3]. The Government of Kenya (GOK) / World Food Programme (WFP) School Feeding Programme was introduced in Kenya in 1981. The programme is still in operation and covers arid and low potential areas in which food production is low. These areas are poor, have food deficits and school enrolment levels that are below the national average of 87% [4]. Among the objectives of the programme were to improve nutritional status, school enrolment and attendance levels and therefore academic performance of participating children. The School Feeding Programme aims to achieve this through providing a nutritious midday meal to pupils. However, some of the areas that are not covered by the feeding programme discussed above have adopted a scheme whereby they provide a midday meal throughout the school year at a relatively low cost, with the same objectives as the school feeding programme. The meal is also provided to save time for class and to provide recreation time during lunch hour and also due to the fact that some mothers are not available to prepare lunch for their children. The meal is prepared from locally produced foods and is intended to make up for possible imbalances in the childrens' daily diet. The programme is referred to as the School Lunch Programme (SLP). Vihiga District experiences food shortages almost throughout the year due to small farm sizes and high population density. Compassion International (a Non-governmental Organization) initially supported the school-feeding programme, but withdrew due to financial constraints. A scrutiny of the academic performance, enrollment and attendance records revealed that there was significant improvement in schools that were supported as compared to those that were not. A number of schools have since adopted the system whereby a midday meal is provided for pupils. Parents contribute some money to cater for this. However, there has been no evaluation of these SLP to show their effect on nutritional status of school children. School Feeding Programmes have been established in many countries [5]. RESEARCH METHODS Area of study Emuhaya Division is located on the leeward side of the Maragoli hills. It therefore receives low amounts of rainfall, a factor likely to negatively affect food production in the area. Temperatures in the Division range from 14oC to 32oC. It has a population of 101, 196 people in an area of 169.5 square km. The population density is approximately 1091 persons per square km. The average family size is 8 persons while the mean farm size is slightly less than 0.6 ha or 1.5 acres. The Division has 4 locations namely Wekhomo, North Bunyore, East Bunyore and North East Bunyore [6]. The division was chosen as the study site because it experiences food shortages due to limited land, a factor likely to jeopardize food intake and hence nutritional status of school children. Study populationThe study sample comprised of class five and six pupils from public schools. These classes were chosen because the pupils were likely to have participated in the lunch programme for at least two years, since most children start participating in the programme at class three. It was assumed that a minimum of two years' participation in the programme would be adequate to demonstrate the impact of the programme on the nutritional status of the children. Sample size and Sampling Procedures A sample size of 320 pupils (160 participants and 160 non-participants) was randomly selected for the study according to the formula suggested by Fisher et al. [7] for comparative studies. This study adopted a cross-sectional survey design. This incorporated both qualitative and quantitative research approaches. Schools with SLP were identified using records at the Emuhaya Division education offices. According to the records, sixteen schools in the Division had the SLP while thirty seven did not. To obtain the study sample, eight schools were randomly picked from schools with SLP. Since Emuhaya Division has four locations, two schools were randomly selected from each location. To do this, schools with the SLP in each location were listed and two schools selected from each location using simple random sampling. To obtain the pupils' sample in each school, teachers provided standard 5 and 6 lists of pupils to constitute the sampling frame. The study pupils were then selected using stratified random sampling. The strata for this population were obtained by grouping the population into two; participants and non-participants in the SLP. Ten pupils were then randomly selected in each group to obtain 20 pupils per class. This gave 40 pupils per school and a total sample of 320 pupils for the eight schools. One parent of each index child was selected to provide data on socio-economic characteristics of their households. Data collection Instruments and proceduresPermission to conduct the research was granted by the District Education office. The head teachers of the various schools then requested parents of the study children to allow the researcher to collect data on their socio-economic characteristics and home diet. Data was collected using anthropometry, 24-hour recall, observed weighed technique and interview schedule. Anthropometric measurements yielded data used to determine nutritional status of the children using weight-for-age, height-for-age and weight-for-height indices. The height and weight were measured using a height board and an electronic "Seca' weighing scale respectively. The ages of the index children were obtained from the school records and parents and also verified with birth certificates and baptism cards. The 24-hour recall yielded data on kinds of foods and nutrients pupils eat at home. This enabled the researcher to establish the adequacy of the home diet and control its influence on the nutritional status of the pupils. For the observed weighed technique, volumes of food portions served and consumed by the children were measured according to guidelines suggested by Cameroon and Staveron [8] for food consumption studies. Measurements were done using standard measuring cups and jars. The left-overs for each child were also measured. All measurements were carried out by the researcher. The proportions of the ingredients used in cooking and the total volume of the food cooked were also measured. The nutrients consumed were then computed using the food composition tables of World Health Organization for East, South and Central Africa [9]. Interview schedules yielded information on demographic and socio-economic characteristics of households. 3.8 Data AnalysisData was analyzed both quantitatively and qualitatively. The Statistical Package for Social Sciences (SPSS) computer software was used for data analysis to generate frequencies, percentages and means in the descriptive analysis of socio-economic data. Epi Info was used to classify the school children into categories of nutritional status. Multiple regression analysis was used to establish the SLP variables which were associated with the effect SLP have on nutritional status of the study children. Food composition tables were used to compute the nutrient intake of index children. Significance was accepted at 5% probability level (P<0.05). RESULTS Demographic and socio-economic characteristics of the study children's parents The response rate was 100%. From the findings a larger percentage of respondents in both groups were females (64.4% and 75% for participants' and non-participants parents) respectively. Mean age was 40 years. Dependency ratio for this study population was 1:2 and the average household size was six people. Mean income was Kshs. 6900 ± 50.50 for participants and Kshs. 6200 ± 75.60 for non-participants. Nutritional status of the children Nutritional status was determined using weight-for-age, height-for-age and weight-for-height indices. Based on the weight-for-age index, there was a significant difference (P<0.05) in prevalence of underweight between the two groups. Only 8.1% participants were malnourished as compared to 16.3% non-participants. There was a significant association between school lunch and weight-for-age. The prevalence of underweight was much lower among the participants in the school lunch than the non-participants. The height-for-age index revealed a significantly higher (P<0.05) level of stunting among the non-participants (53.1%) than the participants (30%). There was an association between height-for-age and the school lunch. Participants had consumed the school lunch for at least two years. Adequate kilocalorie and protein intake at school was associated with reduced levels of stunting. The association was not however statistically significant. The weight-forheight index showed that 5% of the participants and 18.2% of the non-participants were wasted. Regression coefficients with school lunch variables; energy and protein intake were statistically significantly different among the two groups for weight-for-height. The prevalence of wasting was lower among participants and much higher among the nonparticipants. Dietary Quality School lunch This study focused only on two major nutrients; calories and proteins. On average, the school lunch which consisted of maize and beans in the selected schools, provided each child with 841 kilocalories, which is 33.6% of RDA and 40g of protein, which is 88.8% of RDA. On the other hand, the home lunch for the non-participants provided each child on average with 720 kilocalories, which is 28.8% of RDA and 24g of protein, which is 53.3% of RDA. The lunch nutrient intake of the participants was significantly higher than that of the nonparticipants. There was a significant relationship between school lunch and nutritional status (weight-forage and weight-for-height). The regression coefficients with school lunch variables; kilocalorie and protein intake were significant for weight-for-age and weight-for-height. Thus, higher kilocalorie and protein intake at school was associated with reduced prevalence of underweight and wasting. Home Diet Table 1 shows the mean caloric and protein intake of index children. The results indicated a significantly higher intake of kilocalories (2089 ± 12.41 Kcal) among participants than the non-participants (1841 ± 15.68 Kcal) for all the three meals. There was no significant difference in protein intake at breakfast and supper between the two groups. At lunchtime however, protein intake was significantly higher among participants (40 ± 7.2) than the nonparticipants (24 ± 1.4g). Thus, the total protein intake per day was significantly higher among participants (58 ± 7.5 g) than the non-participants (40 ± 2.4g). Lunch and supper contributed higher amounts of nutrients to the daily nutrient intake of children in both groups than breakfast. Adequacy of dietary intakeChildren in both groups took fewer calories and more proteins than the Recommended Daily Allowance (RDA). For both groups, breakfast and supper contributed less than 30% of the RDA for calories as well as proteins. For breakfast and lunch, the caloric adequacy of participants was significantly higher (24 ± 3.2% and 33.6 ± 4.3% of RDA) than that of the non-participants (20.4 ± 2.6% and 28.8 ± 5.6% of RDA). Even though the caloric adequacy at supper was not significantly (P>0.05) different between the two groups, the participants had higher intake than the non-participants. Though there was no significant difference in protein adequacy for breakfast and supper between the two groups, there was a significantly higher (P<0.05) protein adequacy for lunch, among the participants (88.8 ± 125% of RDA) than the non-participants (53.3 ± 98% of RDA). The overall caloric adequacy per day was significantly higher among participants (83.5 ± 0.4% of RDA) than among the non-participants (73.3 ± 98% of RDA). Similarly, the protein adequacy among the participants (129 ± 16% of RDA) was significantly higher than among the non-participants (88.8 ± 5.4% of RDA). DISCUSSION Majority of parents who were found at home at the time of study were females. Most men had gone to work. The dependency ratio and household size are in line with results seen in other developing countries according to the FAO/WHO report [4]. Large household sizes may have a negative effect on childrens' nutritional status due to a scarcity of resources especially food. For both groups, lunch was the most important meal and source of kilocalories and proteins for children. There was a higher intake of kilocalories and proteins at lunch time than at both breakfast and supper. The lunch nutrient intake of participants was however significantly higher than the non-participants and contributed more than 30% of the RDA. This concurs with World Health Organization (WHO) [9] food composition tables' requirement that lunch should provide at least a third of RDA. This means that the school lunch contributed significantly to the total daily nutrient intake of participants and thus played a vital role in improving the nutritional status of the participants. More emphasis was laid on lunch and supper than breakfast. The respondents explained that, once they had supper, they could perform adequately until lunch time the following day. This is also a coping mechanism that people adopt (adjusting to two or one meal per day) during food shortages and lack of money until it becomes routine although it is not appropriate for good nutrition. The difference in dietary intake adequacy between the two groups may be attributed to the fact that the school lunch provides a higher amount of calories and proteins for participants than that provided by the home lunch for non-participants. Thus, the school lunch plays a significant role in its contribution to the overall diet adequacy of the participants as it contributes more than a third of RDA of nutrients. A good quality meal will improve nutritional status, which is vital for mental development and consequently academic performance. The school lunch provided the pupils with more than a third of the RDA. School lunches should provide a third of the RDA since lunch is one of the three main meals that a person is required to eat in a day. The other two are breakfast and supper. Pollit [10] also agrees that foods provided for school age children should satisfy the high demands of rapid growth, intense physical activity and mental development. Consequently, in cases of wasted school children, SFP are required to correct moderate wasting and prevent moderately undernourished children from becoming severely undernourished. Thus, the SFP should be nutritionally adequate to achieve this objective. The lunch nutrient intake of the participants was significantly higher than that of the nonparticipants. This means that the school lunch contributed significantly to the total daily nutrient intake of participants. This may suggest that the school lunch significantly enhanced their nutritional status as compared to the non-participants. The significant relationship between school lunch and nutritional status (weight-for-age and weight-for-height) implies that the SLP has an effect on nutritional status of school children in Emuhaya Division. It leads to the acceptance of the hypothesis that nutritional status of participants is better than that of the non-participants. The large number of non-participants who were underweight as compared to participants is consistent with the findings of Hijazi and Abdulatif [11] in Jordan, where the weights of children participating in the lunch programme were significantly and generally higher the non-participants. The significant association between school lunch and weight-for-age indicates that the school lunch contributes towards better nutritional status of the participants. This supports the hypothesis that nutritional status of participants as determined by weightfor-age is better than that of the non-participants. The lower prevalence of underweight as compared to that of stunting correlates well with the ACC/SCN [1] report where underweight, due to chronic under nutrition or wasting was found to affect fewer children globally than stunting. The prevalence of stunting among the non-participants was higher than the national rate. Findings of Kenya Demographic Health Survey (KDHS) [12] revealed that stunting, a feature of chronic under nutrition, is the most prevalent presentation of malnutrition with a current national rate of 33%. Similarly, ACC/SCN [1] reported that an estimated 32.5% of children in developing countries are stunted. Thus, the prevalence in the area of study indicates a need for intervention. In his research agenda of 2005, Corvina [13] also agrees that there's need to develop interventions to confront undernutrition. The significantly higher levels of stunting among the non-participants in the area of study as compared to the participants indicates that the school lunch may have played a big role in reducing levels of stunting among participants. Since stunting is a long-term deficit, this implies that non-participants could have suffered food deprivation for a long time. Participation in the school lunch could thus reduce levels of stunting among them. In his Samburu study, Kielmann [14] obtained similar results where high levels of stunting were recorded among school children aged five to fifteen years. A study carried out by Sigman et al. [15] in Embu District, Kenya, on school children aged seven to nine years also showed that 25% of the sample was stunted. Consequently a large study of anthropometric status of rural school children conducted in low-income countries of Africa found an overall prevalence of 34% to 62% for stunting [1]. A study in Brazil of the gender differences in growth of school children suffering from helminthes infections found that 21% of the children were stunted [1]. Kimati [16] reported similar results in Tanzania. The higher prevalence of stunting as compared to that of underweight is in line with the ACC/SCN report [3] of 2000 where the prevalence of stunting (39.4%) in sub-Saharan Africa was higher than that of underweight which was 27.9%. It was on average 11.5% points higher than the prevalence of underweight. The association between height-for-age and the school lunch did not reach statistical significance unlike the association between the school lunch and both weight-for-age and weight-for-height. This may be explained by the fact that children who are stunted in early life may attain normal weight later but remain short. Only 5% of the participants were wasted as compared to 18.2% of the non-participants. These results compare well with those of Kielmann's Samburu study [14], which also showed high prevalence of wasting among school children aged five to fifteen years. The prevalence of wasting however was not as alarming as that of stunting. This is consistent with the FAO/WHO findings [4] where, inferences drawn from the national nutrition surveys seem to suggest that, nutritional wasting or acute malnutrition affects only a small proportion of the child population, although nutritional stunting or chronic malnutrition is fairly prevalent in the country. The high levels of wasting among the non-participants may be linked to food shortages in the area of study. ACC/SCN [1] reported similar observations that wasting is not as common as stunting and underweight among school-aged children in developing countries. Nevertheless, wasting rates can change rapidly in situations of acute food crisis, with school-aged children becoming severely malnourished in such situations [17]. The effect of the feeding programme is evident from the observation that the wasting prevalence was significantly higher among non-participants than participants. In fact, more than three times non-participants were wasted than participants. Nevertheless the association between the school lunch and weight-for-height was significant. This supports the hypothesis that the nutritional status of the participants is better than that of the non-participants as determined by weight-for-height. This could be due to the significantly higher amounts of nutrients taken at lunch by participants as compared to the non-participants. This is true because children in both groups took an almost similar amount of nutrients at home during breakfast and supper. It may therefore suggest that the higher lunch calorie and protein intake placed the participants at a greater advantage nutritionally than the non-participants. This concurs with the FAO/WHO report [18] that SFP should be geared towards improving the nutritional status of school children. CONCLUSIONS AND RECOMMENDATIONS The prevalence of malnutrition as determined by weight-for-age, height-for-age and weightfor-height was significantly higher among the non-participants than the participants. The school lunch provided more calories and proteins to participating children than that provided by the home lunch to non-participants. There was a significant association between the school lunch and nutritional status. The SLP in Emuhaya division, Vihiga District therefore plays a vital role in improving the nutritional status of participating children and thus should continue to be part of the school programme. The government should extend the sponsored SFP to Vihiga District since this is an area that experiences food shortages almost throughout the year, affecting the nutritional status of school children. There may be need to establish whether improved socio-economic status can enhance greater participation of parents in the school lunch. Finally, all parents and schools in Vihiga District should be encouraged to venture into this programme of school lunch because of its positive outcome on nutritional status of school children. ACKNOWLEDGEMENTS The first author is grateful to Prof. Mary Walingo and Dr. Grace Mbagaya for their patience, valuable insights and devotion to this work. All primary school head teachers, pupils and their parents who participated in this study are appreciated. Above all, thanks to God Almighty for sufficient grace, strength, everlasting providence, sustenance and unfailing love. REFERENCES
© Copyright 2007 - Rural Outreach Program The following images related to this document are available:Photo images[nd07048t1.jpg] |
| |||||||||
