 |
| About Bioline | All Journals | Testimonials | Membership | News |
|
||||||
|
||||||
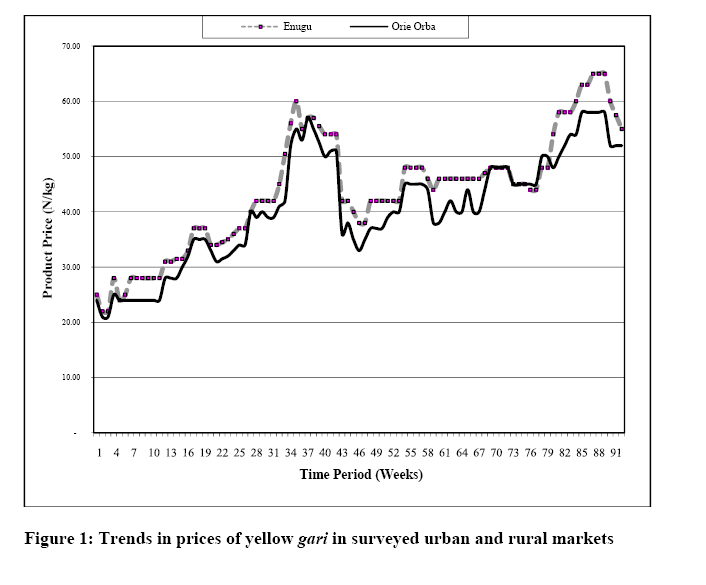
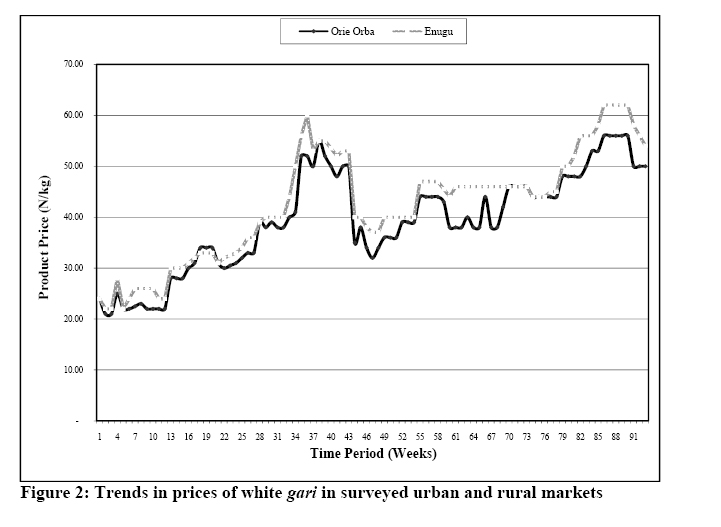
African Journal of Food Agriculture Nutrition and Development, Vol. 7, No. 6, 2007 PRICE TRANSMISSION BETWEEN SUPPLY AND DEMAND MARKETS FOR CASSAVA-BASED PRODUCTS: A COINTEGRATION ANALYSIS FOR gari IN ENUGU STATE, NIGERIA Ifeanyi A. Ojiako1* and Chuma Ezedinma1 *Corresponding author: Email: i.ojiako@cgiar.org 1International Institute of tropical Agriculture Ibadan, Nigeria Code Number: nd07055 ABSTRACT The theory of demand and supply implied a positive relationship, or price information transmission between the supply and demand markets for products. Using cointegration analysis and weekly data from week 37 in 2004 to week 26 in 2006, a long-run equilibrium relationship was investigated between the prices for the yellow and white varieties of gari, a granulated dry food product processed from cassava roots, in a typical rural (supply) and urban (demand) markets in Enugu State of south-eastern Nigeria. The Augmented Dickey-Fuller (ADF) test was used to check for stationarity in the pairs of prices while the Engle and Granger two-step procedure was used to test for cointegration of the markets. Results revealed that, although yellow gari sold for relatively higher prices than the white gari in both the rural and urban markets, the market prices were significantly positively correlated for the two products. The tests for unit roots revealed that the different price series were individually nonstationarity while the pair of prices for each product was integrated of order one. The ADF test statistics were calculated as -1.63 and -1.59 in levels and -9.45 and -8.35 in first differences for yellow gari. The statistics were also calculated as -1.69 and -1.56 in levels and -10.57 and -9.10 in first differences for white gari in the studied rural and urban markets. The results revealed further that the rural and urban markets were cointegrated with t-statistics calculated as -4.09 for yellow gari and -4.20 for white gari. Changes in prices in one of the markets reflected similar long-term changes in prices in the other. The error correction model did not, however, reveal any significant causality link between the peripheral and central markets, suggesting that there were no clear trends in price leadership between the markets. On the whole, the study had established that there could be efficiency in the transmission of price information among the operators of the traditional food markets in Nigeria. The implication was that the development of the cassava agro-industrial sector might need to generate its own source of raw materials to guarantee food security in Nigeria. Keywords: Co-Integration, Cassava, gari, Markets, Prices INTRODUCTION Price is an important variable in the food demand and supply chain. Apart from serving as signals of both food availability and food access for producers and consumers, prices provide a snapshot of current and expected supply of a commodity. Among other functions, prices help to express the value of a product, provide information on its level of supply in a market and on the marketing agents' perception of the product's future supply and demand, while at the same time act as either an incentive or disincentive for trade and production [1]. It is expected that if the market for a product is efficient, a change in the product's price in a typical rural source market will be followed by similar change in price in the urban market, which is the destination point of the product. The co-movement among related price series implies that a long-run equilibrium relationship should be anticipated between the prices or that the price series are cointegrated [2]. The main objective of this paper is to determine the linkages between the market prices of gari, a granulated dry food product processed from cassava roots, in a typical rural supply market and a typical urban destination and demand market in Nigeria, using cointegration analysis. Gari is perhaps the most popular cassava-based food security product, which has gained the status of an urban-convenient food in Nigeria [3]. Although primarily processed in the rural communities, where it provides employment for millions of rural women, the major gari consumption markets are found in the urban and semi-urban city centres across Nigeria. In a recent investigation, it was found that gari was traded in all the major urban markets and these urban markets are supplied by 90% of the rural markets in the major cassava producing regions of Nigeria [4]. Gari usually comes in two colours, the yellow and white gari. Traditionally the two types of gari can be produced from the same cassava, but the addition of red (palm) oil to the cassava paste before frying helps to achieve the yellow colour of gari. Addition of red oil helps to increase the vitamin A content of gari, but can also slightly reduce its storability. Recently, scientific research by cassava scientists in the International Institute of Tropical Agriculture, Nigeria, has led to the release of some pro-vitamin A cassava clones, including Tms 01/1368, Tms 01/1663, and Tms 01/1371, which have carotenoid contents of 7.34, 7.10, and 6.92 micrograms per gram (µg/g) respectively. These germplasms belong to the family of the 'yellow root cassava' that can be used by farmers to produce yellow gari without adding the red oil. One of the advantages of the new technology is that it reduces the cost of production of yellow gari for the farmer or processor. Moreover, the gari produced from the yellow roots is more durable and contains high-quality vitamin A. At the level of the consumer in the market, it has not been easy to distinguish the yellow gari prepared with red oil and that made from the yellow roots. In general, the yellow gari commands a relatively higher market price and is also slightly preferred to the white gari, especially in the southeast area of Nigeria where this study was conducted. METHODOLOGY The study area Two markets were used for the study: the rural market is the Orie Orba Market (located at latitude 6.856o and longitude 7.459o) in Nsukka senatorial district and the urban market is the Ogbete Main Market (located at latitude 6.43445o and longitude 7.48488o) in Enugu City, both in Enugu State of southeastern Nigeria. Rapid appraisal of markets for cassava-based products showed that traders from Enugu city market purchased 80-90 percent of the yellow and white brands of gari produced and sold by farmers in Orie Orba. By implication whereas Orie Orba was a rural source (supply) market, Ogbete Market in Enugu was an urban destination (demand) market for gari in the products' supply-demand chain. Price data The market information service (MIS) unit of the Integrated Cassava Project (ICP) of IITA documents weekly market prices for over 20 Nigerian agricultural commodities collected from about 50 urban and rural markets in Nigeria. Price data for the products are available on the ICP website http://www.cassavabiz.org since 2004. The available prices include those of yellow and white gari brands for different rural and urban markets, including Orie Orba and Enugu main markets. For this study, a total of 93 weeks, starting from week 37 of (September) 2004 to week 26 of (June) 2006 were used in the analysis. The trends in the weekly prices in the rural source and urban destination markets are shown in Figure 1 for yellow gari and Figure 2 for white gari. The two sets of prices had a slightly positive longrun trend. Correlation Analysis Suppose pyr and pyu are the rural supply and urban demand market prices of a product, y, correlation analysis of the prices in the markets, has become the most common approach to measuring co-movement of prices, which underlie the intuitive idea of market integration, owing to its simplicity [5]. The use of the correlation tool relates to the idea that integrated markets display prices that move together [5]. The analysis was based on the Pearson's product moment correlation coefficient for the rural and urban market prices of gari ( rur) while the test statistic was used to ascertain if the coefficient between prices in the markets was statistically different from zero. Cointegration tests The fundamental aim of co-integration analysis is to detect any common stochastic trends in economic data series, and to use these common trends to conduct a dynamic analysis of correlation returns. The term cointegration refers to statistical implication of long-run relationship between economic variables [6]. A long-term relationship implies that the two cointegrated prices move together overtime so that short-term disturbances from the long-run trend can be corrected [7]. Absence of cointegration suggests absence of long-run relationship between the two prices of interest, implying in principle that they can wander arbitrarily far away from each other [8]. A set of non-stationary prices is cointegrated if some linear combinations of the prices are stationary [2]. The investigation of stationarity or nonstationarity in a time series is closely related to the tests of unit roots since existence of unit roots in a time series denotes non-stationarity [9]. In which case the ordinary least squares (OLS) estimator is not normally distributed. In the case of the price of yellow gari (py), suppose we have an (k+1)th order autoregressive time series given as:
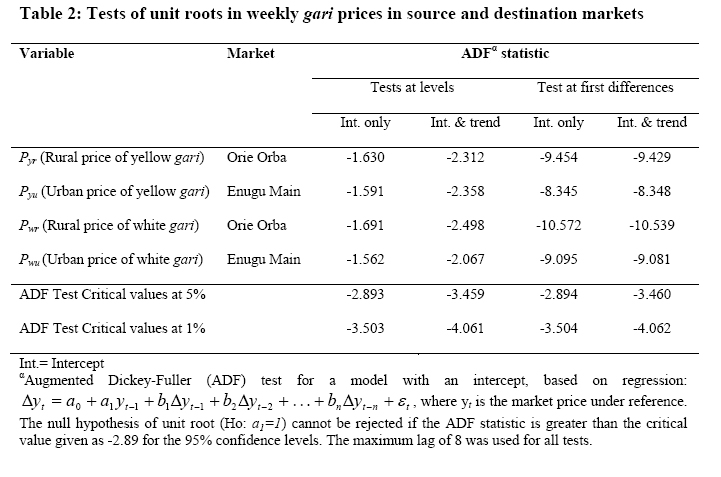
where py(t ) is the price of gari in current period, py(t-i) for i=1,…,k+1 are prices lagged by one through k+1 periods, ais , i=1…k+1 are parameters to be estimated and et is the error term. The price series, py(t ) , is said to be stationary if all the characteristic roots associated with equation (1) are less than one in absolute value. If, however, a unit root exists, py(t) is said to be non-stationary. Having a unit root means that the sum of the autoregressive parameters is one, implying that, we can test for a unit root by testing whether the sum of the autoregressive parameters is one. Figure 1 and 2 suggest that the urban and rural markets' price series for the two brands of gari were not stationary. To test for stationarity or otherwise of the products' prices series, we applied the Augmented Dickey-Fuller (ADF) test [10]. This was based on the parameterized model of equation (1) stated with intercepts for as:
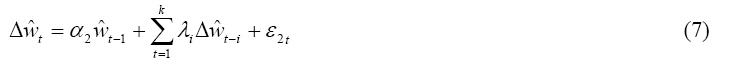
where pyr(t) and pyu(t) are respectively the rural source and urban destination market prices of yellow gari, ∆ refers to the difference operator, implying that ∆pyr(t ) = pyr(t ) - pyr(t-1) and ∆pyu(t ) = pyu(t ) - pyu(t -1) ; δ= (a1 + a2 + ... + ak +1) -1 and φk =-ak +1 - ... - ap+1 are parameters to be estimated and e1t and e2t are the error terms. Similar set of equations was also estimated for white gari. We obtained the estimators by respectively regressing ∆pyr(t ) on pyr (t-1) , ∆pyr (t-1), ∆pyr(t-2),, ..., ∆pyr(t-k )or ∆pyu(t)on pyu(t-1) , ∆pyu(t-1), ∆pyu(t-2), . . ., ∆pyu(t-k ). The tstatistic of the ordinary least squares estimator of δ 1 is the test statistic for the unit root test. The null hypothesis of non-stationarity, or unit root (δ 1=1), was accepted at the 0.05 levels if the ADF statistics exceeded the critical value of -2.89. The practical rule for establishing the lag length (k) is that number of lags should be relatively small so as to save degrees of freedom, but large enough not to allow for the existence of autocorrelation in the error term [9]. In this study, we set the order of the autoregression at k=8 to avoid over-parameterization of the unit root test and consequently give the test greater statistical power [10]. If non-stationary was established in each of the price series, we would proceed to testing if the series were cointegrated. This was achieved using the residuals ( ut ) in the long-run regression models stated below [11, 12]: pyr (t ) =µ0 +µ1 Pyu (t) + ut (4) Pwr (t ) =µ0+µ1Pwu(t)+ wt(5) Equation (4) is the long run relationship of the rural and urban prices for yellow gari while equation (5) is for white gari. Pyr(t) and Pwr(t) are the prices of yellow and white gari in the rural source market, Pyu(t) and Pwu(t) are the prices in the urban destination market, and ut and wt are the error terms. Equations (4) and (5) are called the cointegrating regression. Cointegration was rejected if by replacing Pyr(t) and Pwr(t) in the autoregressive equations (2) and (3) by the residuals, ut and wt from equations (4) and (5) we find that the coefficient of the lagged residual is not significantly different from one [10]. The models are given respectively for yellow and white gari as:
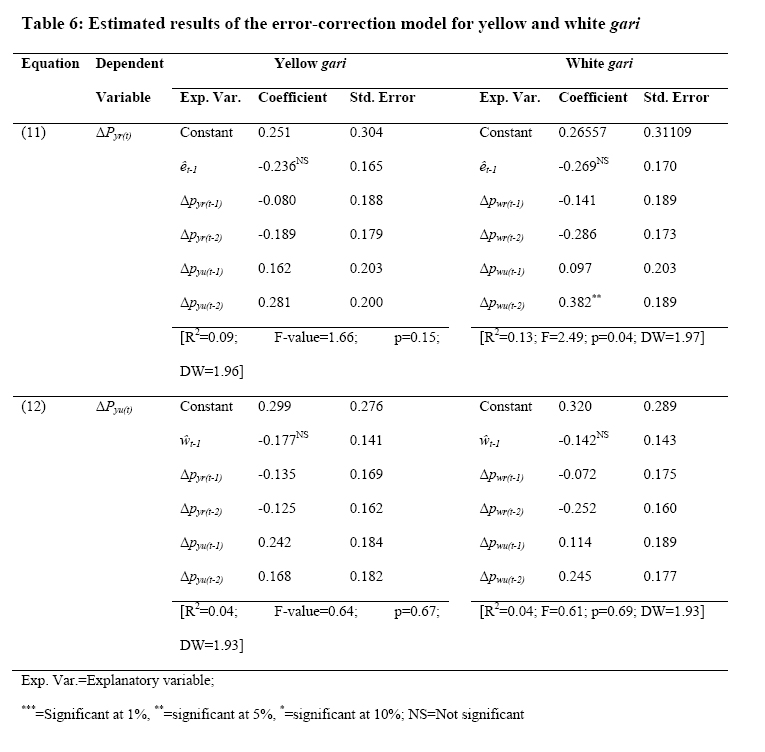
where ût and ŵt are the retained residuals, αs and γs are unknown parameters to be estimated and εts are error terms. The models are used to test H0: α=0 against H1: α<0 using appropriate critical values. By implication, the null hypothesis of the cointegration test is that the series formed by the residuals of each cointegrating regressions are not stationary. It was observed that the cointegrating regression had no intercept or time trend since the error term must have zero mean [9]. Vector autoregressive model and causality tests If it followed from the cointegration tests that the pair of non-stationary price series was not cointegrated, it became justified to build the vector autoregressive (VAR) models in the first price differences to describe the dynamic relationships between the variables and use them for the causality tests [12]. Details and process of deriving the VAR models from the economic theory of demand can be found elsewhere [10]. The VAR models are estimated by OLS while the test of causality of the urban price on the rural price of gari is equivalent to the test of the null hypothesis that the coefficient of the lagged urban price in the rural price equation is zero. The simple F-ratio, which compares the restricted and the unrestricted models, is usually used for the causality test. The decision rule is that if the calculated is less than the tabulated F, the 'urban price Granger causes the rural price of gari', otherwise the 'rural price Granger causes the urban price'. If the urban price causes the rural price and the rural price causes the urban price, then a feedback relationship exists between the two prices and causality is in Granger's sense or in the sense of predictability [10]. The vector error correction model If, however, cointegration were concluded in relation, then the vector error correction model (VECM) would be estimated. Error correction models are based on the behavioral assumption that two or more time series exhibit an equilibrium relationship that determines both short- and long-run behavior [11]. It has been shown that if pyu and pyr are cointegrated, then there exists the VECM representation of the dynamic system governing their joint behavior overtime [12]. This is because the error correction model tells us the degree to which the long-run equilibrium behavior drives short-run dynamics [11]. The relationship between cointegration and error correction is demonstrated in the Granger Representation theorem, which states that an error correction model representation for a set of variables that are integrated of order one implies cointegration among the variables and vice versa [13]. The estimated models are of the forms:
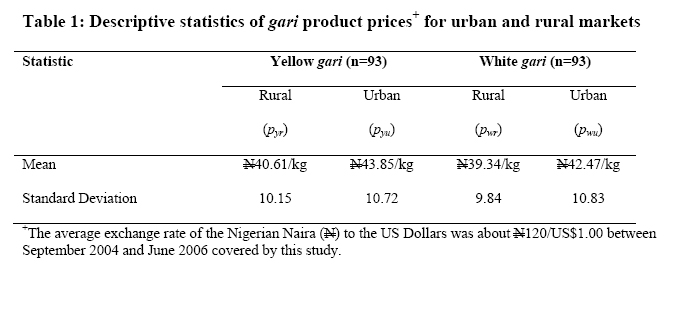
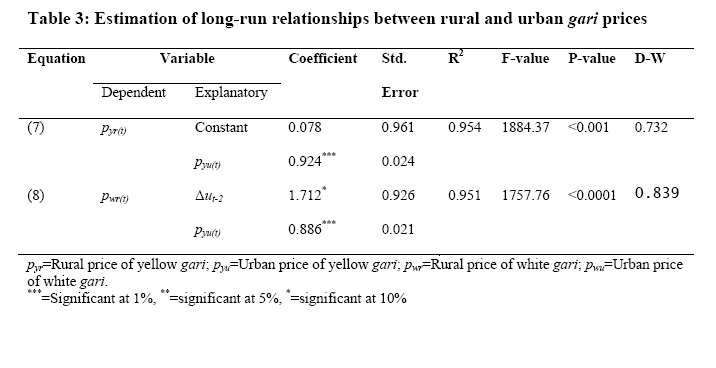
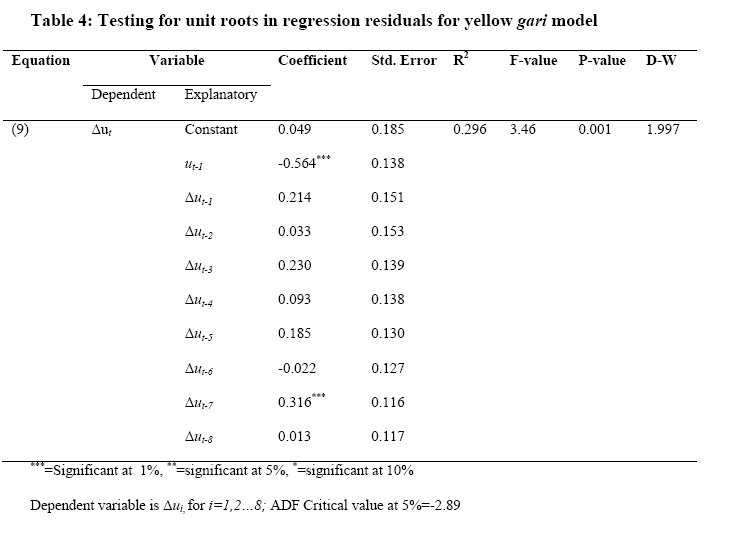
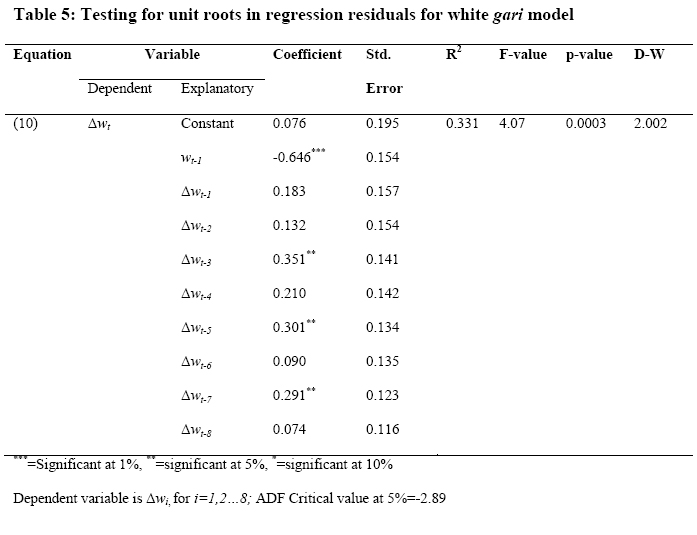
where the δs, αs, βs ψs, and ζs are unknown parameters to be estimated, ∆pyr(t ) and ∆pyu(t) respectively represent the first differences in prices of gari in the rural source and urban destination markets, k is the lag length, ûyr and ŵ yu are previous period's equilibrium errors, that is the residuals from the cointegrating regression, and vt denotes white noise error, with zero mean, constant variance-covariance between v1t and v2t, and zero autocorrelation. Models (8) and (9) are estimated as to maintain the models parsimonious and receive the vt as white noise. However, of particular interest from the outcome of the VECM are the parameters αy and αw, which are the 'error correction terms' because they estimate the speed at which the series returns to equilibrium, that is, the correction of the discrepancy between the actual and the long-run changes in gari prices. RESULTS Descriptive statistics Two pairs of price series were analyzed: a pair each for yellow and white gari in the rural source and urban destination markets. The descriptive information on the price series is presented in Table 1. The rural average price of yellow gari was The correlation coefficients were calculated as 0.98 between the rural and urban market prices of both gari products. Both coefficients were significant at less than 0.01 levels. This high correlation, further corroborated by the trends in the price series shown in Figure 1 and 2, suggests the likelihood of existence of long-run relationship between rural and urban price series for each of the gari products in the two market prices. This was consequently subjected to further investigation using the cointegration analysis. The first step is to test for stationarity or nonstationarity in the price series or simply to determine if there are unit roots. Presence of unit roots - ADF-test The Augmented Dickey-Fuller (ADF) method was used to test for existence or non-existence of unit roots in the data series. The null hypothesis of non-stationarity or presence of unit roots could not be rejected for all price series. As presented in Table 2, the ADF test statistics calculated at levels for the price series of yellow gari was -1.63 for the rural market and -1.59 for the urban market. The values in first differences were -9.45 and -8.35 respectively. In the case of the price series for white gari the ADF test statistics calculated at levels were -1.69 for the rural and 1.56 for the urban markets. In their first differences, the statistics were calculated as -10.57 and -9.08 respectively for the two brands of gari. When compared with the ADF test critical values given as -2.89 at 5% levels for a model without intercept, the results reveal that all the series were non-stationary and integrated of order one, that is, they were I (1) series. This result is necessary and sufficient for a test of cointegration of the price series. Presence of co-integration Applying the Engle and Granger two-step procedure, cointegration between the rural and urban market prices were tested. First, a 'long-run relationship' was regressed for the prices in the two markets using OLS. The results based on the relationships in equation (5) for yellow and equation (6) for white gari is presented in Table 3. In the second step, the residuals from the relationships in the regression models were extracted and the ADF test applied on the residuals to test for existence or otherwise of unit root in the resulting series. The ADF critical value for a model with an intercept is also given as -2.89 at 5% significance level. The regression results are presented in Table 4 for yellow and Table 5 for white gari. The ADF test statistics for cointegration between Orie Orba rural and Enugu urban markets prices for yellow gari at levels was calculated as -4.09. In the case of white gari the ADF test statistics for cointegration at level was -4.20 for the rural and urban markets. Tests at first differences reveal higher t-values for both sets of prices. It shows that for both products, the 5% critical values were lower (in absolute terms) than the calculated t-values. We reject the null hypothesis of nonstationarity and conclude that there is long-run relationship between the rural and urban market prices for the two types of gari products. The results mean that there is evidence of significant cointegration between the prices of the two grades of gari products. The vector error correction model If cointegration had not been concluded in the series, Granger's causality test would have been modeled to build the vector autoregressive (VAR) models in the first price differences and consequently describe the dynamic relationships between the variables and use them for the causality tests. However, since cointegration link was concluded we proceed to constructing the error correction model to estimate the short-run deviations of the prices series from the long-run equilibrium based on equations (8) and (9). To control for the objective of making the residual (vt) a white noise, the residuals were checked for serial correlation. The results obtained from fitting the model are presented in Table 6 for the two products. The lag length was set at k = 2. None of the parameters αy and αw associated with the lagged residual (êt-1) was found significant in any of the two models. DISCUSSION Table 1, which presents results of the descriptive analysis, shows that the rural average price of yellow gari was higher than the rural average for white gari. It reflects a difference of 3.18% implying that on the average yellow gari tends to be relatively more expensive in both the rural and urban markets. Between the rural source and urban destination markets, the averages of 7.67% and 7.65% observed for the two gari product types could reflect the marketing agents' margins. It has been succinctly argued that considering the high cost of transactions and the risk to invested capital that these agents' margins are often reasonable [1]. The high and significant correlation of the price series calculated as 0.98 and reflected in Figure 1 and 2 is an indication of co-movement in the prices. The ADF tests presented in Table 2 led to the conclusions that each of the series was non-stationary and integrated of order one, I(1). Also, cointegration was concluded leading to the construction of the ECM to estimate the short-run deviations of the prices series from the long-run equilibrium. Results show that the error correction coefficients exhibit insignificant biases in the estimators. By implication, the estimated rate of price reequilibration was not significantly affected by departures from the unit roots or degree of simultaneity. The results suggest that although cointegration existed between the price series, no significant causality link could be established from either the rural to the urban market or vice versa. This implies that price information flow could originate from any of the markets since the markets cannot be segmented. Internally and externally determined factors may cause price changes in either the rural or the urban market but because the markets are cointegrated, efficiency can be achieved in transmission of price information in the two markets. CONCLUSION This study investigated the long-run relationships in the prices of two popular cassava-based food security products, yellow and white gari, in typical urban demand and rural supply markets in Nigeria. Results revealed that the rural and urban market price series for both product types were positively and significantly correlated. Both cassava products were also non-stationary and cointegrated implying that changes in prices in one of the markets reflect similar changes in the other. These finding suggests that efficiency could be achieved in the transmission of price information among the operators in the two markets for cassava-based products especially for white and yellow gari. Although significant directional causality link could not be established in price information flow between the two markets, the presence of cointegration is an indicative of interdependence in the price series and the markets cannot be segmented. It goes to say that the development of the cassava agro-industrial sector may need to generate its own source of raw materials to guarantee food security. REFERENCE
The following images related to this document are available:Photo images[nd07055t6.jpg] [nd07055f1.jpg] [nd07055t4.jpg] [nd07055t2.jpg] [nd07055f2.jpg] [nd07055t5.jpg] [nd07055t3.jpg] [nd07055t1.jpg] |
| |||||||||


