 |
| About Bioline | All Journals | Testimonials | Membership | News |
|
||||||
|
||||||
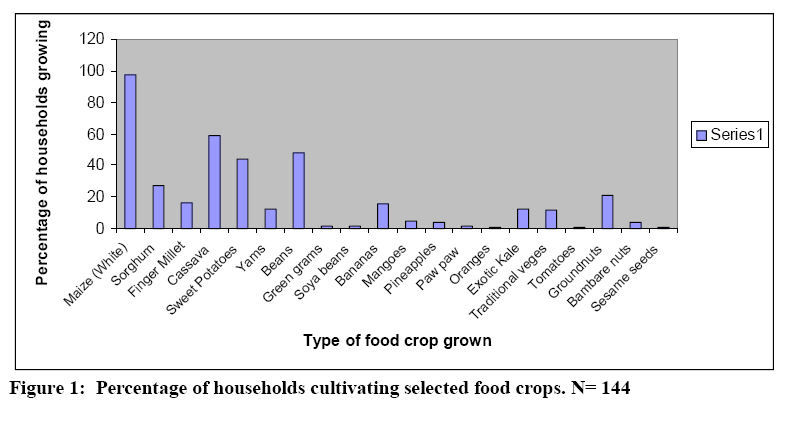
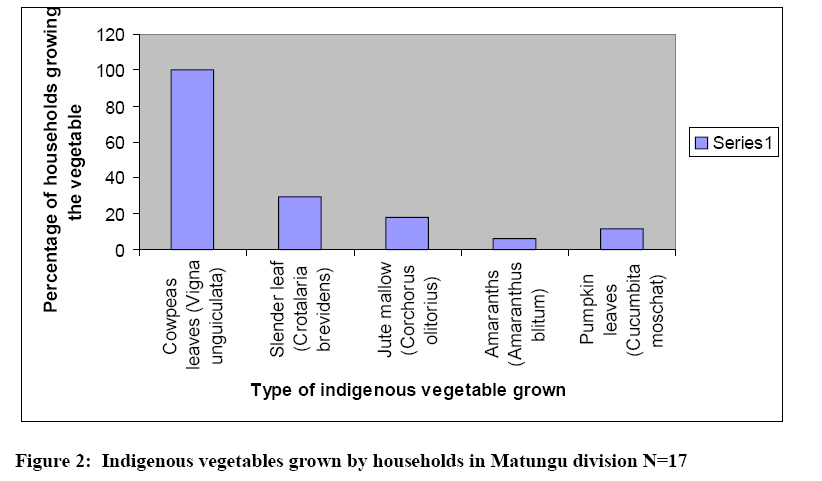
African Journal of Food Agriculture Nutrition and Development, Vol. 8, No. 4, Dec, 2008, pp. 390-404 Influence of agricultural biodiversity on dietary diversity of preschool children in Matungu division, Western Kenya Ekesa BN*1, MK Walingo2 and MO Abukutsa-Onyango3 . *Corresponding author email: nakhauka@yahoo.com Code Number: nd08036 ABSTRACT Agricultural biodiversity encompasses the variety and variability of plants and animals that are necessary for food production and accessibility. Loss of agricultural biodiversity is taking place at a very high rate in Kenya. Many indigenous species that are not only nutritious, but also adapted to harsh conditions are now associated with poverty or backwardness. This profound change has great effect on preschool children in Kenya. Their diets are predominantly based on starchy staples, little or no animal products and few fruits and vegetables thus inadequate in quality and quantity resulting to malnutrition. The main objective of this cross-sectional survey was to determine the influence of agricultural biodiversity on dietary diversity of preschool children in Matungu division, western Kenya. A sample of 144 households with preschool children was drawn from Matungu division using multistage,proportional and systematic random sampling techniques. Structured questionnaires and observation checklists were used for data collection. Agricultural biodiversity was measured by variety of food crops grown, types of animals domesticated for food and food items obtained from natural sources. Dietary diversity was measured by the number of food items across eight food groups with a reference period of 7 days. Data were analyzed using Statistical Package for Social Sciences (SPSS). Frequencies, means and percentages were used to organize, describe and summarize data whereas Pearson’s correlation coefficient (r) was used to test for statistical associations between agricultural biodiversity and dietary diversity. Research findings showed that households grew an average of three types of food crops kept two varieties of animals for food and got two food items from natural sources. Preschool children had consumed on average 13 varieties of foods in the one-week preceding the study. The findings also revealed a positive and strong relationship between agricultural biodiversity and dietary diversity (r= 0.704) indicating that 50% of the changes in dietary intake could be attributed to changes in agricultural biodiversity. Therefore, increased agricultural biodiversity enhances dietary diversity of preschool children leading to improvement in their nutrition and health status. It was therefore recommended that the Ministry of Agriculture and related organizations reinforce extension services (training/education on agricultural biodiversity and sustainable utilization of neglected indigenous food sources) to rural populations especially women. KEY WORDS: agricultural biodiversity, dietary diversity, children INTRODUCTION Loss of agricultural biodiversity through the extinction of species, degradation of natural habitats and intensive modern agriculture based on a few breeds of animals and plants is occurring throughout the world at unprecedented rates [1]. Today 75% of the world’s food is generated from 12 plants and five animal species. Currently only 250,000 to 300,000 plant species are known. Of these, only 4% (10,000) are edible and man only eats 1.5% - 2% (150 to 200) of these plants [2]. Local species are not only numerous, fulfilling a variety of needs and adapted to different conditions, but also genetically variable, [3] The decreased agricultural biodiversity has led to simplification and decrease in diversity of diets of a large number of people to a limited number of energy foods that do not confer nutrients in the required amounts. Many traditional foods like millet, sorghum, sweet potatoes, indigenous vegetables, mushrooms and wild fruits are now associated with poverty and backwardness. These indigenous sources are also notably disregarded in the agricultural development agenda even though they show significant potential in enhancing nutrient security. If harnessed, these sources can cheaply improve food security and nutritional status among poor families in developing countries [4]. Besides providing essential nutrients, diversifying local diets and helping nourish children, these foods are rich in a variety of micronutrients like vitamin A, vitamin C, iron, zinc and calcium. These micronutrients enhance the immune system thus fighting diseases and infections like diarrhea, acute respiratory infections, malaria and tuberculosis that are the major causes of child mortality in developing countries [5]. The decreased agricultural biodiversity has led to decrease in variety of animals reared and food plants grown by households [6]. It has also led to simplification and decrease in diversity of diets of a large number of people to a limited number of energy foods that do not confer nutrients in the required amounts. An accompanying decline is in the variety of vegetables and fruit species consumed [7]. Despite the links between agricultural biodiversity, and dietary diversity and the fact that a diversity of food items mutually reinforce each other’s nutrition benefits [8], there are major gaps in knowledge on the importance of agricultural biodiversity conservation in relation to dietary intake and nutrition status. Relatively few studies have investigated the relationship between overall agricultural biodiversity and dietary quality [1, 7]. The objective of this study was to find out the relationship between agricultural biodiversity and dietary diversity of meals consumed by preschool children in Matungu division of western Kenya. METHODOLOGY This was a cross-sectional survey that incorporated both quantitative and qualitative analyses. The study was carried out in Matungu division ofestern Kenya. The main cash crop produced in the region is sugarcane (68% of arable land), and main food crops produced in order of importance are; maize, beans, sweet potatoes, cassava, sorghum, & finger millet, and groundnuts. The division has been facing a rising trend in poverty as 60% of the people are absolutely poor and the major reason given is over-reliance on one cash crop (sugarcane) [9]. The study involved households in Matungu division that had preschool children. Using the fisher’s formula a sample of 144 households was arrived at. Multistage sampling was used to obtain samples from the location level up to household level. Villages were sampled randomly, households with preschool children were listed and systematic sampling was used to come up with a proportional sample of 144 rural households. Structured questionnaires, Food checklists, Food Frequency questionnaires, and observation checklists were used for data collection. Agricultural Biodiversity was measured by the variety of food crops grown, animal reared for food and food items obtained from natural habitats such as hunting gathering and trapping by the households with preschool children. In developing countries single food or food group counts have been the most popular measurement approaches for dietary diversity, probably because of their simplicity [10]. Dietary diversity was therefore measured using a methodology employed by Ogle, Hung, and Tuyet (2001). This method considers the number of individual foods consumed (Food Variety Score) with a specific reference period. In this case the reference period was 7 days. The variety of food items was drawn from a possible total of 42 different food items. The possible total (n= 42) reflects all the different types of food items eaten by this sample of preschool children. Consumption of more than 23 different food items was considered as high dietary diversity, consumption of between 18-22 was moderate dietary diversity, 13-17 was low dietary diversity while <13 was very low dietary diversity [11]. Data was summarized using tabled charts and graphs. Pearson’s correlation was used to quantify the relationship between agricultural biodiversity and dietary diversity. RESULTS Agricultural biodiversity Agricultural biodiversity encompasses the variety and variability of animals, plants and micro-organisms which are necessary to sustain key functions of the agro-ecosystem, its structure and processes for, and in support of, food production and food security [12]. Therefore, information on variety of food crops grown, animals reared for food and food items obtained from natural sources was obtained and used in determining agricultural biodiversity. Food crops grown by households are shown in figure 1. White maize was the most popular food crop with 97.2% of the 144 interviewed households growing it (figure 1). Although other findings have indicated that beans are the second popular crop, this study found that cassava was still popular among most households (59%). Kenyan traditional pre-colonial staples like sorghum and finger millet were grown by less than 30% of the population and no household grew brown maize. Beans came third followed closely by sweet potatoes, groundnuts, bananas, kale, yams, and indigenous vegetables. All the other food crops combined were grown by less than 30% of the households. Of the 144 households only 11.8% (17 households) grew indigenous vegetables (figure 2). There were only five varieties of indigenous vegetables being grown by the 17 households; Cowpea leaves (Vigna unguilata) were the most popular, followed by slender leaf (Crotalaria brevidens), jute mallow (Corchorus olitorius) and amaranths (Amaranthus blitum). Domesticated animals are major sources of proteins for households and they can also be used for commercial purposes. The findings of this study showed that households in Matungu division were keeping a total of nine varieties of animals (see table 1), that could be used as food. Chickens were being reared by majority of the households (70.1%). Cattle were being reared by 49.3% (indigenous cattle 48.3%, hybrid cattle 7.6%) of the population and fish was being reared by only 0.7% of the households (Table 1). Table 1: Distribution of animals reared for food among households. N= 144
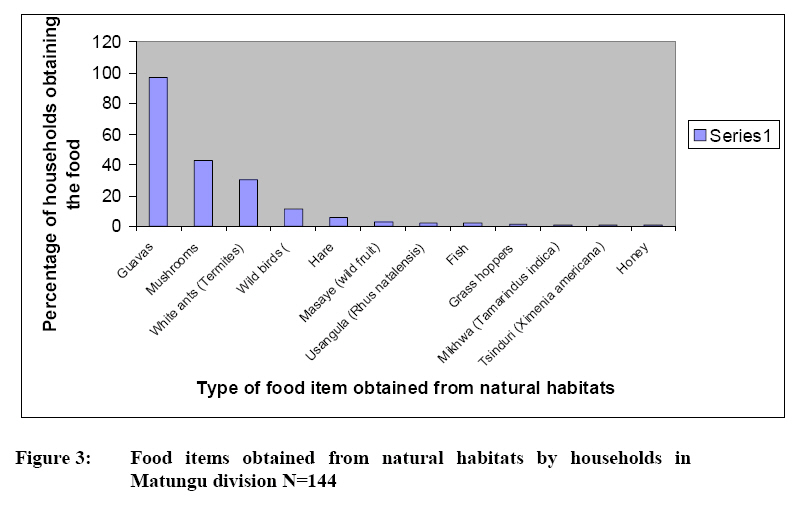
The research findings showed that although hunting was not being practiced gathering and trapping of food items was taking place (fig 3). About 97.1% of the households had gathered guavas, this could be because they were in season and guva trees are commonly found in this .Mushrooms were gathered by 43.1% of the households, while 30.1% and 11.1% of the households trapped termites and wild birds, respectively. About 6.3% of the households gathered wild fruits. Although caterpillars, mole and giant rats were initially trapped and used as food, the findings of this study showed that only grasshoppers (1.4%) and white ants (30.1%) were trapped for food (figure 4). Households obtained on average 2 varieties of food items from their natural habitats. The summary in Table 2, shows reduced agricultural biodiversity. The variety of food crops grown, animals reared and food items obtained from natural habitats was limited. On average it was found that households grew three food crops, kept two animals for food and obtained two varieties of food items from natural habitats. Most rural households depend on agricultural biodiversity as their major source of food. Table 2: Agricultural biodiversity of Matungu division, N= 144.
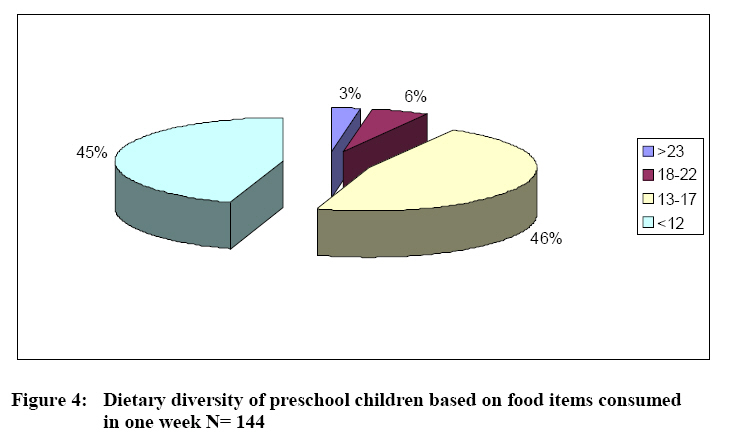
Dietary Diversity The findings on dietary diversity of meals consumed by preschool children are presented in Fig. 4 These findings were based on the number of different food items consumed within a period of one week. Although dietary diversity is widely recognized as a key element of high quality diets [1,12], only 3% of the preschool children had consumed highly diversified diets while 45% of the preschool children had very low dietary diversity. Eight food groups were considered in the study were: Breads and Cereals, Roots and Tubers, Pulses and Nuts, Vegetables, Fruits, Meat and Meat Products (included fish), Milk and Milk Products and Fats and Oils. The food groups with the highest frequency of consumption were Breads and Cereals and Vegetables with 100% of the children having consumed foods from these groups. 60.4% and 49.3% of the preschool children had consumed more than 3 varieties of vegetables and breads and cereals respectively (Table3). The major method of cooking vegetables was boiling without fat. The least consumed food groups were meat and meat products, pulses & nuts and lastly milk and milk products. The findings indicated that 21.5% of the preschool children had not consumed any pulses or nuts, 11.8% had not consumed any meat or meat product, and 30.6% had not taken any milk or milk product for the one-week period (Table 3). Table 3: Percentage of Preschool Children in Relation to Consumption of Foods from the Eight Food Groups
Relationship between agricultural biodiversity and dietary diversity By use of linear regression, dietary diversity (the number of different food items consumed in one week) was correlated with agricultural biodiversity (variety of animals kept and plants grown for food). There was a positive relationship between the two variables showing that the variety of animals kept and plants grown for food by a household positively influences the diversity of their diet. A standardized coefficient of R=0.697 and R2 of 0.485 was obtained. This shows that agricultural biodiversity contributes 48.5% to dietary diversity. DISCUSSION Agricultural biodiversity Considering the type of food crops that were being grown by the households, maize was the most popular. These results are similar to those of the District Development Plan, which indicated that the total area under food crops in the district was 29,556 hectares of which maize occupied the highest area of 15,650 ha [9]. This could be because ‘ugali” ( a thick paste made from mixing maize meal and boiling water) is the staple food of the community [13]. Although other studies in the area showed that beans were the second popular crop occupying 10,775 ha, in this study cassava was second in popularity. This shows that despite cases of food poisoning due to intake of cassava cited in the region (unpublished report), this food crop is still popular. It undergoes processing that destroys the cyanide; it is then mixed with maize, ground and used in making ‘ugali’. The findings of this study also showed that indigenous vegetables were not so popular. There were only five varieties of indigenous vegetables being grown and Cowpea leaves (Vigna unguilata) were the most popular. According to the community this is because cowpea can withstand harsh conditions and its yield is always higher than the other indigenous vegetables. In addition both its leaves and seeds are used as food. Although indigenous vegetables like African nightshade (Solanum scabrum), spider plant (Cleome gynandra), african kale (Brassica carinata) and pumpkin leaves (Cucurbita moschata) were used as food [14], and were popular among the Luhya community of western Kenya [13], no household was growing them. This could be due to agricultural commercialization, changing attitudes and changing dietary patterns such that most households concentrate on sugarcane farming and loss of indigenous knowledge. Apart from enhancing diversity in diet, indigenous vegetables are rich and cheap sources of micronutrients for especially for low income households. They contain high levels of minerals especially calcium, phosphorus, iron, vitamin A, vitamin C and proteins that have a great role in boosting the immune system. In most cases, the vitamins and minerals are more than those found in exotic vegetables. A hundred grams of these vegetables provide 100% of vitamins and minerals and 40% of daily recommended proteins [14]. There were only nine varieties of animals (livestock, poultry and fish) being reared by the 144 households. The most popular animals were chicken and cattle. The popularity of chicken could be because it is a major delicacy in the Luhya community and is also used as gift [13] according to the community members; the popularity of cattle could be its use in marriage as dowry, economic gain, and as food especially during weddings, funerals and any major functions. In Matungu division (Butere/Mumias District), hunting and trapping of animals like hare, giant rats, and mole rats was highly practiced. Wild fruits were gathered and mainly eaten on the spot by anybody. Insects like locusts and termites were trapped and used as food. These indigenous varied sources of food provided essential nutrients to the people and also acted as safety nets before harvest or in times of famine [13]. Despite this, only 12 varieties of food items were being obtained from their natural habitats. According to the community members the decline in hunting, trapping and gathering is because these activities are now associated with backwardness and poverty. In addition, the introduction of sugarcane and intensive modern agriculture that involves chemicals and fertilizers has destroyed natural habitats. Dietary Diversity Since studies have shown that dietary diversity is significantly associated with nutritional status indicators among children below five years [15,16], the low dietary diversity observed in terms of number of food items and variety of food items from each food group means that a majority of the children in the region are not receiving adequate and essential nutrients. The high consumption of breads and cereals observed and the low consumption of both animal and vegetable proteins, indicate that preschool children in this region are consuming inadequate and monotonous diets mainly composed of carbohydrates and little protein. The high consumption of vegetables could be explained by the fact that vegetables are cheaper than meat or fish and that most of them are cooked together thus increasing the likelihood of their being consumed over a longer period of time like five days. Since most of the vegetables were boiled, this leads to nutrient loss and reduces the availability of the micronutrients during consumption. In addition, the low consumption of fats and oils further inhibits the bioavailability of Vitamin A and other fat soluble components that could have been retained. The result is the persistent presence of micronutrient deficiencies despite high consumption of vegetables. Micronutrient malnutrition results in a variable impairment of several aspects of immunocompetence [17]. This makes individuals more susceptible to infections [1].Therefore one possible strategy for improving the health of the poor people and especially children in developing countries is to promote dietary diversity. CONCLUSION On average, households in Matungu division are growing 3 types of food crops, keeping 2 varieties of animals for food and obtaining 2 varieties of food items from natural habitats. The diversity of meals given to preschool children in this region is low, on average; they are consuming 13 varieties of foods in a week. There is a positive and strong relationship between agricultural biodiversity and dietary diversity. A change in agricultural biodiversity influences 50% of the diversity of diets given to preschool children. RECOMMENDATION Therefore to control malnutrition and promote dietary intake in quality and quantity among preschool children, the concerned bodies/ministries should initiate programs that will encourage agricultural biodiversity and utilization of indigenous food species among rural households who depend on agricultural biodiversity as their major source of food. Extension services should be intensified and directed specifically to women because they are the major family caretakers. ACKNOWLEDGEMENT The authors would like to acknowledge the support of Maseno University, School of Public Health and Community Development Staff and the community members of Matungu division for making this study successful. REFERENCES
© Copyright 2008 -Rural Outreach Program The following images related to this document are available:Photo images[nd08036f4.jpg] [nd08036f2.jpg] [nd08036f1.jpg] [nd08036f3.jpg] | ||||||||||||||||||||||||||||||||||||||||||||||||||||||||||||||||||||||||||||||||||||||||||||||||||||||||||||||||||||||||||
| |||||||||
