 |
| About Bioline | All Journals | Testimonials | Membership | News |
|
||||||
|
||||||
African Journal of Food Agriculture Nutrition and Development, Vol. 9, No. 1, Jan, 2009, pp. 565-579 The Availability of Processed Fruit Products and their Contents of Vitamins A and C in Nairobi, Kenya Olielo TKO 1* and GO Rombo1 * Corresponding author; Email: olielotk@yahoo.com
P.O Box 62193, Nairobi, Kenya Code Number: nd09007 ABSTRACT In Kenya, among children of less than five years, 84% have vitamin A deficiency, 73.4% have iron deficiency, and 51% have zinc deficiency. Among women, 39% have vitamin A deficiency, while among pregnant women, 60% have iron deficiency. Among adult males, 16% have iron deficiency. Improving vitamin A status of children in developing countries reduces child death rates by 20-50%. The WHO recommends per capita consumption of 200 g of fruit on average daily to supply vitamins. Consumption of fruit is low because of lack of awareness on benefits of fruit, poverty and post-harvest losses due to lack of skills for processing and storage. The objectives of this research were to survey household consumption of foods especially processed fruit products in Nairobi, and analyze nutritional quality of processed fruit products. Three estates representing different income groups were selected for the study. Household monthly low, middle, and high incomes were, respectively KES ≤14000, KES 14001 to 56000 and KES >56000; (KES 69 = US$1). A random sample of 130 households per estate was interviewed using 24 hour recall for seven days to assess consumption of processed fruit products. Laboratory analyses were carried out on contents of vitamin A and C. Results showed that all income groups did not consume recommended amounts of fruit products. Those who consumed processed fruit products consisted of 4.5% low income, 33% middle income and 62.5% high income households. Per capita annual consumption by the low income averaged 2.9 L fruit soft drinks, by the middle income was 5.9 L fruit soft drinks and 0.51 kg fruit preserve, and by high income group were 12 L fruit soft drinks and 0.95 kg fruit preserve. Per capita average consumption per annum was 7 L fruit soft drinks and 0.5 kg fruit preserve. Laboratory analysis of processed fruit products showed that they had good content of vitamin C and some vitamin A. However, vitamins are not included in national standards for these products. Quality failure involved one fruit-flavoured drink because it was labelled with fruit pictorial. It is recommended that public education be carried out on use of fruit products for nutrition, poverty reduction and health. Processors should apply quality standards, nutritional labelling and controlled pricing to improve consumption of fruit products. Results of this study shall be useful to processors, consumers, nutritionists, government agencies and UN organizations for promoting production, processing, and consumption of fruit products by Kenyans. Key words: Processed fruit products, consumption, quality. INTRODUCTION Diets lacking in vitamins and minerals cause some of the world’s most widespread and debilitating nutritional disorders, including birth defects in children, complications during pregnancy and childbirth, mental and physical retardation, weakened immune systems, blindness and deaths [1]. The most recent malnutrition indicators in Kenya, for children of less than five years were: 84% have varying levels of vitamin A deficiency, 73.4% have iron deficiency, and 51% have zinc deficiency. In women, 39% have vitamin A deficiency, while 60% of pregnant women have iron deficiency. Among adult males, 16 % have iron deficiency (anemia). Nutrient deficiencies in the sampled persons were determined by levels below cut-off points for serum concentration of required substances. Cut-off point for vitamin A was retinol <10 µg/dL in acute and 10- 20 µg/dL in marginal deficiency, for iron the cut-off point was HbC 11 g/dL and ferritin 20 µg/L and that for zinc was 65 µg/L [2]. Improving the vitamin A status of young children in developing countries reduces child death rates by 20-50% [3]. Both vitamin A and vitamin C enhance iron utilization and hence control Vitamin A Deficiency (VAD), Iron Deficiency Anemia (IDA)and related diseases [4]. The National Cancer Institute (NCI) of the US encourages people to eat 5 to 9 servings of vegetables and fruits a day as part of a healthy diet to reduce risk of chronic diseases such as cancer, heart disease and Alzheimer’s [5]. The recommended 5 x 80 g portions of fruits and vegetables a day can be equated to 200 g of fruit per day on average [6]. The USDA in 2005 recommended that for an average 2,000-calorie intake, two cups (474 mL) of fruit and 2½ cups of vegetables per day should be consumed and this should include a variety of fruits and vegetables each day. One serving of fruit is equated to four ounces (120 mL) of juice [7, 8]. Long-established industries, good transportation, well informed markets and high nutrition and health awareness contribute to the northern hemisphere’s preference for fruit. In Africa, the consumption of fruit is low because of: i) lack of awareness as to the benefits of fruit for health and well-being, ii) poverty, which lowers buying power, iii) post-harvest losses due to lack of skills for processing and storage, and iv) cultural misconceptions which discourage fruit consumption by segments of communities [6]. According to UNICEF and Kenyatta University researchers, most children in Kenya consumed fruits at an average of 4 times a week [9]. Fresh fruit salads are prepared and eaten in street food stalls, fast food restaurants, high class hotels, supermarkets and some households [10]. Consumer confidence is eroded by poor hygienic conditions in growing, handling or transporting the produce [11]. In Kenya, the total fruit production in 2003 was 4.3 million tonnes. Of this amount, 96% was channeled to local markets and 4% to exports. Thirty per cent of the produce is spoilt annually due to lack of transport and processing [12]. The most used method for preservation of fruits and vegetables is thermal processing [13]. To avoid heavy losses of nutritional quality, the products are commercially sterilized or treated with combined heat and chemical preservations [14]. Global per capita annual consumption of fruit beverages is 9.5 L and carbonated drinks is 34.8 L; while in the US, in 2000, per capita consumption of fruit beverages was 120 L against total soft drinks of 241.2 L [15]. Fruit soft drink is a fruit beverage such as 100% fruit juice, fruit nectar, squash, fruit-based soft drink or fruit-flavoured drink. According to quality standards, fruit-based soft drink shall have a minimum 10 % fruit juice, whereas composition of fruit-flavoured drinks made with fruit extracts is not specified and hence may be composed wholly of artificial concoctions of colour, flavour and nutrients. The research questions for this project were: i) what amount of processed fruit products do households consume? and ii) what is the level of nutritional quality of processed fruit products marketed in Nairobi, in terms of vitamins A and C content? MATERIALS AND METHODS This study was in two phases: i) a cross sectional survey of household food consumption patterns especially fruits, in various income groups of Nairobi, by the use of a questionnaire, and (ii) laboratory analysis of processed fruit products for vitamins A and C contents. Households’ food consumption survey The locations of the study were three estates in Nairobi: Kayole, Buruburu and Westlands, which respectively represented the low, middle and high-income groups. Nairobi City Council rates housing estates by household residence plot size [16] while households are rated according to household monthly income such that the low, middle and high-income households earn, respectively ≤ KES 14000, KES 14001 to 56000 and KES >56000 which were equivalent to ≤ US$ 202, US$ 203 to 812, and > US$ 812 monthly [17, 18]. The target population in the study was Nairobi residents who total at least 3 million and this number includes all income groups. The sample size of households in the survey was determined by formula of the Medicines Sans Frontiers organization [19]. In each of the selected estates/clusters representing particular income groups, a sample of 130 households was randomly selected for the study. A table of random numbers was used to select a random first household in the estate among the first 5 households by the main entrance of the estate. From then on, a third household was sequentially picked until 130 households were included in the sample per estate. A questionnaire was used for collecting food consumption data as recommended by FAO [20]. The researcher and trained assistants made initial visits to the sampled households and explained the purpose of the survey to each household head and other members of the household. Thereafter, the researcher and assistants visited each selected household once every 24 hours to carry out a 24 hr recall of food consumption by interviewing the housewife or the person responsible for food preparation and serving in the household, for seven days. Laboratory analysis of nutritional quality of processed fruit products Laboratory analyses were carried out on the most popular brands and the least popular brands of each type of fruit soft drinks and fruit preserves to assess vitamins A and C. Packaged processed fruit products were purchased from Uchumi supermarkets and analyzed at the Kenya Bureau of Standards laboratories in Nairobi. Targeted types of processed fruit products were fruit juices, fruit-based soft drinks, fruit-flavoured drinks, jams and marmalade and canned fruit pieces, marketed in Nairobi. Ten packages of each brand of processed fruit products were taken to one laboratory. In laboratory analysis of fruit products, the validity of results was attained by use of; repeatability limits for acceptable test results set at max ± 0.05. Likewise, both validity of results and quality assurance of data were attained by use of certified standard reference materials or in-house prepared materials bearing measured components run before or alongside test samples, calibrated equipment and accredited laboratories. i) Determination of ß-carotene (provitamin A) Vitamin A was analyzed by AOAC official methods, methods of test for vitamins, method for β -carotene [21]. Recommended conversion factor for β- carotene: vitamin A (RE) is 6: 1(FAO/WHO, 2002) [22]. Procedure: The test material used was 10 mg of fruit soft drink or 10 mg of fruit preserve. The material was mixed thoroughly in a beaker. The carotenes were extracted from the moist assay sample (containing about 0.05 to 0.1 mg of carotene) by use of petroleum ether that was transferred through a funnel into a 50 ml volumetric flask and filled to the mark. The ether was evaporated out at low temperature under vacuum to dryness. Chromatography column was prepared by using chromatography tube (Germany NS 12 Bistabil brand) into which was plugged glass wool and 20 g silica gel in 15 mL of ether, to obtain 1.5 x 20 cm absorption column. The product extract was poured onto the column and ether was added to transfer the coloured pigment. The eluate was collected in 25 mL volumetric flask. The ß-carotene was read using spectrophotometry absorbance at 450 nm and calculated against ß-carotene standard curve. ii. Determination of Vitamin C (Ascorbic acid) Vitamin C was analyzed by AOAC official methods, methods of test for vitamin C in vitamin C preparations and juices [23]. The Analysis involved preparation of the sample into liquid state and titration with indophenol. The 2, 6-dichlorophenol indophenol is blue in alkaline conditions and pink in acidic conditions. It is reduced by ascorbic acid to colourless. First, an experiment was carried out with a standard ascorbic acid solution and a blank to determine relationship of one mL indophenol to quantity of ascorbic acid. Procedure: A sample of fruit product was accurately weighed to 5 g. This sample was then mixed thoroughly with acid washed sand using metaphosphoric acid (10 g of acid dissolved in 100 mL water) reagent, and transferred to a 100 mL graduated flask. The mixture was shaken and made up to the volume (100 mL) with the metaphosphoric acid solution. This volume was designated as V mL. It was then filtered through filter paper. The final solution should contain 10–100 mg ascorbic acid/100 mL. Ten mL of the filtrate was taken and titrated with the standardized indophenol solution. The dye was added drop-wise from a burette to the acid extract of the vitamin source. A pink colour that persisted for 15 seconds after adding a final drop of the dye meant that the ascorbic acid was completely neutralized. The vitamin C content was calculated as follows:
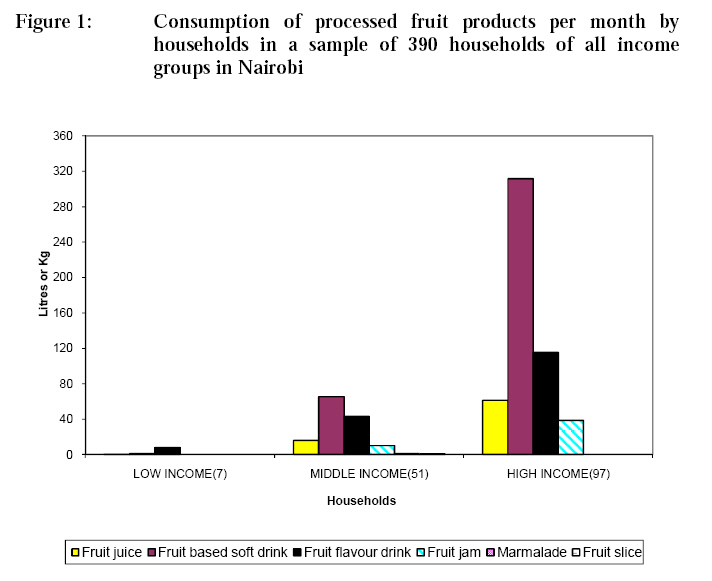
Where A = volume in mL of the indophenol solution used in the titration B = weight in mg of ascorbic acid equivalent to 1.0 mL standard indophenol solution, W = weight in g of the sample taken for the test. V = volume in mL of mixture solution used to homogenize sample to extract vitamin Y = volume in mL of test solution titrated against the indophenol RESULTS Proportion of households who consumed fruit products in various income groups The results of 24 h recall investigations revealed that the households who consumed fruit soft drinks were 17% of all households studied, distributed into 5% of the low-income group, 15% of the middle-income group and 29% of the high-income group. The households who consumed fruit preserves (jams) were: 38% of all the households who included none in number in the low-income group, 39% of the middle-income households and 75% of the high-income households. In total, the households who consumed processed fruit products were 5% of the low-income group, 39% of the middle-income group and 75% of the high-income group, making 40% of the total sampled households. Amounts of processed fruit products consumed by the sampled households Among the households who consumed the processed fruit products, the average monthly consumption by a low-income household averaging five people was 1 L of fruit flavoured drink or 126 ml of fruit-based soft drink or 17 mL of 100% juice and no preserves. The average consumption by a middle-income household was 1.3 L fruit-based soft drink or 0.8 L fruit-flavoured drinks or 307 mL of 100% fruit juice and jam of 0.2 kg. The middle-income group was the only group that also consumed marmalade (preserve) and canned fruit slices but in negligible amounts of 15 g and 10 g, respectively per household per month. The high-income household consumption was either 3.2 L fruit-based soft drink or 1.2 L fruit flavoured drink or 0.6 L of 100% fruit juice and 0.4 kg jam per month. The average consumption of processed fruit products by sample of households representing all income groups in Nairobi are presented in Figure 1. This research found that the average consumption of processed fruit products per person per year was 7 L of fruit soft drinks and 0.5 kg of fruit preserve (jam). The 100% fruit extract juice consumed was 18.5 % of the volume of all fruit soft drinks, fruit-based soft drink was 43.8 % and fruit flavoured drink was 38 %. Similarly, fruit jam was 92.6 % of all fruit preserves, and marmalade was 3.6 %, while canned fruit pieces were also 3.6 % of weight of the consumed preserves. Amount of nutrients in fruit products consumed per capita per day in various income groups The major staple carbohydrate source, which is the maize flour stiff porridge, known locally as Ugali was eaten by 88 % of households surveyed. Ninety two (92) percent of households consumed green vegetables. Forty six percent of the sample households were the largest group that ate meat, the main protein source, at least 4 times in seven days. Nutrient levels consumed per person were calculated based on weight of common food servings consumed by 46 % of households which was the group that ate meat and so ate balanced diet that consisted of ugali and the accompanying side dish of green vegetables and/or meat. The mean consumption of nutrients from fruit products were calculated based on the mean of quantity of foodstuffs consumed as shown in Table 1. Table 1: Amount of nutrients in common fruit product servings consumed per person per day in particular income groups
The quantities, Mean and SD (Standard Deviation)
of foodstuffs consumed per day were information from food consumption survey
using 24 hour food recall. Analytical nutritional quality of vitamin A and C in processed fruit products Results of laboratory analysis for vitamins A and C contents are presented in Table 2. The results showed that most products had good contents of vitamins. An example was orange cordial that had 23.5 μg vitamin A (RE) and 48.7 mg vitamin C per 100 g. Table 2: Results of analysisof nutritional quality of processed fruit products and conformity to quality standards
Results
are average of analysis of 10 packages of each brand, with content of each
container analysed in triplicate, and acceptable repeatability of results in
the range ≤ 0.05 DISCUSSION There is difficulty in measuring a household’s average daily food intake over a time period since there is great variation from person to person and from day to day [24]. Accordingly, in this research, the calculation of percentage of sample of households that consumed food was based on consumption of at least four times in seven days. The percent of the sample households who consumed whole fruit were 26%, those who consumed fruit soft drinks were 17% and of jam were 38% of all the households. Consumption of processed fruit products was influenced by income. Among fruit soft drinks, the high consumption of fruit-based soft drink may be due to improved acceptability caused by mixed aroma and flavour of fruit extract in addition to fruit flavour contents.The GOK/UNICEF (1999) assessment in 169 households in 5 districts in Kenya, found that the percentage of households who consumed maize, vegetable and fruit were, respectively 91.1%, 50% and 10% [2]. All income groups did not meet the FAO recommended level of consumption of fruit of 100 g per capita per day for Nairobi [25]. The sampled population consumed small amounts of fruit products which alone did not supply the WHO recommended amounts of vitamins A and C. Kenyans should increase their consumption of processed fruit products from the present amount of only 7 L per annum (19.3 mL per day) to eliminate vitamins A and C deficiencies. The global per capita annual consumption of fruit beverages is 9.5 L (2.1 gallons) that is less than carbonated drinks at 34.8 L. In the US, the fruit juice consumption in 1997 was 41.6 L per person per year [26], which is an average of 115.5 mL per day. Content of vitamins A and C in the processed fruit products varied and some products had good levels of the vitamins. However, there were no appropriate national or international standards with which to compare the values. Whole pineapple fruit juice had 22 μg Vitamin A Retinol and 30 mg vitamin C per 100 mL.Composition levels of vitamins A and C in the related fresh produce and juices presented in literature by various authors are placed in Table 2 for information.It was noted that most of the products conformed to requirements for characteristics such as the soluble solids oBrix and fill per cent that were in the standards for processed fruit products, therefore complying with a legal requirement.The tropical fruit flavour drink and orange cordial failed the labelling requirements since they had a fruit pictorial which is not allowed for fruit-flavoured drinks. The US FDA mandates that to be labelled as a fruit juice, the product must be 100% fruit juice. Any beverage that has less than 100% fruit juice must list the percentage that is fruit juice and must include a descriptive term such as drink, beverage or cocktail. Juice drinks contain between 10% and 99% juice and added sweeteners, flavours and sometimes fortifiers, such as vitamin C or calcium. Juice produced for infants should not contain sulfites or added sugar [26]. CONCLUSION The mean consumption of fruit soft drink and fruit preserve ( jam) per capita per day by the low-income group were, respectively 8 ml and 0 gm; by the middle-income group the intakes were 16 mL and 1.5 gm; and by the high-income group the intakes were 33.5 mL and 2.6 gm. The findings of this research showed that the per capita daily consumption of fruit products was 44 g ( 24 g fruit plus 19.2 mL fruit soft drink and 1.4 g fruit preserve) in Nairobi compared to World Health Organization global recommendation of 200 gm fruit per day [27]. Most of the brands of processed fruit products tested by laboratory analysis conformed to quality standards in all characteristics of labelling, content of ingredients and oBrix. The products had good content of vitamin C and some amount of vitamin A but there are no appropriate national or international standards for vitamins in the processed fruit products. These products were pineapple juice, mango juice; passion fruit based soft drink, plum jam, orange marmalade and the so called ‘Three fruit’ marmalade. The so called tropical fruit- flavour and orange cordial failed due to fruit pictorial placed on the label which is not allowed for fruit-flavoured drinks. The quality of these products in terms of nutrient content for the consumer is important and should not be slighted by manufacturers. The scrutiny of the labels showed that producers usually place a list of ingredients and sometimes nutritional labelling for energy content but do not indicate actual fruit ingredient content or even the significant vitamins A and C, perhaps because this is not a legal requirement. Several factors such as quality of products, proper labelling and poverty reduction among consumers are necessary for enhancing consumption of fruit products. The following recommendations are important to improve consumption of fruit products: i) Expertise in the benefits of fruit products in nutrition and health should be enhanced through inclusion of relevant departments of fruit science, utilization and processing technology in the universities and other colleges of learning and research. ii) International and national standards for processed fruit juices, other fruit soft drinks and fruit preserves should be reviewed to include levels of vitamins in the products. iii) Kenya is a major producer of fresh fruits and vegetables grown mainly by specialised technology farms in green houses and irrigation for export as well as other crops produced by rain-fed means and sold in local markets and streets. There is need to diversify to involve small-scale farmers in suitable areas where infrastructure should be provided for the business of growing good crop varieties, receiving seedlings from government research and extension services, and manufacturing. iv) Processors should produce real fruit juices of 100% fruit extract with suitable or controlled prices acceptable to all income groups including low-income groups by producing products in suitable size packages, having good customer service and contracts with farmers. REFERENCES
© Copyright 2009 -Rural Outreach Program The following images related to this document are available:Photo images[nd09007f1.jpg] | |||||||||||||||||||||||||||||||||||||||||||||||||||||||||||||||||||||||||||||||||||||||||||||||||||||||||||||||||||||||||||||||||||||||||||||||||||||||||||||||||||||||||||||||||||
| |||||||||

