 |
| About Bioline | All Journals | Testimonials | Membership | News |
|
||||||
|
||||||
African Journal of Food Agriculture Nutrition and Development, Vol. 9, No. 2, March, 2009 Effect of Varying Levels Of Sweet Potato (Ipomea batatas) Peels On Growth, Feed utilization And Some Biochemical Responses Of The Cichlid (Oreochromis niloticus) Omoregie E1*, Igoche L2, Ojobe TO2, Absalom KV2 and BC Onusiriuka3 *Corresponding author email: omoregie@unam.na Code Number: nd09018 ABSTRACT As a part of its efforts to contribute to alleviation of food insecurity, hunger and poverty, this study was conducted to investigate the performance of the cichlid, Oreochromis niloticus (Linnaeus) fed varying levels of processed sweet potato (Ipomea batatas) peels. The varying levels of sweet potato peel in the different experimental diets were 0, 5, 10, 15, 20 and 25% (all diets were iso-nitrogenous - 31.23 ± 0.22% crude protein). Twenty mixed-sexed fingerlings of the experimental fish (mean weight 0.47 ± 0.01 g) were fed the different diets for a period of 10 weeks in triplicates. The greatest increase in body weight (1.30 ± 0.07 g) of the fish was achieved with the control diet (P < 0.05), this was followed by the fish fed diet with 5% of the peel (0.90 ± 0.06 g) while the least increase in body weight (0.46 ± 0.01 g) was obtained in the fish fed diet with 25% of the peel (P < 0.05). Similarly, the best specific growth rate (SGR) and apparent digestibility were obtained in the fish fed the control diet, while the fish fed with diet containing 25% of the peel recorded the least SGR and apparent digestibility. Analysis of the results of plasma glucose and plasma protein revealed that there were no deleterious effects recorded in the test fish due to the dietary inclusion of the sweet potato peel. Analysis of the results revealed that Oreochromis niloticus could tolerate up to 15% level of inclusion of sweet potato peel. The significance of this research finding is that sweet potato peels can be incorporated into fish feeds in order to reduce the cost associated with production of farmed fish, as a part of efforts to contribute to alleviation of food insecurity, hunger and poverty in several rural communities in the world with special reference African countries. Keywords: Cichlid, potato, nutrition, biochemical responses INTRODUCTION The population of the world is growing at an exponential rate [1]. This situation calls for quick action and an aggressive approach tailored at food production to feed the already high human population in order to ameliorate inadequate food supplies and the consequential malnutrition. One of the promising solutions to the shortage of animal protein intake in developing countries is the proper development of aquaculture [1]. Fish feed is the most expensive input in aquaculture operations [2]. Much of the high cost of feed arises from extensive reliance on protein sources, such as fishmeal and shrimp meal [3, 4]. The shortage and high cost of pelleted feed severely constrained the development of low cost aquaculture systems suitable for small-scale farmers in the developing countries; hence, the need to assess the potential of non-conventional raw ingredients such as the sweet potato peels. It would therefore be more economical to utilize plant protein in fish feeding than high cost animal protein materials [5]. The use of plant-derived materials as fish feed ingredients is limited by the presence of a wide variety of anti-nutritional substances [6]. Among these are protease inhibitors, phytates, glucosinolates, saponins, tannins, lectins, oligosaccharides and non-starch polysaccharides, phytoestrogens, alkaloids, antigenic compounds, gossypols, cynogens, mimosine, cyclopropenoid, fatty acids, canaranine, antivitamins and phorbol esters. These authors noted that protease inhibitors, phytates, antigenic compounds and alkaloids, at levels usually present in fish diets containing commercially available plants-derived protein sources, are unlikely to affect fish growth performance. In contrast, glucosinolates, saponins, tannins, soluble non-starch polysaccharides, gossypol, and phorbol esters are more important from a practical point of view. However, as noted by Kays [7], the sweet potato peel is devoid of most of these agents as the sweet potato plant usually stores these chemicals in its tubers. The test fish, Oreochromis niloticus are principally herbivorous, although occasionally omnivorous. This is an efficient converter of waste foodstuff and appears to thrive well on artificial supplemental feed [8]. The main aim of this research is to reduce the cost of conventional fish diets while the objective is to investigate the effect of sweet potato peels inclusion in fish diet on growth responses of Oreochromis niloticus, food utilization and glucose and protein content of the blood plasma. MATERIALS AND METHOD Collection and Acclimatization of Experimental Fish Four hundred and twenty mixed-sex fingerlings of the cichlid, Oreochromis niloticus of the same broodstock (mean weight 0.47 ± 0.01 g) obtained from the hatchery of the Rockwater Fish Farm, Jos, Nigeria, were used for this investigation. The fingerlings were acclimatized to laboratory conditions for 14 days. Formulation of Experimental Diets The peels used in diet formulation were obtained from fresh sweet potatoes, washed properly and sun-dried for ten days under hygienic conditions (placed on pre-sterilized white tray and covered with wire-mesh) , after which they were winnowed and sieved to get rid of any foreign materials. The peels were then milled into a fine powder and sieved through a 0.5 mm mesh screen. Proximate analysis of the processed peel is presented in Table 1. Other raw ingredients of the experimental diets were fishmeal, groundnut cake, corn meal, cassava flour, corn oil, a-cellulose, chromic oxide, and vitamin and mineral premix. These diets were designated SPP0 (control), SPP5, SPP10, SPP15, SPP20 and SPP25, respectively. Table 2 shows the ingredient and proximate compositions of the experimental diets. All experimental diets were iso-nitrogenous (31.23 ± 0.22% crude protein) and iso-caloric (26.35 MJ/kg). Chromic oxide (Cr2O3) was incorporated in the diets to serve as the faecal indicator [9] for the determination of nutrient digestibility. Table 1: Proximate composition of sweet potato peel
*Hydrolysable carbohydrate content computed as Nitrogen Free Extract (NFE) Table 2: Ingredient and proximate composition* of experimental diets
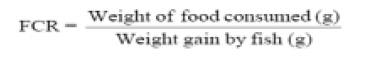
* Determined using standard methods [25]. All samples were analysed in triplicates ** Composition: A = 15,000,000 IU, D3 = 4,400,000 IU, E = 1,350 IU, K = 4,350 mg, B2 = 4,350 mg, B6 = 2,350 mg, B12 = 11,350 mg, C = 1,000 mg, nicotinic acid = 16,700 mg, pantothenic acid = 5,350 mg, potassium chloride = 87 gm = sodium sulphate = 212 gm, sodium chloride = 50 mg, magnesium sulphate = 12 gm, copper sulphate = 12 gm, zinc sulphate = 12 gm, manganese sulphate = 12 mg, lysine = 12 mg, methionine = 10 gm (Manufacturers: Anglian Nutrition Products Company (ANUPCO), Lady Lane, Hadleigh, Ipswich IP7 6BE, England). Experimental set-up The design utilized eighteen plastic tanks of 20-litre capacity and a constant water volume of 17 litres maintained in each tank. Prior to feeding of experimental diets, the fish were starved overnight to empty their gut and increase their appetite and reception for the new diets. A total of 24 fish were randomly selected, sacrificed and used in determining initial carcass proximate composition. For the experimental trials, 20 fish were weighed using Mettler Toledo PB602 top-loading balance and introduced into each of the experimental tanks. Each tank was assigned to one of the six experimental diets (triplicate tanks per diets). The fish were fed (3% body weight) twice daily at 0800 and 1800 h. Faecal samples were siphoned out and the water replaced daily before any subsequent feedings. The collected faecal samples were dried and stored for subsequent digestibility determination. Fish in each experimental tank were collectively weighed weekly for the determination of growth rate. The experimental period lasted 10 weeks. Mean water quality parameters during the experimental period were 5.62 ± 0.09 mg/l, 2.04 ± 0.05 mg/l, 22.60 ± 0.18 mg/l, 20.67 ± 0.18OC and 6.19 ± 0.02 for dissolved oxygen, free carbon dioxide, alkalinity, temperature and pH, respectively. Determination of Indices of Growth, Feed Utilization and Biochemical Parameters At the end of the experimental period the following growth and feed utilization indices were calculated; percentage weight gain, specific growth rate (SGR), food conversion efficiency (FCE), food conversion ratio (FCR) and apparent net protein utilization (ANPU) using the following equations as described by Brown [10], Winberg [11], Castell and Teiws [12] and Miller and Bender [13], respectively.
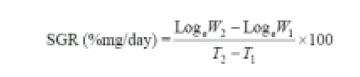
Where: W2 = Final weight at time T2 W1 = Initial weight at time T1 e = Base of natural logarithm
Where
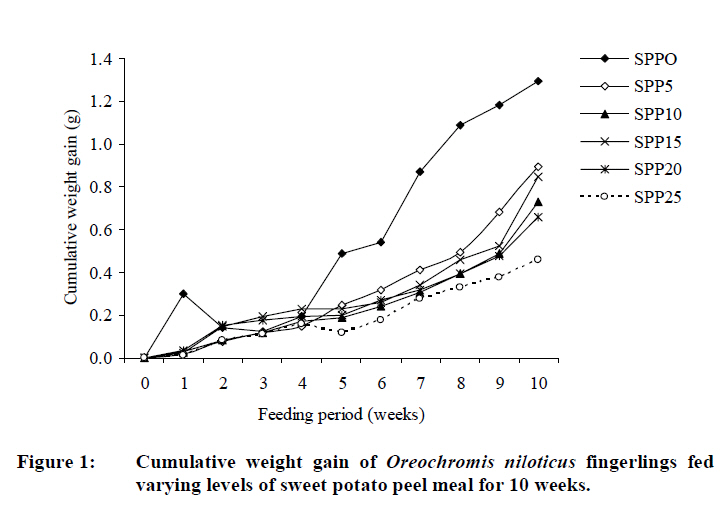
At the end of the feeding trials, fish from each tank was subjected to plasma glucose and plasma total protein analyses using basic anthrone and electrophoresis methods, respectively as described by Wedemeyer and Yasutake [14]. Statistical Analysis Analysis of Variance (ANOVA) for completely randomized design was used at 95% significant level to test for significant differences between the various treatment means obtained for the growth, feed utilization parameters, carcass composition and biochemical parameters (plasma glucose and protein). The least significance difference (LSD) test was used to determine which pairs of the treatment means differed significantly. The chi-square test was employed to analyse the digestibility values. RESULTS Growth Performance The mean weekly cumulative weight gain of the experimental fish Oreochromis niloticus fed varying levels of sweet potato peel meal for 10 weeks is presented in Figure 1. Results of mean weight gain and SGR of the experimental fish at the end of the feeding trials are presented in Table 3. The initial weight of the fish were near constant (0.47 ± 0.01 g) in all the experimental diets as there was no significant difference (P > 0.05) among the six treatments. The groups of fish fed diet SPP0 (control diet) had the highest percentage weight gain (284.81 ± 17.42%), and this was significantly different (P < 0.05) from the percentage weight gain of the groups of fish fed on diets SPP5, SPP10, SPP15 and SPP20, while the groups of fish fed diet SPP25 recorded the least percentage weight gain (96.01 ± 8.25%). Similarly, the groups of fish fed diet SPP0, had the highest SGR value (1.92 ± 0.06%/day), which was significantly higher than (P < 0.05) all the other treatments, while the least SGR value was obtained from fish fed diet SPP25 (0.96 ± 0.06 %/day). Table 3: Mean growth performance indices* of Oreochromis niloticus** fed varying dietary sweet potato peel meal for 10 weeks
*
Values within the same row with same superscripts are not significantly
different at 0.05 probability level. Food Utilization Indices The groups of fish fed on diet SPP0 utilized the experimental diets better than the other groups of fish. On the other hand the groups of fish fed diet SPP25 had the least feed utilization indices (Table 4). Values of ANPU obtained for the six experimental diets were not significantly different (P > 0.05) for all the groups of fish. Table 4: Mean values of food utilization indices of Oreochromis niloticus fed varying levels of dietary sweet potato peel meal for 10 weeks
*
Values within the same row with same superscripts are not significantly
different at 0.05 probability level. Digestibility The optical readings for six experimental diets, the corresponding faecal samples and the calculated apparent digestibility values are shown in Table 5. Statistical analysis indicates no significant differences (P > 0.05) amongst the various dietary treatments. In absolute terms, the nutrient digestibility of the experimental diets by the fish was greatest (30.50%) in the control diet (SPP0) and lowest in diet SPP25 (28.00%). Table 5: Effect of different experimental diets on apparent digestibility
Proximate Composition of Fish Carcass The proximate composition of experimental fish carcass at the beginning and end of the feeding trials are presented in Table 6. Carcass of fish fed diet SPP25 had the least protein content, which was significantly different from the other diets except SPP15. The ash content was near constant, as there was no significant difference amongst the fish fed the six experimental diets. Fish fed diet SPP0 recorded the highest level of lipid deposit which was significantly different from the other dietary treatments. Table 6: Proximate composition* of carcass of Oreochromis niloticus fed varying levels of sweet potato peel meal for ten weeks
* Values within the same row with same superscripts are not significantly different at 0.05 probability level. Values in parentheses are standard errors of mean values. Plasma Glucose and Protein Mean values of the plasma glucose and protein of the experimental fish after the feeding trials are presented in Table 7. The groups of fish fed control diet had the least mean values of plasma glucose, which was significantly different (P < 0.05) from the mean values obtained for the groups of fish. The groups of fish fed control diet recorded the highest mean values of plasma protein, which was significantly different (P < 0.05) from the mean values obtained for the other groups of fish. Table 7: Plasma glucose and protein (± SE*) of fingerlings of Oreochromis niloticus+ fed varying levels of sweet potato peel meal for 10 weeks
* Values within the same column with same superscripts are not
significantly different at 0.05 probability level. DISCUSSION The nutritional quality of sweet potato peel meal as determined by growth indices in this study was adequate, and in terms of survival the sweet potato peel can be successfully incorporated in the diets of cultured fish species, as no mortality was recorded in the experimental tanks during the feeding period. Although final body weight and growth rate were higher in fish fed the control diet. However, no deleterious depression in growth was observed in fish fed diet incorporated with 5, 10, 15 and 20%, respectively. However, at higher inclusion level (25%) reduced performance by the fish was observed. Secondly, one of the most common difficulties observed when alternative sources of feedstuffs are used in fish diets is acceptance and palatability by the fish [15]. However, in this present study, the fish avidly consumed the experimental diets. The mean dietary crude protein (31.23 ± 0.22%) of the experimental diets is within good range that maximizes the growth of juvenile herbivorous fish such as Oreochromis niloticus. Typically, herbivorous fish like the cichlids, require dietary protein between 30 - 35% [2, 16]. In this study, the highest weight gain was recorded in fish fed the control diet. Weight gain decreased linearly as levels of sweet potato peel increased and the least performance was observed in fish fed diet SPP25, an indication that at higher level of inclusion, above 25%, it may have a deleterious effect on growth. The result obtained in this study is in agreement with the result obtained by Omoregie et al. [17] when they included cassava peelings and mango seeds in the diet of Oreochromis niloticus. Also Ofojekwu et al. [18] reported a decrease in weight gain of Oreochromis niloticus with an increase in levels of palm kernel meal. Complete replacement of fishmeal with plant materials in fish diets will always lead to reduced growth, and as such, the optimal level of plant materials is crucial [19]. In this research, feed utilization indices were best in fish fed the control diets, FCR and PER of fish fed diets SPP5, SPP510 and SPP15 were also adequate, with FCR value of 1.71, 1.90 and 1.78 and PER values of 1.875, 1.585 and 1.70, respectively. Wee and Wang [20] reported very poor FCR and PER values when tilapia were fed high levels of plant protein sources. In the present study, poor values of FCR and PER were observed at high levels of inclusion of sweet potato peels, which could not be said to be a plant protein source based on its crude protein composition. In our experimental diets, we had used a 25% level of fishmeal and all experimental diets were iso-nitrogenous, hence the better performance when compared to the diets used by Wee and Wang [20]. The protein digestibility recorded in this investigation is comparable to values of 47.5% recorded for alfalfa meal and 45.7% for raw corn by Clarias lazera [21], and high when compared to values of 12% for lettuce and 20% for various aquatic plants fed to carp [22], and 22.9% for alfalfa in Tilapia aurea [23]. Although apparent digestibility values of the various diets were low in comparison to values of 82.9% recorded for alfalfa by grass carp[21]. Results of the proximate compositions of the fish carcass in this research revealed no evidence of excessive fat or carbohydrate deposition in the muscle after the experimental period. Fat and carbohydrate deposition in fish carcass is usually correlated to dietary levels [24]. Therefore, the result recorded in this investigation is a reflection of the good quality of the experimental diets with respect to fat and carbohydrate levels. There was a wide range of significant differences in results obtained for the bio-chemical analyses, among some of the dietary treatments. Plasma glucose decreased linearly with an increase in the level of sweet potato peel inclusion in the diets. There was, however, no significant difference between fish fed the control diet, and fish fed on diet SPP5. Significant differences were not observed between fish on diets SPP15, SPP20, and SPP25, respectively. This increase with respect to increase in the level of inclusion of sweet potato peel might be attributed to the increase in the level of hydrolysable carbohydrate in the experimental diets as the level of sweet potato peel increased. There was no much variation in the results obtained in this research for plasma protein, though various minor significant differences existed between the dietary treatments. This might be due to the near constant protein content of the experimental diets as determined during proximate analysis. The values of plasma glucose and protein obtained in this research are however normal and would not be considered a problem in tilapia fish culture [14]. CONCLUSION As part of its efforts to contribute to alleviation of food insecurity, hunger and poverty, the FAO Fisheries Department has been at the forefront in promoting sustainable commercial aquaculture. The goal is to assist developing countries, with emphasis on sub-Saharan Africa in poverty alleviation. It is within this framework that this research was conceptualised. From the results obtained, the incorporation of sweet potato peels (for the levels studied) in the diet of Oreochromis niloticus has no significant depression in growth nor deleterious effect on health of the fish, which to a lesser extent (15%) sweet potato peel was well tolerated by Oreochromis niloticus. REFERENCES
© Copyright 2009 - Rural Outreach Program The following images related to this document are available:Photo images[nd09018f1.jpg] | |||||||||||||||||||||||||||||||||||||||||||||||||||||||||||||||||||||||||||||||||||||||||||||||||||||||||||||||||||||||||||||||||||||||||||||||||||||||||||||||||||||||||||||||||||||||||||||||||||||||||||||||||||||||||||||||||||||||||||||||||||||||||||||||||||||||||||||||||||||||||||||||||||||||||||||||||||||||||||||||||||||||||
| |||||||||


