 |
| About Bioline | All Journals | Testimonials | Membership | News |
|
||||||
|
||||||
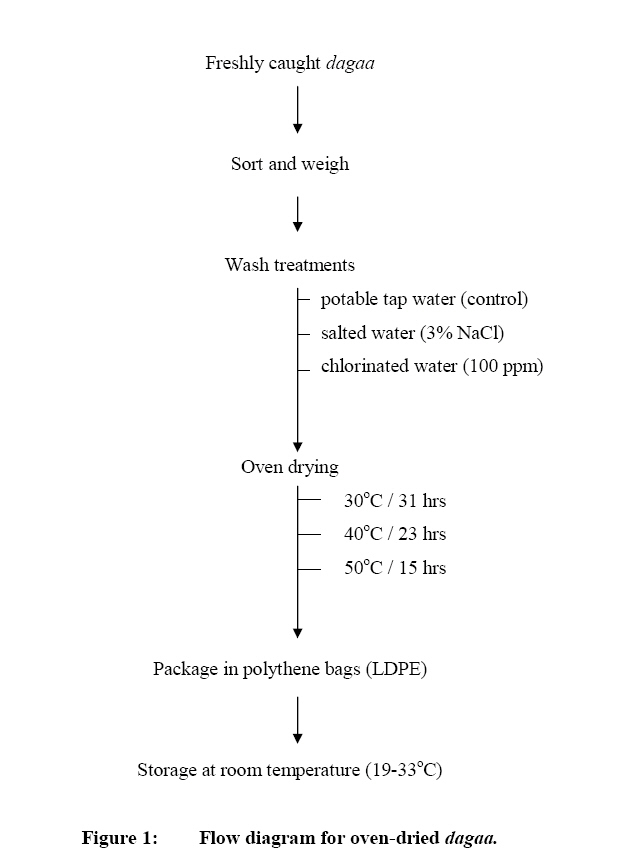
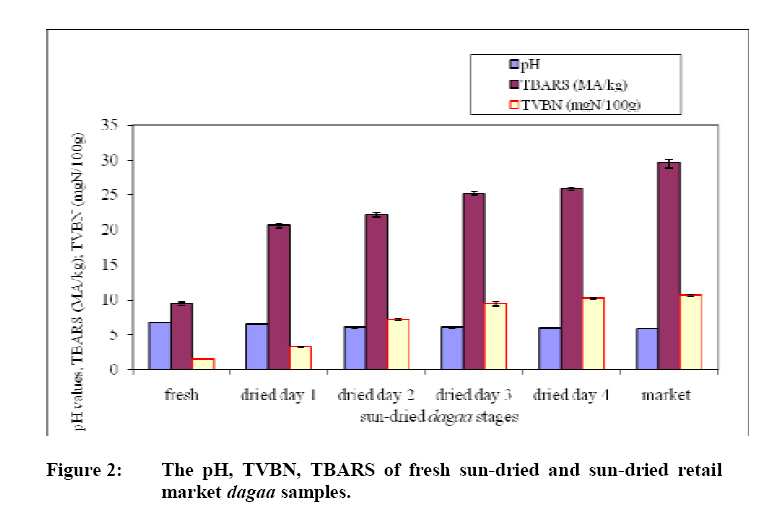
African Journal of Food Agriculture Nutrition and Development, Vol. 9, No. 3, May, 2009, pp. 830-845 Effect Of Selected washing Treatments And Drying Temperatures On Biochemical And Microbiological quality Of Dagaa (Rastrineobola argentea) Owaga EE1, Onyango CA2 and CK Njoroge21Dept. of Community Nutrition, Great Lakes University of Kisumu, P.O. Box 2224-40100, Kisumu, Kenya. Code Number: nd09028 ABSTRACTDagaa (Rastrineobola argentea) is one of the most important fish foods for the low-income households in the Nyanza Province, Kenya. However, the off-flavour and off-odour that results from the traditional sun-drying process of sun-dried dagaa is a major disincentive to the use of the fish for human consumption, hence leading to utilization in animal feed. Chemical analyses for pH, Thiobarbituric reactive substances (TBARS), Total volatile bases-nitrogen (TVBN) and aerobic bacterial counts were carried out on dagaa sampled from various process steps within the open field sun-drying and market conditions. Dagaa was also oven-dried at 30oC, 40oC and 50oC after washing with selected solutions namely salted (3% sodium chloride), chlorinated solutions (100ppm) and potable tap water (control). Results indicated that TBARS values increased significantly (p<0.05) from 1.39 mgMA/kg in fresh fish to 10.55 mgMA/kg in the market samples. The TVBN values increased significantly (p<0.05) from 9.42 mgMA/kg in fresh fish to 29.51 mg/ 100g in the market samples.The pH values declined significantly (p<0.05) from pH 6.72 in the fresh fish to pH 5.88 in the market samples .Lipid oxidation (TBARS) was significantly (p<0.05) higher in dagaa subjected to salted-wash treatments when compared to the chlorinated and control-wash treatments. The rate of lipid oxidation was significantly (p<0.05) higher at elevated temperatures of 50oC relative to 30oC and 40oC conditions. The TVBN levels observed in the salted and chlorinated-wash treatments showed significantly (p<0.05) lower TVBN values when compared with the control-wash treatments. However, the values of TVBN obtained at 30oC were significantly (p<0.05) higher when compared with the 40oC and 50oC drying temperature conditions. The salted-wash treatments resulted in lower pH values relative to the chlorinated and control-wash treatments on drying at 30oC and 40oC. In this study, the most appropriate treatment that showed the least TVBN and moderate TBARS values was drying the dagaa at 50oC after washing with chlorinated solution. Key words: dagaa, pH, TBARS, TVBN, bacteria INTRODUCTION Dagaa (Rastrineobola argentea) is a small pelagic fish that constitutes a large portion of Lake Victoria’s fisheries ecosystem. Dagaa are entirely processed by sun drying process, which leads to significant losses in quality [1]. The characteristically undesirable flavor of the sun-dried dagaa is a major disincentive to the use of dagaa for human consumption, hence its utilization for production of fishmeal for animal feed. Quality loss in dagaa is primarily associated with bacterial breakdown and lipid oxidation. The main pathway for the bacterial utilization of the nitrogenous compounds results in accumulation of compounds such as methyl mercaptan, hydrogen sulphide, dimethyl sulphide that are typical components of spoiling fish [2]. Determination of total volatile bases-nitrogen (TVBN) is commonly used to evaluate the extent of spoilage in fish [3, 4]. Lipid oxidation in fish can be manifested by changes in flavour, colour, texture and nutritive value [5, 6]. The degree of oxidation can be expressed at Thiobarbituric reactive substances (TBARS) value. Fish are excellent sources of unsaturated long chain free fatty acids, which make fish muscles highly susceptible to oxidation [7, 8]. Sodium chloride, which is an important food additive, has been reported to act generally as a pro-oxidant in muscle foods, thereby resulting in an increased level of lipid oxidation [9, 10, 11]. The constraints to effective and hygienic production of sun-dried dagaa indicate need for improved drying techniques. The knowledge that will be acquired in this study can be used to increase the supply of dried dagaa end products available for human consumption. This study was, therefore, undertaken to determine the biochemical quality characteristics of the sun-dried dagaa and to also assess the effects of selected pre-washing treatments and drying temperatures combinations on the biochemical quality of oven-dried dagaa. MATERIALS AND METHODSThis study was conducted in two phases as described below: (a) Sampling of sun-dried dagaa samplesThree batches of fresh dagaa samples of one kg each were collected randomly from fishermen at three landing sites namely Dunga, Tako and Block sites located in Kisumu. These sites are officially recognized by the Ministry of Fisheries Development under the Beach Management Unit Programme. Three batches of sun-dried dagaa samples (one kg each) were collected randomly after drying for 1, 2, 3 and 4 days, respectively from the drying sites located next to the three landing sites. Three batches of dried dagaa (one kg each) that had been in the retail market for one week were randomly sampled from three traders at Kibuye market. This is the largest retail market in Kisumu town. Ordinarily, dagaa stock would last for 1 week in retail market, therefore the sun-dried dagaa were held for one week at the prevailing market conditions. These market samples had previously been sun-dried for a period of four days by the identified traders. The conditions were monitored and temperature ranged from 19-33oC, whereas relative humidity ranged from 70-84%. The samples were transported on the same day in a cool box (4 - 9oC), to the Department of Food Science and Technology at Jomo Kenyatta University of Agriculture and Technology. (b) Sampling of oven-dried dagaa samples Three batches of freshly caught dagaa samples of approximately one kg each, were collected randomly from fishermen at three landing sites namely Dunga, Tako and Block sites. The sampleswere transported on the same day in a cool box (4 - 9oC) to the laboratory. Washing and oven-drying of fresh dagaaThe fresh dagaa were washed with selected solutions and oven-dried under selected temperatures as shown in Figure 1. About 800g of the dagaa were washed with 2 litres of salt solution (3% NaCl), chlorinated solution (100 ppm) or potable tap water (control). Each treatment was replicated three times. The washing operation involved placing the fresh dagaa in a standard mesh stainless steel sieve no. 8, and passing respective chilled (4 – 6oC) wash solutions through the sieve. The washed dagaa were allowed to drain excess liquid and subsequently oven-dried at 30oC, 40oC and 50oC using the Eyela Windy oven (WFO – 1000ND, Tokyo Rikakikai Co. Ltd). The ultimate drying duration for each of the selected temperatures was determined in the preliminary trials as the time it took to reduce the moisture content of the fish to below 10%, which is the standard requirement for dried fish products [12]. The durations realized were: 30oC (31hrs), 40oC (23hrs) and 50oC (15hrs). The dried dagaa samples were then packaged in low-density polyethylene (LDPE) bags and stored at ambient temperature, which ranged from 19 - 33oC, whereas the relative humidity varied between 69 - 84%. These were monitored daily using maximum/minimum mercury thermometer and dry/wet bulb hygrometer, respectively. Chemical and microbial analyses The fresh and sun-dried market samples were analysed for pH, TBARS, TVBN and aerobic bacterial counts. Samples of oven-dried dagaa were obtained at an interval of 2 days across a period of 9 days in storage and analysed for changes in pH, TBARS, TVBN and aerobic bacterial counts.ThepH was determined by use of pH meter (Metrohm Ltd) [13]. The TBARS levels were determined by the extraction method [14]. The TVBNcontent was analysed by the distillation method [15]. Determination of total viable count was done by the aerobic plate count method using plate count agar (PCA) according to AOAC method 966.23 [16]. Statistical analyses All treatments were conducted in triplicates. Oven drying experiments were conducted in a randomised complete design involving 3 wash treatments (control, salted, chlorinated) (WT), 3 drying temperatures (30oC, 40oC, 50oC) (DT) and 5 storage periods (day 1, 3, 5, 7, 9) (SP). Treatments of dried dagaa were prepared by a 3WT x 3DT x 5 SP factorial arrangement. The differences among treatments were measured by use of ANOVA while Duncan’s multiple range test was used to determine significant differences between means at 5% (p<0.05) level of significance. The statistical analysis was done by COSTAT statistical package [17]. RESULTSThe pH of sun-dried and oven-dried dagaa The pH values were significantly lower (p<0.05) in fresh dagaa (pH 6.72) compared to sun dried market samples (pH 5.88) (Figure 2). At 30oC and 40oC temperatures, the salted-wash treatments showed significantly (p<0.05) lower pH values relative to the chlorinated and control-wash treatments (Table 1). After 9 days of storage, a significant decline (p<0.05) in the pH levels was observed in the oven-dried dagaa. Drying of dagaa at 30oC, 40oC and 50oC did not show significant (p<0.05) difference between the control and chlorinated-wash treatments. Table 1: Changes in pH after drying and during storage of oven-dried dagaa1
1 Values are means of triplicate determinations. Means in a column followed by the same letters are not significantly different (p<0.05). The TBARS of sun-dried and oven-dried dagaa The TBARS values were significantly (p<0.05) higher in the market samples (10.55 mg MA/kg) compared to 1.39 mg Malonaldehyde (MA) /kg in fresh fish (Figure 2).The salted-wash treatments showed significantly (p<0.05) higher accumulation of TBARS in the dried dagaa than the chlorinated and control-wash treatments on drying at 30oC, 40oC and 50oC (Table 2). However, the chlorinated-wash treatments had a significantly (p<0.05) lower level of lipid oxidation than the control-wash treatments on drying at 30oC and 40oC. The TBARS levels for the salted, chlorinated and control-wash treatments were significantly (p<0.05) higher at elevated temperatures of 50oC and 40oC than at lower temperatures of 30oC. A significant (p<0.05) increase in TBARS was observed during the 9 days storage of all oven-dried dagaa. Apart from the 40oC salted, 50oC control and 50oC salted treatments, other oven-dried dagaa treatments had TBARS values below recommended limit of 6 mg MA/kg by day 9 of storage at ambient temperature conditions. Table 2: Changes in TBARS (mgMA/kg) after drying and during storage of oven-dried dagaa1
1 Values are a mean of triplicate determinations. Means in a column followed by the same letter are not significantly different (p<0.05). The TVBN of sun-dried and oven-dried dagaa The TVBN values were significantly (p<0.05) higher in sun-dried market samples (29.51 mg/ 100g) compared to 9.42 mg /100g in the freshly caught samples (Figure 2). The salted and chlorinated-wash treatments showed significantly (p<0.05) lower TVBN values than the control-wash treatment at all drying temperatures of 30oC, 40oC and 50oC (Table 3). The TVBN levels recorded at 30oC were significantly (p<0.05) higher relative to those at temperatures of 40oC and 50oC in the control, salted and chlorinated-wash treatments. During the storage period, the increases in TVBN levels in all the sun-dried dagaa treatments were significant (p<0.05) by day 9. Table 3: Changes in TVBN (mgN/100g) after drying and during storage of oven-dried dagaa1
1 Values are a mean of triplicate determinations. Means in a column followed by the same letter are not significantly different (p<0.05). Aerobic bacterial counts of sun-dried and oven-dried dagaa The bacterial load in market samples (6.16 log cfu/g) was significantly higher (p<0.05) compared to day 4 sun-dried dagaa samples (5.58 log cfu/g). The salted-wash treatment showed a significantly (p<0.05) lower aerobic bacterial counts compared to the chlorinated and control-wash treatments on drying at 30oC, 40oC and 50oC (Table 4). At 50oC, there was significantly (p<0.05) lower bacterial counts than at 30oC and 40oC for the control, salted and chlorinated-wash treatments. During the 9-days storage period, the aerobic bacterial counts increased significantly (p<0.05) in all the oven- dried samples. Table 4: Changes in aerobic bacteria counts (log cfu/g) after drying and during storage of oven-dried dagaa1
1 Values are a mean of triplicate determinations. Means in a column followed by the same letter are not significantly different (p<0.05) DISCUSSION The pH of sun-dried dagaa and oven-dried dagaa The pH of dried fish is important in the assessment of toughness, dryness and flavour of dried fish. The general decline of the pH values in sun-dried dagaa could be attributed to the concentration effect of the lactic acid by the lactobacilli bacteria [18, 19]. The salted wash treatments resulted in lower pH values possibly due to the leaching effect of salt on the salt soluble proteins. The TBARS of sun-dried dagaa and oven-dried dagaa Lipid oxidation determined as TBARS can be manifested by loss in flavour, colour, texture and nutritive quality in the dried fish products. The TBARS levels below 6 mg MA/kg in fish products is regarded as acceptable with regard to development of rancid flavour and odour [20]. Consequently, the sun-dried dagaa were rancid by day 3 of the drying process. The highly unsaturated nature of fish lipids in dagaa and the long holding during the sun-drying process is responsible for the rapid oxidative reactions [8, 21]. The salted-wash treatment resulted in higher accumulation of TBARS in the dried dagaa than the chlorinated and control wash treatments due to the pro-oxidant effect of salt on lipid oxidation [22]. Sodium chloride promotes the displacement of iron ions from the binding sites of heme compounds by interfering with the iron-protein interactions [9]. The TBARS values for chlorinated-wash samples were lower relative to the salted and control wash treatment, possibly as a result of inhibition of the lipolytic bacteria by chlorine (Table 4). The TVBN of sun-dried dagaa and oven-dried dagaa The rise in TVBN values of sun-dried dagaa is attributed to autolysis of the tissues by endogenous proteolytic enzymes, originating from the fish viscera as well as proteolytic microorganisms [23, 24, 25]. Based on the TVBN acceptability limit of 30 mgN /100g [15], the sun-dried market samples were regarded as marginally acceptable. The salted and chlorinated-wash treatments showed lower TVBN values when compared with the dagaa subjected to control-wash treatment on drying at 30oC, 40oC and 50oC. This is attributed to the inhibitory effects of chlorine and salt solutions on bacterial growth as reflected in respective lower bacterial counts (Table 4).The TVBN levels recorded at 30oC were higher than the values obtained on drying at higher temperatures of 40oC and 50oC. This is because at lower temperatures, the bacterial proliferation was higher than at elevated temperatures. All the oven-dried dagaa were still considered acceptable by day 9 with regard to TVBN acceptable limits. CONCLUSION The salted treatments resulted in extensive lipid oxidation in the oven-dried dagaa product due to the pro-oxidative effect of sodium chloride (3% NaCl). However, the data demonstrated that chlorinated-wash (100ppm) might be an effective intervention strategy in reducing lipid oxidation evident in the lower TBARS values compared with the potable tap water (control) and salted-wash treatments. The TVBN values in the oven-dried dagaa were higher in treatments dried at 30oC relative to the 40oC and 50oC conditions. In the shelf stability study, it was noted that lipid oxidation could be a major quality problem in dried dagaa products. Therefore, the most appropriate treatment that showed the least TVBN and moderate TBARS values on completion of storage was observed in the dagaa subjected to chlorinated wash and dried at 50oC. These conditions can be achieved through use of chlorinated municipal water and properly designed solar driers. ACKNOWLEDGEMENT The author expresses appreciation to the Dept. of Food Science and Technology (JKUAT) for granting the permission and support to use the laboratory facilities during the study, which was performed as part of a research for MSc. dissertation.This study was carried out during the months of January up to July, 2003. REFERENCES
© Copyright 2009 - Rural Outreach Program The following images related to this document are available:Photo images[nd09028f2.jpg] [nd09028f1.jpg] | |||||||||||||||||||||||||||||||||||||||||||||||||||||||||||||||||||||||||||||||||||||||||||||||||||||||||||||||||||||||||||||||||||||||||||||||||||||||||||||||||||||||||||||||||||||||||||||||||||||||||||||||||||||||||||||||||||||||||||||||||||||||||||||||||||||||||||||||||||||||||||||||||||||||||||||||||||||||||||||||||||||||||||||||||||||||||||||||||||||||||||||||||||||||
| |||||||||
