 |
| About Bioline | All Journals | Testimonials | Membership | News |
|
||||||
|
||||||
African Journal of Food Agriculture Nutrition and Development, Vol. 9, No. 3, May, 2009, pp. 885-900 Lipid Oxidation And Organoleptic Response During Shelf Storage Of Some Smoked Marine Fish In Kenya Oduor-Odote PM.1* and M Obiero.1 1 Kenya Marine and Fisheries Research Institute, P.O. Box 81651, Mombasa. Code Number: nd09032 ABSTRACT Peroxide Value (PV), Thiobarbituric Acid Reactive substances (TBARS), organoleptic properties and shelf life of some smoked marine fish namely Gerres oyena (“Chaa”), Lutjanus argentimaculatus (Red snapper) and Valamugil seheli (Mullet) were studied during storage. Both PV and TBARS for all the fish increased to a peak with storage time then decreased. PV in G. oyena was 10.80±1.07 mEq/kg on day 1 of storage, increased to 18.17±0.39 mEq/kg in day 8, peaked at 21.48±0.44 mEq/kg in day 11 then decreased to 8.50±2.34 mEq/kg on day 28. TBARS increased from 0.39±0.09 mg malondialdehyde/kg when fresh to 0.59±0.09 mg malondialdehyde/kg in day 8 then decreased to 0.07±0.004 mg malondialdehyde/kg on the 19th day of storage. PV in L. argentimaculatus was 61.65±0.09 mEq/kg on the 4th day of storage, increased to 112.86±0.19 mEq/kg on day 6 then decreased to15.17±0.54 mEq/kg on day 11. TBARS in L. argentimaculatus was 0.93±0.36 mg malondialdehyde/kg when fresh, 0.16±0.01 mg malondialdehyde/kg on day 1, 1.87±0.03 mg malondialdehyde/kg on day 8 and 0.06±0.01 mg malondialdehyde/kg on day 23. In Valamugil seheli, the PV was 57.59±0.11 mEq/kg on day 1 of storage, 76.55±0.49 mEq/kg on the 8th day, then it decreased to undetectable levels on the 28th day. The TBARS for fresh fish was 0.83±0.10 mg malondialdehyde/kg. After smoking it was 3.96±0.12 mg malondialdehyde/kg on day 4, 3.74±0.03 mg malondialdehyde/kg on day 8 then0.12± mg malondialdehyde /kg after 19 days of storage. The shelflives of the three fish species were monitored organoleptically during a 15 day storage period on day 1, 5 and 15 with any score of 5 or below out of 9 being the limit for rejection. The fish were stored on laboratory benches in the open at ambient temperatures of 30 0C and humidity of 60%. Organoleptic tests based on various attributes were done to establish consumer preference for the fish. The freshness score for G. oyena was 6.38, V. seheli 7.2 and L. argentimaculatus 7.5 at the end of 15 days storage. There was a significantly better score (p<0.05) in taste, texture and flavour for L.argentimaculatus compared to G. oyena and V. seheli. The overall mean score for all the organoleptic attributes for the 3 fish combined was 6.22. The most preferred attribute was taste with a score of 6.5. The most preferred fish was Lutjanus argentimaculatus followed by Gerres oyena then Valamugil seheli. Key words: Lipids, oxidation, smoking, organoleptic, storage INTRODUCTION Hot smoking of freshwater fish is a common practice in the Coast and Nyanza provinces in Kenya. No appreciable marine fish smoking takes place in Kenya as opposed to Western African countries where marine fish smoking is normal. Preliminary smoking trials done on the Kenyan coast with marine fish such as Caranx (Nguru or jacks), Siganids (Taffi or rabbitfish ), Pomadysis (Paramamba or grunters) and Barracudas (Pengezi) among others have shown that there is great preference in taste and acceptability within the confines of the study regime [1]. However, storage after processing is of concern. Biochemical changes that affect quality of the traditionally processed fish occur at all times during storage. Lipid oxidation is one of the most important factors responsible for deterioration of fish during storage [2]. Lipids are important because they carry odours and flavours and contribute to the palatability of meats. There are also potential benefits especially of the highly polyunsaturated fatty acids in sea fish [3]. Extensive auto oxidation of fishery products is usually enough reason to prevent their being marketed. Lipid oxidation in muscle can be initiated by non-enzymatic and enzymatic reactions [4]. Reactions between the byproducts of lipid oxidation and proteins cause undesirable changes of food properties including protein denaturation, loss of protein solubility, alteration of texture and functional properties of protein and destruction of nutrient components. Hydroperoxides are the major initial reaction products of fatty acids [5]. Peroxides and hydroperoxides also formed in the presence of oxygen readily decompose to secondary products such as aldehydes, ketones, alcohols, hydrocarbons and polymers among others [6,7]. The oxidation of fats depends on the composition of the lipids in the fish [8] and the rate and extent of oxidative deterioration depends on factors such as storage period and temperature, saturation degree of fatty acids, presence of antioxidants or pro-oxidants, and availability of oxygen [2]. The highly unsaturated fatty acids commonly found in seafood are particularly sensitive to oxidative changes during storage. Furthermore, during storage and heat treatment, fat is subjected to hydrolysis, oxidation and polymerization that result in quality deterioration in sensory quality and nutritive value [9]. Although the mechanisms of such processes are essentially the same in different fats, the rates at which different fats undergo deterioration reactions vary [10]. Peroxide value (PV) is the most commonly used assay of oxidation in fats and oils. It is an indicator of the products of primary oxidation. It measures rancidity or degree of oxidation but not stability of the fat. Aerobic oxidative products of animal tissues give a colour reaction with Thiobarbituric acid (TBA). The intensity of the colour is a measure of degree of oxidation. The types of TBA reactive substances (TBARS) produced depend on the substrate and oxidation conditions. In this study a smoking oven has been constructed for smoking marine fish. The species selected include Gerres oyena (“Chaa”), Lutjanus argentimaculatus (Red snapper), and Valamugil seheli (Mullet) landed in Majoreni village in the south coast of Kenya. The aim of this work was to investigate lipid oxidation in fish muscle during storage of the selected species with emphasis on PV and TBARS and observe organoleptic responses to the various attributes of the fish species. The storage temperatures and humidity were 30°C and 60%, respectively MATERIALS AND METHODS Construction of smoking oven A fish smoking oven was constructed with some modifications according to [11]. Fish handling The fish were purchased in July 2005 in Majoreni through the Sineno ngoma community group. This is a period when not much fish are landed. They were sorted to obtain similar sizes where possible. They were held in ice overnight and were assessed for freshness organoleptically the following day according to [15]. The general appearance, shape of eyes, colour of gills, firmness of skin and scales were examined. Only fresh ones were selected for further work. They were scaled, gutted, gilled then washed thoroughly with borehole water. They were then transferred to plastic containers for salting and salted to taste (44g salt per litre of water) and left to stay in the salt solution for 1 hour. The fish were then transferred to the smoking trays which were positioned at an angle for about 1 hour for drainage of water and for development of gloss after which smoking commenced. Fresh fish samples of each representative species was taken and kept on ice in cool boxes and transferred to the laboratory in KMFRI after a 6h drive to provide baseline data where necessary and stored in a freezer kept at -20 0C till analysis. The smoking process The wire mesh of the smoking trays was cleaned with vegetable oil to condition them so that fish muscle did not stick when fish was turned as the fish would break and reduce quality. The bigger fish were laid at the centre of the trays, nearer the heat source while the smaller ones at the furthest end of the trays in succession. When smoking commenced the tray was covered with fitting plywood to control smoke loss and help concentrate the smoke. At the end of the 3h smoking period, the fish were removed, placed in open side plastic trays to cool and later transferred to straw baskets for storage and to prevent rodents and insect infestation. They were then transported to KMFRI where they were kept on laboratory benches in the open at room temperature of 30 0C±2.1 and humidity of 60%. Oil, PV, TBARS and moisture contents were determined after smoking for each fish. They were organleptically assessed after 1, 5 and 15 days due to quantities available. Peroxide value and TBARS were determined according to [12]. Moisture according to [13]. Fat content was determined by [14]. All measurements were in triplicate. Sensory evaluation Organoleptic assessment was conducted according to [15] and [16], using 10 untrained panelists drawn from KMFRI staff coming from fish eating areas and who were neither hungry nor satiated at each sampling time. The panelists were advised not to smoke or eat 1 hour before the sensory evaluation, to avoid perfumes or aftershave and avoid being in the panel if sick or suffering from cold. A hedonic scale with scores of 1-9 (1=lowest acceptability and 9= highest acceptability) for various attributes was used. The attributes were taste, texture, appearance, flavour, aroma, odour. The fish samples were coded with numbers of 2 digits indicating no information about the samples to avoid bias in preferred treatments. Samples for taste (cooked flavor) were heated in a microwave oven LG INTELLOWAVE without any additives for example salt before tasting. Normal consumption temperature for food was used. Each panelist was served only loin parts. The quantities of samples were at least 2-3 bites for each panelist. The panelists received each sample separately. After-taste in the mouth between samples was removed using plain unsalted crackers then rinsed with water. A score of 5 and above was considered acceptable. The scores were analyzed by SPSS programme. The % oil, moisture, levels of PV and TBARS for G. oyena, L. argentimaculatus and V. sehehi on different days during storage are shown in Tables 1a-c. The PV in G. oyena increased from 10.80±1.07 mEq/kg in day 1 to 18.17±0.39 mEq/kg in day 8. It then peaked at 21.48±0.44 mEq/kg in day 11. There was a slight reduction in PV on day 14 to 20.71±0.34 mEq/kg and then a decrease to 8.50±2.34 mEq/kg after 28 days. Table 1a: PV, TBARS of G. oyena, on different days during storage.
Table 1b: PV, TBARS of V. sehehi on different days during storage.
Table 1c: PV, TBARS of L. argentimaculatus on different days during storage.
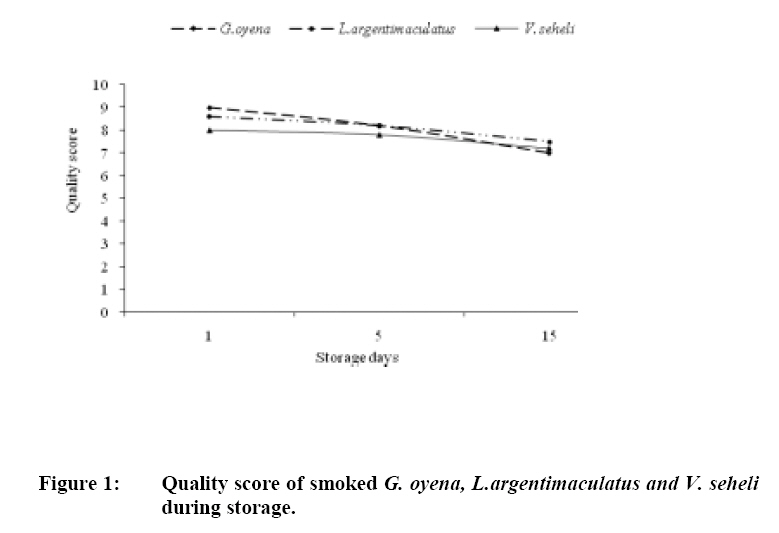
The PV in L. argentimaculatus was 61.65±0.09 mEq/kg on the 4th day of storage. This increased to 112.86±0.19 mEq/kg after 6 days then decreased to 15.17±0.54 mEq/kg by the 11th day. The PV for V. seheli was 57.79±0.11 mEq/kg in day 1. This increased to 76.55±0.49 mEq/kg in day 8 then decreased to undetectable levels on day 28. The level of TBARS in G. oyena was 0.39±0.09 mg malondialdehyde/kg. This increased to 0.59±0.09 mg malonialdehyde/kg on day 8 and decreased to 0.07±0.004 mg malondialdehyde/kg on the 19th day of storage. For V. seheli, the TBARS for fresh fish was 0.83±0.10 mg malondialdehyde/kg. After smoking it was 3.96±0.12 mg malondialdehyde/kg on day 4, 3.74±0.03 mg malondialdehyde/kg on day 8 then 0.12± mg malondialdehyde /kg after 19 days of storage. For L. argentimaculatus, the level of TBARS in the fresh fish was 0.93±0.36 mg malondialdehye/kg. During the storage period on day 1, the level was 0.16mg malondialdehyde/kg. The level increased to peak at 1.87±0.03 mg malondialdehyde/kg after 8 days of storage. It later dropped to 0.06±0.01 mg malondialdehyde/kg after 23 days of storage. The peak value in PV for Gerres oyena was on day 11 to 14 with values of 21.48±0.44 mEq/kg and 20.71±0.34 mEq/kg respectively. The peak values of PV for V. seheli were in days 4 to 8 with values of 70.06±0.49 mEq/kg and 76.54±1.67 mEq/kg respectively. The PV for L. argentimaculatus was highest in day 6 with a value of 112.8±0.19 mEq/kg. There is an increase then decrease in PV and TBARS in all the cases. Organoleptic responses Organoleptic evaluation results indicate that G. oyena, L. argentimaculatus and V. seheli with quality scores of 6.38, 7.5 and 7.2, respectively were still acceptable after 15 days storage (Fig 1). The scores were above 5 which was the limit for acceptance. Samples for fish during this lean fishing season were inadequate for further tests. The freshness scores were, however, still decreasing with time. G. oyena had the lowest quality score of 6 though this was still within the acceptable range for freshness. There was a significantly better score (p<0.05) in taste, texture and flavour for L.argentimaculatus compared to G. oyena and V. seheli (Table 2) Table 2: Mean score of attributes by panelists for G.oyena, L.argentimaculatus and V. seheli.
Results from response to the 6 attributes for G. oyena, L. argentimaculatus and V. seheli gave an overall mean score 6.22±2.1 (table 3) which was the category for acceptable score. The attribute that the panelists gave the highest score was taste with a mean score for all the fish of 6.50±2.0. Appearance was next with a score of 6.43±1.9. In terms of preference per individual species after combining all the attributes, L. argentimaculatus was the most preferred fish by the panelists with a score of 7.43±1.72 (Ttable 4) It was followed by G. oyena with a score of 6.00±2.19 and V. seheli with a score of 5.23±1.81. The differences in score were however not significant. Table 3: Mean scores of the attributes by different panelists for G. oyena, L. argentimaculatus, V. seheli.
Table 4: Overall preference score for G. oyena, L. argentimaculatus and V. seheli.
DISCUSSION The percentage of fat varied probably due to loss of moisture and an increase in dry matter content per unit weight following sample dehydration and also due to variation in individual fish selected at sampling periods because of heterogeneity in fish body fat [17, 18]. The moisture content also fluctuated during storage. This may have been due to reduced water holding capacity and evaporation due to storage conditions to some extent because the fish were kept on open laboratory benches unprotected [19]. Observations where there was a rise in PV levels and then a decrease over time had been made [20, 21, 22]. An increase in PV and TBARS then a decrease when a model oil frying system was used was observed by [9]. A decrease in PV after an initial increase has been observed by [10]. A significant decrease of PV after reaching maximum values confirms that peroxides were unstable components and were highly susceptible to further changes that resulted in the formation of secondary products [9]. Malonaldehyde, a TBA reactive compound is capable of cross-linking amino acids to form amidine linkages and may also interact with other components of fish such as nucleosides, nucleic acids, amino acids of phospholipids and other aldehydes which are end products of lipid oxidation and this interaction varies with fish species [23]. This could help explain the decrease in levels of TBARS with time. Also, the decrease in levels of TBARS after an increase is because the carbonyls are unstable and react easily with other compounds [24]. It is also known that oxygen accessibility, degree of tissue disruption, storage temperatures can affect shelf life and are important in rancidity [25]. During the process of oxidation of oil, there is rapid build up of hydroperoxides [25]. When storage is further extended, it could be postulated that the rate of hydroperoxide cleavage and hydroperoxide reactions exceed the hydroperoxide formation rate [25]. However, this would imply that other oxidation products would form more rapidly and be detected as TBARS. TBARS also react and breakdown so may not necessarily accumulate. This therefore explains the decrease of TBARS in time. The heterogeneous nature and composition of the fish fats and the smoke itself are probably also responsible for lack of clear patterns in lipid oxidation in smoked fish with reference to PV and TBARS [26,27,28]. Even within a single fish itself, there is a difference in the ease with which different portions undergo rancidity [29]. There are no set standards in literature as far as we know that indicate acceptable levels of TBARS and PV in smoked G. oyena, L. argentimaculatus and V. Seheli during storage. In this study, PV and TBARS increased and decreased to high and low levels with the eating quality still remaining good. Peroxide value and TBARS are useful biochemical indicators of spoilage but more work needs to be done to relate their levels with sensory values in smoked fish. It can also be proposed that the classical rancidity detection to the palate that is associated with certain levels of PV and TBARS is masked by the effect of smoke. Organoleptic responses Marine fish are not smoked or eaten at the coast of Kenya and are not familiar in the menus. This is despite the fact that the sensory attributes on a continuous scale in this study has registered high quality scores that suggest that such fish are acceptable. If a variety of fish species can have high scores during organoleptic assessment then the possibility of acceptance of the products in the market is there. The holistic approach of summing up all the attributes for the three different fish under overall mean scores and the acceptable quality scores reported confirmed potential of the smoked marine fish products in the market for the first time. Taste of a new product like smoked marine fish takes precedence above other attributes as these are fish which are either dried or fried. A high score for taste overall as an attribute qualifies the new fish products for acceptance in the market. Extractives, present in low concentrations in fish contribute directly to the flavour or taste and odours of a particular fish species and cause differences in taste of various fish species. Large variations in extractives exist between and within the species and their concentration changes during storage, spoilage and season [27, 30,31]. These alter the taste of the product. The chemical composition of fish varies greatly from one individual to another depending on age, sex, environment and season [31, 32]. The variation in composition is closely related to feed intake, migratory, swimming and sexual changes in connection with spawning. These alter fat content, which is also crucial in taste of smoked fish. Fatty fish absorb more smoke that enhances taste [33, 34,35]. The variation in taste though beyond the scope of this study could be due to extractives or body composition. The deterioration in eating quality in smoked fish in this case is best tested by organoleptic methods as it shows a more definite pattern of reduction in acceptance with time. Whereas a keeping time of 15 days is commendable compared with fried fish (which takes 3 days), more studies are needed to relate biochemical and organoleptic spoilage if possible. Acknowledgements I wish to thank Western Indian Ocean Marine Sciences Association (WIOMSA), Lighthouse Foundation, Germany through EEIU (K) for funding; the Director/KMFRI for facilitation of work, Bern Fulanda for data analysis, Cyprian Odoli, James Gonda and Shadrack Tunje for field and technical support REFERENCES
© Copyright 2009 - Rural Outreach Program The following images related to this document are available:Photo images[nd09032f1.jpg] | ||||||||||||||||||||||||||||||||||||||||||||||||||||||||||||||||||||||||||||||||||||||||||||||||||||||||||||||||||||||||||||||||||||||||||||||||||||||||||||||||||||||||||||||||||||||||||||||||||||||||||||||||||||||||||||||||||
| |||||||||
