 |
| About Bioline | All Journals | Testimonials | Membership | News |
|
||||||
|
||||||
African Journal of Food Agriculture Nutrition and Development, Vol. 9, No. 3, May, 2009, pp. 901-919 Nutritional Composition And Shelflife Of The Lake Victoria Nile Perch (Lates niloticus) Stored In Ice Okeyo GO1, Lokuruka MNI2* and JW Matofari3 1Master of Science (Food
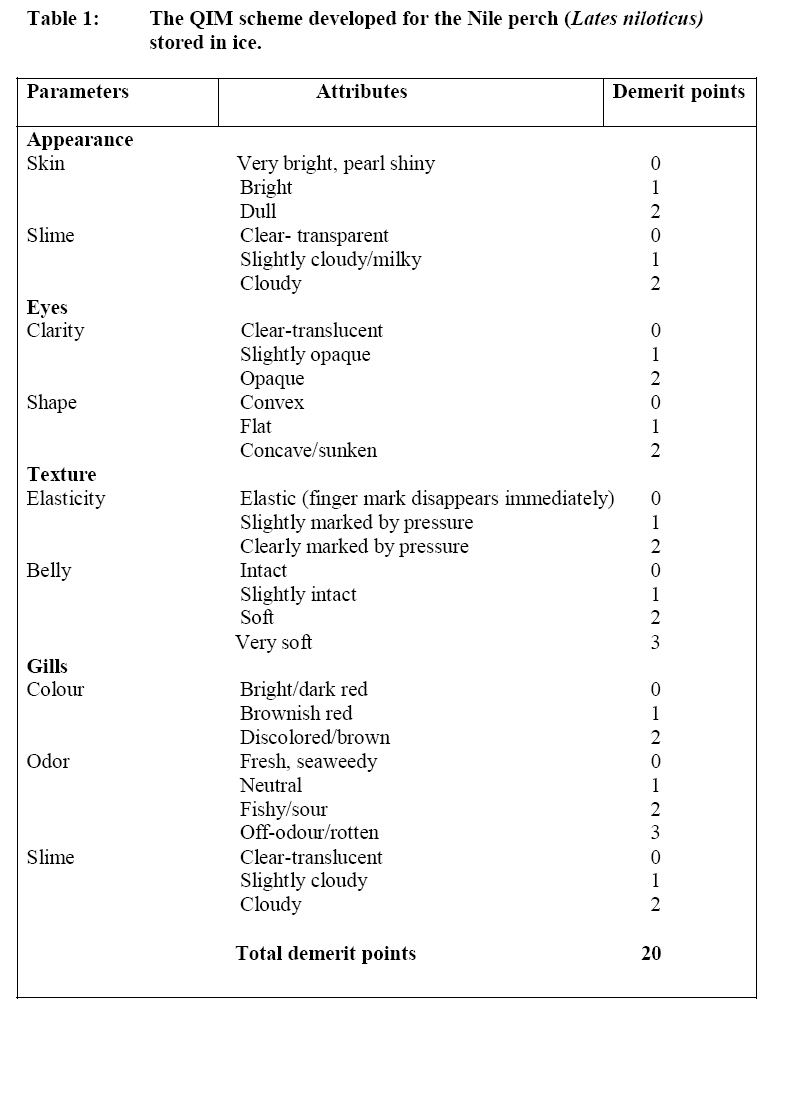
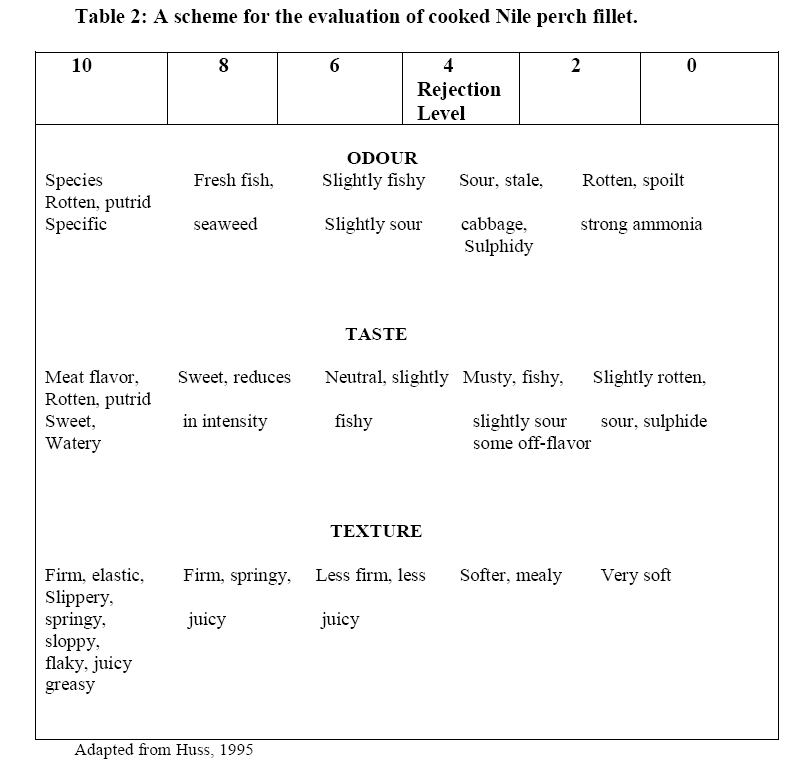
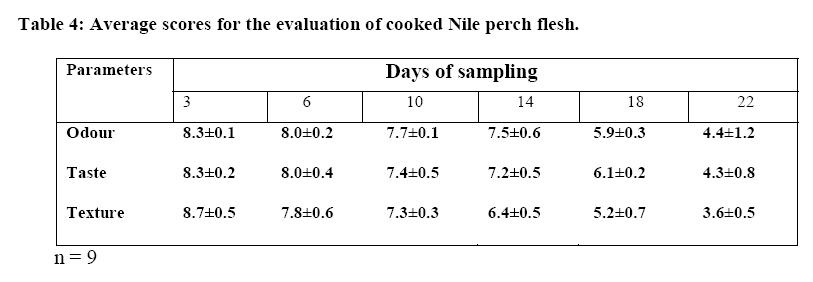
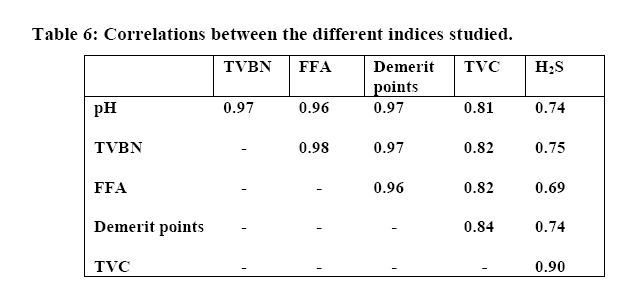
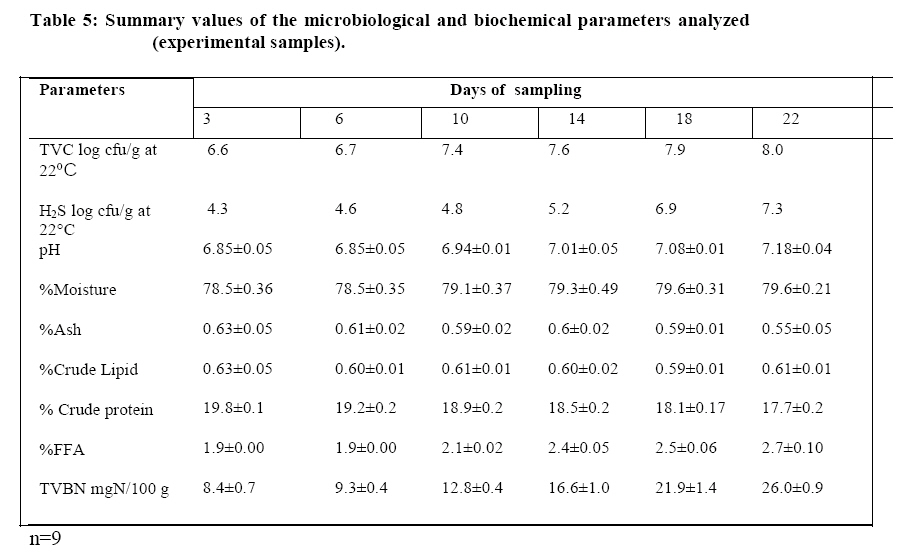
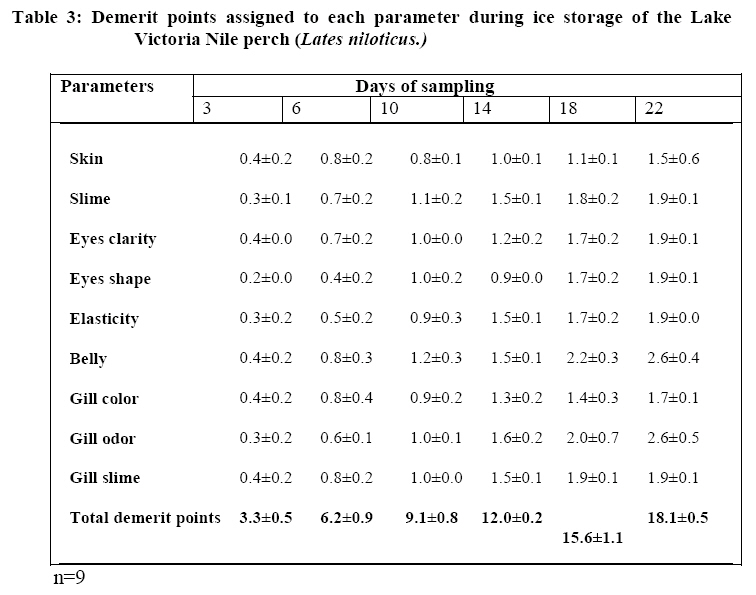
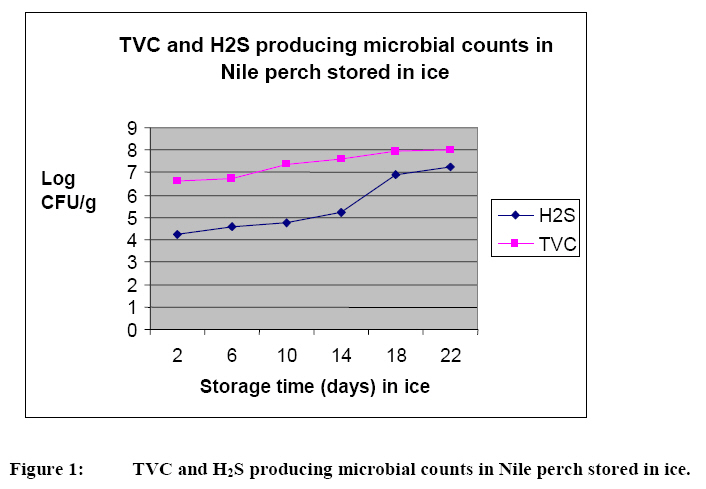
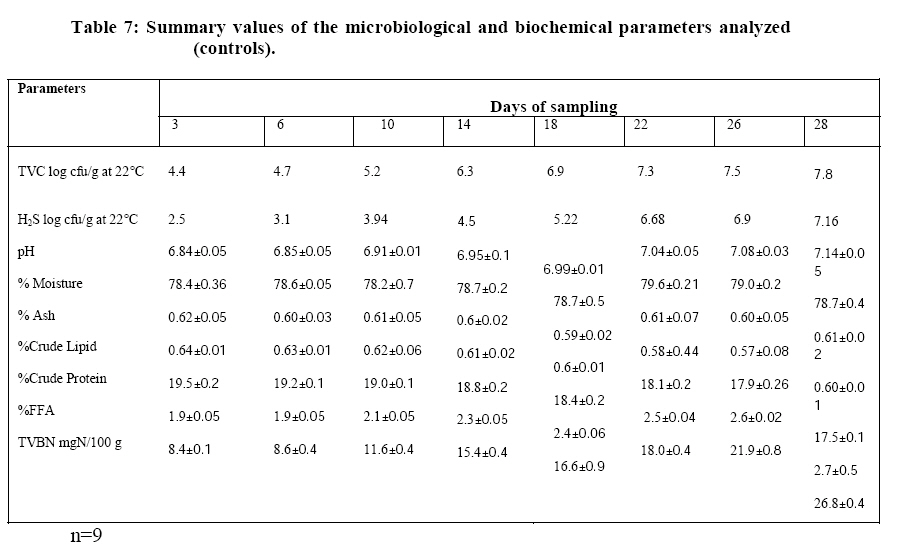
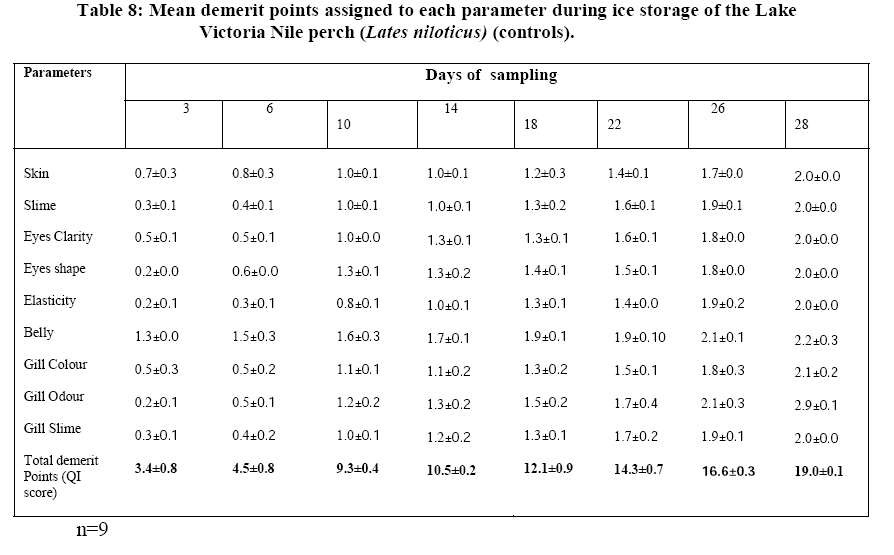
Science) Candidate, Department of Dairy and Food Science and Technology, Egerton University, P.O. Box 536-20115, Egerton, Kenya., E-mail: markokeyo@yahoo.com Code Number: nd09033 ABSTRACT Nile perch, the most important commercial fish species from the Lake Victoria fishery, contributes about 67% of Kenya’s total annual fish export earnings. Despite the Nile perch being an important foreign exchange earner, little information is available on its nutritional composition and shelf life on ice, information that is necessary for the development of methods to maintain its freshness, especially in view of the occasional rejection of exports of Nile perch products by the European Union. This study was, therefore, conducted using a set of physicochemical parameters to follow its deterioration profile in order to estimate its shelf life and freshness in the course of storage. These sensory parameters were correlated with selected biochemical and microbiological parameters to assess the suitability of the quality index scheme developed to determine the quality and shelf life of the iced Nile perch in the course of storage. The protein, lipid, moisture and ash contents were determined. The pH, total volatile basic nitrogen (TVBN), TMAO and free fatty acids (FFA) contents were the biochemical parameters studied, while total viable counts (TVC) and hydrogen sulphide producing bacterial counts were the microbiological parameters studied at the various stages of storage. The results showed that protein in the edible tissue of the Nile perch varied significantly (p<0.05) between 19.8 and 17.7%; the lipid, ash and moisture contents which varied between 0.59 and 0.63%, 0.55 and 0.63%, and 78.5 and 79.5%, respectively, were not significantly related to storage time (p>0.05). The sensory characteristics selected for the quality index scheme increased from 3.3 demerit points to 18.1 points (out of 20) at the point of rejection by a sensory panel. The TVBN increased from 8.4±0.7 mgN/100g to 26.0±0.9 mgN/ 100g at the point of rejection. No TMAO was detected. The %FFA increased from 1.9 to 2.7% at the point of rejection, while the TVC and hydrogen sulphide producing bacterial counts increased from 6.6 log cfu/g to 8.0 log cfu/g and 4.3 log cfu/g to 7.3 log cfu/g, respectively. The study established that the ungutted iced Nile perch handled under normal conditions in this fishery with a delay of 3-4 hours before icing, had shelf life of 22 days, while the control which was iced on board had a shelf life of 28 days. The study is significant in designing programmes for reducing post harvest losses of this fish in the Lake Victoria fishery. Key words: Nile perch, shelf life, ice INTRODUCTION Nile perch (Lates niloticus) is the most important commercial fish species from the Lake Victoria Fishery. In Kenya, it is locally referred to as “Mbuta” and is the most commercialized fish species that finds its way to the competitive European markets. In 2006, a total of 55,706 metric tons of Nile perch were landed. This was 35% of the total fish landed in Kenya the same year. The quantity was second to that of “Omena” (Rastrineobola argentea) with 57,929 metric tons, while the Nile tilapia was ranked third with 19,038 metric tons. The Nile perch export contributed US $ 50 million to Kenya, which is about 67% of the total fish and fishery product export earnings for 2006[1]. The importance of the Nile perch fishery as a source of food for the local people, export earnings and employment for the riparian communities justifies the need for better quality Nile perch products. The nutritional composition of fish varies greatly from one species and individual to another, depending on age, feed intake, sex and sexual changes connected with spawning, the environment and season [2]. Processors have direct interest in the chemical composition of fish in order to know the nature of the raw material before chilling, freezing, smoking or canning can be correctly applied [3]. The quality of fresh fish is a major concern to the fish industry and consumers. Like marine fish, fresh water fish are perishable commodities. Deterioration in the quality of fish occurs due to the effect of a variety of biochemical and microbial mechanisms. However, the rate of loss of quality depends directly on the nature of the fish species and on the handling and storage conditions [4]. Once the fish are caught, on-board storage conditions exert a strong effect on the quality of manufactured fish products and accordingly on their commercial values [5]. Storage time and conditions have great impact on the quality of fish and fish products and the storage stability depends on the composition of the fish [5]. The rate of deterioration of fish is highly temperature dependent and can be inhibited by the use of low storage temperature [6]. Icing reduces temperature to about 0°C which lowers the growth of spoilage and pathogenic micro-organisms and hence their spoilage rate. Ice has a large cooling capacity, and therefore, a comparatively small amount of ice will be needed to cool one Kilogramme of fish. The reason why more ice is needed in practice is mainly because ice melting tends to compensate for thermal losses [7]. Despite the Nile perch being an important foreign exchange earner in the export market, there is little information available on its nutritional composition and shelf life. The objective of this study was, therefore, to assess the effect of storage in ice on the nutritional composition and study the usefulness of selected sensory, microbiological and chemical parameters in determining the shelf life in ice of the Nile perch. The quality index method (QIM) was used to select and study the sensory parameters and attributes that change most significantly during the deterioration process. Chemical and microbiological parameters were used together with complementary sensory analysis of cooked fish, to establish a sensory demerit value which would show the end of shelf life and act as a limit of Nile perch acceptability for human consumption. MATERIALS AND METHODS Raw material sampling Fresh Nile perch (Lates niloticus) were purchased from fishermen at Dunga and Ogal fish landing sites situated about 2 and 30 km, respectively, from Kisumu town, Kenya, between April and October, 2008. The time interval between harvesting and arrival of the fish at the landing sites was about 3-4 hours and they were iced on purchase by layering with flaked ice. The control samples were iced immediately after being taken off the nets at the fishing ground by the fishermen according to our instructions. After taking the weights and lengths of the fish, whole fish were immediately layered with flaked ice and packed in insulated containers. Each sampling time, 60 pieces of fish were purchased. A total of 180 pieces of fish were used in this experiment, including the controls. The whole Nile perch had an average weight of 887.2±2.9 grams and a total length of 48.6±0.4 cm. The average weight and length are within the recommended statutory specifications [8]. The iced Nile perch were transported to a nearby chill store and stored at a temperature of 0-2°C overnight before being transported within 4-5 hours to the Food Chemistry Laboratory at Egerton University 150 Km away where they were kept under similar conditions. Three fish were randomly sampled on days 3, 6, 10, 14, 18 and 22 while the control was sampled at the same interval up to day 30 of storage in ice. The average temperature of the sampled fish was 1.4±0.14°C. During the storage period, any melted ice was replaced. All experimental and control samples were analyzed using the sensory, biochemical and microbiological tests as described below. Proximate Analysis Three Nile perch samples were analyzed in triplicate for proximate composition at each sampling time. The protein content was analyzed according to the Kjeldhal Method [9]. The lipid content was determined by Soxhlet Method according to AOAC [9]. The lipid content was determined by the following formula: % crude lipid = (wt of residue/original wt of sample) x 100. Moisture content was determined by the standard AOAC method with oven drying of 5 g of fish at 105°C until a constant weight was reached [9]. The moisture content was determined as the loss in moisture. Ash content was determined by the standard AOAC method [9]. Sensory evaluation Sensory evaluation was conducted on whole fish using a quality index scheme developed by a panel of three experts following the guidelines for sensory evaluation for fish species proposed by Martinsdottir et al. [10]. The sensory characteristics of Nile perch were assessed over the storage period of 22 days by a panel of ten previously trained assessors belonging to the Department of Dairy and Food Science and Technology of Egerton University, Kenya. The panelists were trained in order to familiarize them with the sensory scheme for Nile perch freshness evaluation. The appearance of the skin; slime color; clarity and shape of the eyes; elasticity; the belly texture; gill color, odor and gill slime appearance were assessed based on the scores of 0 to 3 (Table1). The attributes of cooked fish (odor, taste and texture) were evaluated by the same panel on each sampling day simultaneously. The sensory assessment score sheet for cooked fish was adopted from Huss [7], with slight modifications (Table 2). The fish samples (50 g) were wrapped in aluminium foil and cooked in hot potable water at a temperature of 95°C for 25 minutes, cooled and immediately presented to the panelists. The odor, taste and texture were evaluated using a structured acceptability scale of 0-10. The rejection threshold was set at ≤4 (Table 4). Biochemical analyses pH Ten grams of Nile perch flesh from the tail region were homogenized in 50 mL of distilled water and the mixture filtered using Whatman filter paper No.1. The pH of the filtrate was measured using a CRISON Model 507 pH meter at ambient temperature after calibration using standard buffers of pH 7 and 4 at 25°C. The pH meter is made to read measurements accurately to ±0.01 pH units [11]. Total volatile basic nitrogen (TVBN) Approximately ten grams sample of skinless fish flesh from the tail region was homogenized with 50 mL of distilled water. The mixture was centrifuged in Sorval RC-285 centrifuge (Dupont, Wilmington, Delaware, U.S.A) at 400 rpm for 5 minutes and the supernatant filtered through a Büchner funnel using Whatman No.1 filter paper. Two grams of MgO was added followed by one drop of antifoaming agent. A 250-mL Erlenmeyer flask containing 25 mL of 3% aqueous solution of boric acid, 0.04 mL of a mixture of methyl red and methylene blue indicators was used as the indicator. Distillation was continued until a final distillate volume of 125 mL was obtained. The distilled TVBN was titrated with an aqueous 0.1N HCL solution. TVBN content was expressed as mgN/100 g of fish flesh [11]. TVBN = (V × C × 14 × 100) /10, where V is the volume of hydrochloric acid added and its concentration (C), 10 represent the weight of the sample while 14 is the molecular weight of nitrogen. Free Fatty Acids (FFA) determination Percent free fatty acids were determined by the standard AACC Method [12]. The FFA was expressed as percent oleic acid equivalent. Microbiological analysis Fish samples (25 g) from the tail region with skin on were mixed with 225 mL of peptone water diluent and homogenized. The fish samples were analyzed with skin on to estimate the total viable counts that could be responsible for deterioration in quality both as a result of cross contamination due to poor handling and autolysis. Further serial dilutions were made in tubes before plating. The TVC and H2S producing bacteria counts were done on Iron Agar (Oxoid, UK) by pour plate technique with an overlay as described by Gram et al. [13]. The plates were incubated at 22°C for 3 days. The total viable count (TVC) was obtained by registering all bacterial colonies on the incubated plates from each dilution of the sample showing growth. The number of colonies showing a clear dark color represented the bacterial population able to produce H2S, while the white colonies represented the TVC. Data analysis ANOVA was performed on the treatment means for each parameter studied using Statistical Package for Social Scientists (SPSS 15, Chicago, Ill, USA) to examine whether there were significant differences in the parameters analyzed with storage time in ice. Correlations between the sensory, chemical and microbiological parameters were also done and are presented in Table 6. RESULTS Proximate composition As shown in Table 5, lipid, moisture and ash contents varied between 0.59 and 0.63%, 78.5 and 79.6%, and 0.55 and 0.63%, respectively. Total crude protein decreased with storage time (p<0.05), from an initial value of 19.8% on day 3 of storage to 17.7% on day 22 of storage in ice. Sensory evaluation The scores given by the panellists according to the QIM scheme for each parameter are presented in Table 3. The demerit points were calculated for each storage day of sampling and showed an increase with storage time. The panellists scored 3.3 points on day 3 of storage and there was a significant increase (p<0.05) in the scores as storage in ice progressed. On day 22, the total demerit point score (quality index score QI), as determined by the panelists was 18.1 points (out of a maximum of 20 points). The results of the analysis of cooked fish as determined by the same panel members showed a good score of 8.3±0.1 points for odor, 8.3±0.2 for taste and 8.7±0.5 points for texture on day 3 of storage in ice. These scores tended to decrease with storage time in ice (p<0.05). On day 22 when the panellists perceived the fish were unacceptable, the scores were 4.4±1.2, 4.3±0.8 and 3.6±0.5 for odor, taste and texture, respectively (Table 4). pH Changes in the pH of Nile perch stored in ice are shown in Table 5. On day 3 of storage in ice, the fish had a pH of 6.85. During the storage period, there was no significant increase in the pH up to the 10th day of storage in ice when the pH increased to 6.94. On day 22 the pH was 7.18. The overall pH values increased significantly (p<0.05), with storage time in ice TVBN The TVBN values of Nile perch stored in ice are given in Table 5. The TVBN showed an increase with storage time in ice. The initial value of TVBN was 8.4 mgN/100 g of flesh on day 3 of storage in ice. It increased to 9.3 mgN/100g, 12.8 mgN/100 g, 16.6 mgN/100 g and 21.9 mgN/100 g on day 6, 10, 14 and 18 of storage in ice, respectively. On day 22 of storage, the TVBN content was 26.0 mgN/100 g of flesh. For the controls, the final value on day 28 was 26.8 mgN/100 g of flesh. Free Fatty Acids The changes in FFA in Nile perch muscle during iced storage are shown in Table 5. On day 3 of storage in ice, the FFA was 1.9%. No changes in FFA content were observed on day 3 and 6 of storage in ice. However, a gradual increase was evident from day 10 up to day 18 and the highest percent FFA content (2.7%) was obtained on day 22 for the experimental samples. Microbiological analysis The TVC and hydrogen sulphide producing bacterial counts increased with storage days in ice (p<0.05) as shown in Figure 1. The initial TVC was 6.6 log cfu/g on day 3 of storage in ice, which increased to 7.6 log cfu/g and 8 log cfu/g on day 14 and 22, respectively. The initial hydrogen sulphide producing bacterial count was 4.3 log cfu/g and this increased to 5.2 log cfu/g and 7.3 log cfu/g on the 14th and 22nd day of storage in ice, respectively, for the experimental sample lot. DISCUSSION Proximate composition The lipid, ash and moisture contents which varied between 0.59 and 0.63%, 0.55 and 0.63%, and 78.5 and 79.5%, respectively, were not significant with storage time (p>0.05 (Table 5). Total crude protein decreased with storage time from the initial value of 19.8-17.7% at the end of the storage period. The decrease in the total crude protein content of fish flesh was possibly due to a decrease in salt soluble protein and water soluble protein [14]. This loss could also be due to autolytic deterioration associated with the actions of endogenous enzymes and bacteria [15]. From the observations made, there was a decrease in protein content with an increase in TVBN content in the flesh. These changes coincided with an increase in the number of bacterial counts and this could be due to the proteolytic breakdown of the protein molecules to release volatile nitrogenous compounds determined as TVBN. Sensory evaluation The demerit points after day 3 of storage showed an increase with storage time. This was evident as deterioration in the quality of the Nile perch. The panellists scored an average of 3.3 points on day 3 of storage and there was significant increase (p<0.05) in the scores as storage progressed thereafter. On day 22, the average sum of demerit points (QI) as determined by the panellists was 18.1 points and this was the point of rejection of this fish. At this time, the skin appearance was dull, the eyes were opaque and concave in shape, the texture of the fish was clearly marked by pressure, the belly was very soft, the gill colour was discolored, the odour was off normal and the slime was cloudy. These observed changes related positively with the pH, TVBN, FFA content, TVC and H2S bacterial counts, at which points the levels were 26.0 mgN/100 g, 2.7%, 8.0 log cfu/g and 7.3 log cfu/g, respectively. The corresponding correlations were 0.97, 0.97, 0.96, 0.84 and 0.74, respectively. These findings showed that the deterioration in the quality of the Nile perch as evidenced by the considerable values of these factors was in agreement with other authors [16, 17]. The results of the analysis of cooked fish as determined by the same panel members showed a high score of 8.3 points for both odour and taste and 8.7 points for texture on day 3 of storage. These scores tended to decrease with storage time in ice. On day 22 when the panellists felt the fish were unacceptable for human consumption, the scores were 4.4, 4.3 and 3.6 points for odour, taste and texture, respectively. The high scores observed on day 3 of storage showed the odour of the cooked fish was fresh to sea-weedy while the taste was sweet with a characteristic meaty flavor. The texture was firm and juicy. At the point of rejection there was a strong ammoniacal smell, the taste was sour, fishy and musty, while the flesh texture was very soft and mealy. These characteristics corresponded with the high levels of pH (7.18), TVBN (26.0 mgN/100 g flesh), FFA (2.7%), TVC (8 .0 log cfu/g) and H2S bacterial counts (7.3 log cfu/g). pH The pH of live fish muscle is close to the value 7.0 [18]. However, post mortem pH varies from 6.0 to 7.1 [19]. The pH of the Nile perch stored in ice increased with storage time. On day 3, the pH was 6.85. However, there was no significant increase in the pH until the 10th day when it increased to 6.94. On day 22 when the fish was considered unacceptable for human consumption, the pH was 7.18. Increases in pH may indicate the accumulation of alkaline compounds such as ammonia mainly derived from microbial actions. The increase may also be due to an increase in volatile bases from the decomposition of nitrogenous compounds by endogenous or microbial enzymes [18]. Although this index is not very important in determining the quality of fish, it can be used as a guide [19]. The pH of fish flesh has an important influence on its freshness because of its influence on bacterial growth. The lower the pH of fish flesh, the slower the bacterial growth, and vice versa. The high correlation between the pH and TVC and H2S producing bacterial counts (0.82 and 0.74, respectively), confirms this relationship. TVBN The TVBN showed an increase with storage time, results that were similar to those of other studies of the Nile perch [13, 20]. The values for this index increased slowly until day 10 of storage when a sharp and significant increase was observed. This increase corresponded to the increase in the pH, TVC, H2S bacterial counts and the QI and is supported by the high correlations of 0.98, 0.97, 0.82 and 0.75, respectively. This increase detected from the 10th day, coincided with the onset of spoilage and the logarithmic phase of microbial growth. The formation of TVBN is generally associated with the activity of micro-organisms and tends to be high at high microbial population [21, 22]. In this study, TVBN was 26.0 mgN/100 g of flesh on day 22 of storage in ice, a time when the cooked fish was considered unfit for human consumption. At this point, the TVC and H2S bacterial counts were high (8.0 log cfu/g and 7.3 log cfu/g, respectively) similar to the high pH value of 7.18. Since TVBN is produced mainly by bacterial decomposition of proteins in fish flesh, the high values of TVC and H2S bacterial counts on the 22nd day could explain the considerable value of TVBN in Nile perch flesh at this time of storage. The changes in TVBN content may also be related to changes in pH [15]. The initial lower levels of TVBN observed could be due to lower levels of endogenous ammonia due to reduced microbial activity during the first 10 days of storage of the fish in ice [19]. The increase in the TVBN could also be due to bacterial and enzymatic activity, especially the psychrophylic bacteria [7]. Free Fatty Acids There was a gradual increase in the FFA content with increasing storage time. The levels had a high correlation with the QI, TVBN and pH (Table 5) showing that it could act as a good indicator for the assessment of the freshness of the Nile perch. Lipid hydrolysis occurred to a great extent at the end of the storage period. Hydrolysis of glycerol-fatty acid esters is one important change that occurs in fish muscle lipids post mortem with the release of fatty acids [23]. This is catalyzed by lipases and phospholipases [19]. The accumulation of FFA could be attributed to lipases and phospholipases activity in Nile perch muscle, digestive organs as well as micro-organisms which were enhanced with extended storage. In addition, extracellular lipases produced by certain micro-organisms such as Pseudomonas spp. may have also contributed to lipolysis in the Nile perch tissue [23]. This is demonstrated by the moderate correlations observed between the FFA, and the TVC and H2S producing bacterial counts (0.82 and 0.69, respectively). The formation of FFA does not lead to nutritional losses [24]. However, its examination was deemed important since it has been shown that the accumulation of FFA is related to texture deterioration by FFA interacting with proteins [25]. This is supported by the very soft and mealy texture that was observed when the FFA levels reached 2.66% on day 22 of storage, at which point the fish was perceived by the sensory panel to be unacceptable for human consumption. The FFA had a high correlation of 0.74 with the QI. Microbiological analysis The TVC and H2S producing bacterial counts increased throughout the storage period. There was no considerable increase in the TVC for the first 10 days, after which a significant increase was observed. This increase coincided with the rise in pH, TVBN and H2S producing bacterial counts. It may be explained that the high post mortem pH and the chilled storage temperature were favourable factors that could have contributed to the sharp increase in the TVC [10]. The increase in the TVC could also have led to an increase in the breakdown of nitrogenous components resulting in increased TVBN. This was shown by the high correlation with pH and TVBN of 0.81 and 0.82, respectively. The increase in the bacterial counts also manifested itself in the changes in the sensory characteristics resulting in an increase in demerit points. The correlation between the TVC and the demerit points was high (0.84) indicating that the microbial growth could have contributed to the observed sensory changes. At the end of the storage in ice, H2S producing bacteria dominated the bacterial flora (7.3 log cfu/g) and this could primarily have been responsible for most of the spoilage [5]. This is supported by the rejection of the cooked Nile perch when a rotten odor with a strong ammoniacal smell, a sour, fishy and musty taste, and a very soft and mealy texture was detected at this point of fish storage. CONCLUSIONS The nutritional composition of Nile perch shows that it has high content of protein of 19.8% when fresh which tended to slightly reduce to 17.7% as the sensory quality deteriorated. The fish is lean and had a low lipid content of 0.59-0.63%. The moisture and ash content varied between 78.5 and 79.6%, and 0.55 and 0.63%, respectively. It was demonstrated in this study that the shelf life of iced ungutted Nile perch with a 3-4 hour delay before icing is 22 days and this is the point at which the sensory panel perceived that the fish was unacceptable for human consumption. However, the ungutted control which was iced immediately it was taken on board had a shelf life of 28 days under the environmental conditions in the fishery. The high correlations between the sensory, chemical and microbiological parameters studied showed that these parameters are related to each other when applied in determining the shelf life of the L. Victoria Nile perch. At the point of rejection, the level of TVBN was 26.0 mgN/100 g of flesh, FFA was 2.7%, TVC was 8.0 log cfu/g), the H2S producing bacterial count was 7.3 log cfu/g), the pH was 7.18, the total demerit points were 18.1 out of a possible 20. The scores for texture, taste and odour were 3.6, 4.3 and 4.4, respectively, in the cooked fish as determined by the panellists. ACKNOWLEDGEMENTS We are grateful to the Research and Extension Division of Egerton University for funding this study. We also wish to thank staff of the Ministry of Fisheries Development, Kisumu, Kenya, for useful discussions, and the Beach Management Units in Dunga and Ogal, as well as the individual fishermen who willingly participated in the study. REFERENCES
© Copyright 2009 - Rural Outreach Program The following images related to this document are available:Photo images[nd09033t4.jpg] [nd09033t6.jpg] [nd09033t5.jpg] [nd09033f1.jpg] [nd09033t3.jpg] [nd09033t2.jpg] [nd09033t8.jpg] [nd09033t1.jpg] [nd09033t7.jpg] |
| |||||||||
