 |
| About Bioline | All Journals | Testimonials | Membership | News |
|
||||||
|
||||||
African Journal of Food Agriculture Nutrition and Development, Vol. 9, No. 4, June, 2009, pp. 975-989 Prevalence Of Early Childhood Malnutrition And Influencing Factors In Peri Urban Areas Of Kabarole District, Western Uganda Turyashemererwa FM1*, Kikafunda JK1 and E Agaba 2 1Department of Food Science and Technology, Makerere
University, P.O. Box 7062, Kampala, Uganda ABSTRACT Uganda has one of the highest levels of childhood stunting in sub-Saharan Africa. It is well documented that the nutritional status of young children is one of the most sensitive indicators of sudden changes in health status and food availability, acting as a proxy indicator of socio-economic development. Kabarole District, the focus of the present study, is one of the most fertile areas in Uganda, with high per capita output of most foods. However, earlier studies in Kabarole District found that over 40% of children below five years of age were stunted. The objective of this study was, therefore, to asses the prevalence of malnutrition and the factors influencing the nutritional status of children below five years of age, in a peri-urban environment in Kabarole District, western Uganda. The study design was a cross sectional descriptive survey, using both qualitative and quantitative methods of data collection. A questionnaire was administered to 93 caretakers of children 6-59 months in randomly selected households, which explored the various factors that could be affecting the nutritional status of the children. Key information was also sought from a focus group discussion of a few selected mothers. Results revealed that stunting was highly prevalent with 41.6% of the children stunted. Under-weight and wasting were established at 15.7% and 3.4%, respectively. Education level of mother/caretaker (p=0.02), age of child (p=0.03), receipt of information on child feeding (p=0.009), illness (p=0.004) and time of introduction of other foods (p=0031) were significantly related to child stunting. On the other hand, household size, number of meals per day and awareness about the causes of malnutrition, were nonsignificantly associated with child stunting. These findings indicate that malnutrition, especially stunting, in this cohort of children in peri-urban areas of Kabalore District, is a big problem. Poor education levels of the mothers/caretakers and poor child feeding practices are some of the factors identified as major contributors to this problem. It is therefore recommended that appropriate nutrition interventions, particularly equipping mothers/caretakers with knowledge and skills in child feeding, child health, sanitation and other best practices for proper childcare, be put in place to address the problem of childhood malnutrition in Kabarole District and other areas in Uganda, and indeed in Sub-Saharan Africa, with similar settings. Key words: Childhood Malnutrition, Kabarole District, Uganda INTRODUCTION Despite Uganda’s favourable natural and human resource capacity, malnutrition remains one of the most important health and welfare problems [1]. The country has one of the highest levels of stunting in Sub-Sahara Africa [2, 3]. The 2000/01 Uganda Demographic and Health Survey showed that stunting was 39 percent, underweight 23 percent and wasting 4 percent among under-five children [4]. The nutritional situation of the children has not significantly changed since the previous Demographic and Health Surveys of late 1980’s [2] and mid 1990s [1]. These poor nutritional indicators are registered against a background of economic growth that the country has experienced for more than a decade [5]. Kabarole District, the focus of the present study, is one of the most fertile areas in Uganda, with high per capita output of most foods. However, earlier studies in Kabarole District had found that over 40% of children below five years of age were stunted [6]. The nutritional status of young children is one of the most sensitive indicators of sudden changes in health status and food availability acting as an indicator of economic development [7]. Malnutrition in children can take a form of stunting, wasting or underweight (8). Stunting, which is height for age below that expected on the basis of the International growth reference is a very serious type of malnutrition in that it develops slowly through time before it is evident [8]. The causes of malnutrition are many, complex and multidisciplinary. However, dietary and environmental factors play major roles, with the end results being ill health and eventually death [1]. It has been reported that dietary factors such as prolongedbreastfeeding (from >18 months to <24 months), low energy density of complimentary foods, factors concerning the mother (education level of the mother and low socio-economic status) and environmental factors contribute to the risk of malnutrition of children in developing countries [9, 10]. The extent to which these factors affect the nutritional status of peri-urban children has not been adequately studied in Uganda. A cross-sectional study was therefore conducted to assess the factors influencing the nutritional status of the children in a peri-urban environment in Kabarole District, Western Uganda. METHODS Study design The study was a cross sectional descriptive survey, using both qualitative and quantitative methods of data collection. Subjects, sample size and sampling procedures The subjects were infants and young children, aged 6-59 months and their mothers/caretakers from Kabarole District, Western Uganda. Stratified random sampling was used to select the study parishes, within Kabarole municipality. Sample size was calculated using conventional methods [11]. A sample size of 103 households was obtained, committing error of assumption as 9.56 percent, p=0.5 and 95 percent confidence limit. A focus group discussion was also carried out and participants were selected based on their leadership status in the area and willingness to participate. Inclusion and exclusion criteria Respondents were visited at their homes for recruitment and they were eligible if they met the inclusion criteria of having an infant/child aged between six to fifty nine months. Only children whose mothers were available and willing to participate in the study were recruited. Children who were above fifty nine months of age and those whose mothers were not available or were not able to participate, were excluded from the study. Ethical considerations The study received ethical clearance from Uganda National Council of Science and Technology. Details of the study were explained to the local leaders of the study area and the parents of the target children, who gave their verbal and written consent. Data collection methods Questionnaire A questionnaire was developed and implemented to collect data on socio-economic status, demographic characteristics, mothers/caretakers’ nutritional knowledge and feeding habits of the different households. The questionnaire was validated by the “jury” method[12] and pre-tested on a small sample of selected households in a setting similar to that of the study. The mothers of the children were interviewed in their homes. Nutritional status assessment The nutritional status of 93 children was assessed by anthropometric measurements. Body weight measurements were taken, in duplicate, to the nearest 0.1 kg, using a standardised 25 kg Salter Spring Scale (Salter Weight-Tronix Ltd, West Bromwich, United Kingdom) with subjects wearing minimal clothing. Standing height (for children 24-59 months) and recumbent length (for children below 24 months) measurements were taken, in duplicate, to the nearest 0.1 cm using Short’s Height Measuring Board (Short Productions, Woonsocket, RI, United Kingdom), with the subjects shoeless. The mean of the two measurements was used in the analysis. The age of each child was obtained from the mother and confirmed from health cards, birth and baptism certificates. Observation method and focus group discussions Information about perceptions of what the causes of malnutrition could be was captured from men, women and local leaders in the study area using a focus group discussion. Data analysis Data were analysed using the Statistical Package for Social Scientists (SPSS version 10) and EP-INFO 2003. To determine whether the children in the sample were stunted, underweight or wasted, children’s heights and weights were compared with median height-for-age, weight-for-height and weight-for-age of the National Centre for Health Statistics Reference Population [13]. Associations between different factors under investigation and level of stunting which were examined using Chi-square Statistic where a p-value of less than 0.05 was considered as statistically significant. RESULTS Nutritional status of the children Table 1 shows the nutritional status of the children using the nutritional indicators of stunting, underweight and wasting. Stunting was by far the most prevalent under-nutrition problem in the study area, with almost half of the children (41.6 percent) stunted. The overall prevalence of under-weight and wasting was 15.7 percent and 3.4 percent, respectively. However, older children (25-60 months) had a higher prevalence of stunting (29.2%) and underweight (16.2%) than younger children (0-24 months), where stunting prevalence was 12.4% and underweight 14.3%, respectively. None of the children 0-24 months was wasted (0.0%) compared to 3.4% of the children 25-60 months. Table 1: Nutritional status of children (n=93)
Background characteristics of respondents (Table 2) Majority of the caretakers were aged 20-24 (38.7%) and had children above 2 years of age (31.2%). The age brackets of 15-19 and 25-29 years also had a relatively higher number of children each, (24.7%). The proportion of caretakers with the least number of children, for both age groups, was that in the age bracket 40-44 (1.1%). The highest level of education by most caretakers was primary school level (49.4%), with most children below two years if age (29.0%) having their caretakers attaining this level. For both age groups, secondary education was attained by very few caretakers (3.3% and 5.4% respectively). A similar trend was repeated in both age groups, when it came to caretakers who had attained tertiary education (2.2% and 4.3% respectively). When occupation was considered, the majority (81.7%) were peasant farmers. Probably due to low literacy levels, only 15.1% and 3.2 % were business persons and teachers, respectively (Table 2). On the social aspect, more than half of the caretakers (55.9%) were married, while 36.6% were single. Only 2.2% were widowed while 5.4% were divorced. Majority of the households (44.1) were moderate in size, with most children above two years (26.9%) falling in this category of household size. Households which were extra big were only 7.5%, compared to 18.3% which were small in size. Table2: Background characteristics of respondents
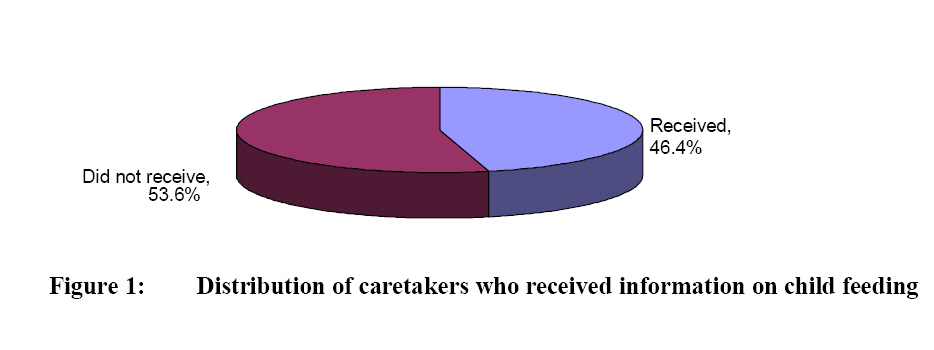
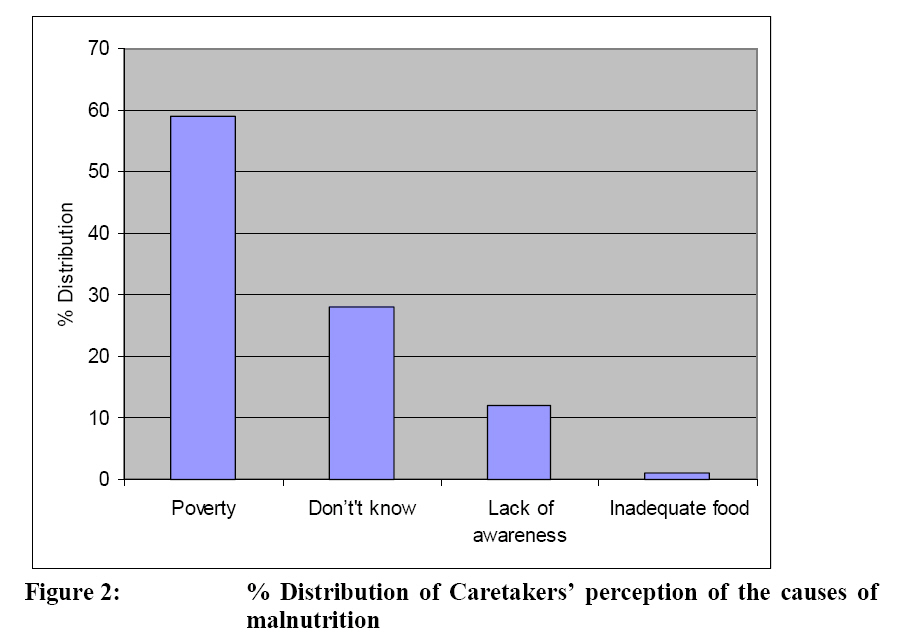
Child feeding practices Complementary feeding was started in two thirds (60.7%) of the children before they were 6 months old, while only 39.3% were started at 6 months. The majority of the children (71%) were fed three times a day, while only 29% were fed more than three times a day. Information on child feeding (Fig 1) The results show that more than half (53.6%) of the mothers/caretakers had never received any information on child feeding while 46.4% had received such information. Perception about the causes of malnutrition (Fig 2) In order to asses mothers/caretakers’ knowledge of the factors that may contribute to poor nutritional status among their children, the majority (59%) identified poverty as the major cause of under-nutrition. The proportion of mothers who didn’t know of any causes of malnutrition was 28%, while inadequate food supply and lack of awareness about good nutrition was reported 12% and 1 percent, respectively. Lack of awareness was defined as someone who lacked knowledge about proper nutrition requirements for children. Community’s Perception of the Causes of Malnutrition Datawerecollected from focus group and key informant discussions to identify what communities perceived as major contributing factors to malnutrition in the area. The ratings of the various factors were identified. Most mothers attributed malnutrition to lack of awareness (five mothers out of seven) and poverty (four mothers out of seven), in the focus group discussion ratings. Only two mothers thoughtdrunkenness by parents was a contributing factor. Some of the leaders in the focus group discussion attributed lack of formal education (two out of five), large families (two out of five) and early marriages (one out of five) as the major cause of malnutrition in the community. Influencing factors for stunting rates among children above two years of age Cross-tabulated results, Table 3, show the relationship between nutritional status and stunting of children above two years of age. The factors with a significant association with child stunting under two years were education level of caretaker (p=0.008) and if the caretaker had received information on child feeding (p=0.009). The factors non significantly associated with child stinting were household size (p=0.379), child illness (p=0.325), time of introduction of new foods (p=0.142), number of meals per day (p=0.108) and causes of malnutrition (p=0.353). Table3: Factors influencing stunting rates among children above two years of age
Influencing factors for stunting rates among children below two years of age (Table 4) The only factor with a significant association with child stunting under two years was education level of caretaker (p=0.004). Information on child feeding (p=0.205), household size (p=0.06), child illness (p=0.811), number of meals per day (p=0.09, time of introduction of new food (p=0.219) and causes of malnutrition (p=0.679), were all nonsignificantly associated with child stunting below two years of age. Table 4: Factors influencing stunting rates among children below two years of age
DISCUSSION The nutritional status of the children Stunting Stunting was by far the most prevalent under-nutrition problem in the study area, with almost half of the childrenin the sample(41.6%) being stunted. This level of stunting is very high, well above the national average of 39 percent [4]. The figure is comparable to that of 44.3% obtained for Kabarole District by Jitta and co-workers in the early 1990s[6] in their secondary analysis of the Uganda Demographic and Health Survey data [2] and more recent data of 46.3% found in pre-school children in the suburbs of Kampala City, Central Uganda [14]. Similar to other studies, the level of stunting was higher in older children, compared to the younger ones [2, 6]. Under-weight Results for under-weight (15.7%) were lower than the national figure of 23 percent[4] and those for Kabarole District (25.7%) by Jitta and colleagues [6]. Under-weight (low weight-for-age) has elements of both chronic and recent under-nutrition [3, 4]. The data implies that the affected children experience a combination inadequate food intake and diseases. Wasting Wasting is often taken as evidence of acute under-nutrition. The prevalence of wasting at 3.4 percent, though lower than national figure of 4.5 percent is still unacceptably high [4]. Wasting is a consequence of either extreme food shortage, poor caring practices and/or frequent infections. It should be noted that after an acute infection, weight gain is relatively rapidly, but linear growth remains stagnant and the situation is worsened by repeated episodes of illness [15]. In addition, in cases like Uganda where most of the children are already stunted, the wasting indicator is usually insignificant, and hence more emphasis should be put on underweight and stunting rather than wasting [6]. Factors influencing childhood malnutrition (using stunting) in Kabarole District Factors related to the child Child illness For children above and below two years of age, the results are in dis-agreement with those of Kikafunda and et al. (1998), who found that poor health significantly increased child stunting [10].Whereas thisstudy targeted specific illness, this study did not, and hence a probable cause for the discrepancy. The relationship between illness and malnutrition is two fold; first, malnutrition makes children vulnerable to diseases, and in turn a child loses appetite [16]. If not properly fed, they are likely to be malnourished. Illness also increases the metabolism that in turn interferes with assimilation of nutrients into the body. The reduced food intake results in the break down of body reserves or other tissues leading to loss of weight and recurrent fever which leads to stunting [17]. The situation is even worse if the child is suffering from diarrhoeal diseases because of the rapid loss of water and other nutrients from the body. Feeding practices World Health Organisation and UNICEF have recommended that complementary foods should not be given before six months of age [18]. Introducing these foods too early reduces the amount of breast milk the child is taking in and introduces the child to pathogens and subsequent diarrhoeal diseases and in most cases in developing countries, these foods are not really tailored to the needs of the infant [19]. In this study, introduction of complementary foods was not associated with child stunting, for both age groups. The number of meals a child takes has an effect on his/ her nutritional status, since it is related to nutrient intake. The more the frequency of feeding the higher the chances of meeting the recommended daily nutrient intake [20]. Results from this study, from both age groups, however, had a non significant relationship between the level of stunting and the amount of food a child ate in a day. Factors related to the mother Low education level of the mother High education, especially secondary and tertiary education, is associated with high socio-economic status, good quality environment and good healthcare through nutritional knowledge, attitudes and practices (14). Increasing level of education of parents has been found to reduce incidences of under-weight [6]. The results of this study, for both age groups, have a significant association between poor nutritional status and level of parental education are in agreement with results of the other studies, with malnutrition most prevalent among children whose mothers had low education levels compared to those whose mothers had attained higher education levels [1, 10, 21]. Knowledge about proper nutrition The findings show that many of the caretakers of children under five years of age in the District did not have access to information on child feeding and care. Much as there was no significant relationships between child stunting and the causes of malnutrition in either age categories, the data could imply that there were no extension services in the district in form of community out-reach programs to educate the mothers and caretakers’ of children on matters pertaining to nutrition. Consistent withother studies, lack of knowledge about proper nutrition could be attributed to the poor education level of women [6, 10]. Under-weight and stunting of children are significantly higher when parents have not had any education or when they cannotread or write [10]. Quoting the words in the focus group discussion; ‘‘A woman may be having all the food in the home but would keep on preparing one type of food for the children. Most women do not know what to prepare for young children and when food is prepared, it is not served on time’’ As Latham observed, the problem in most African settings is not about lack of food but lack of knowledge about food [22]. Factors related to the household Household size The results from this study show non significant relationships between family size and level of stunting in both age categories. Nonetheless, big families are associated with polygamous practices and under such circumstances, one would expect such families to have malnourished children since the available food must be shared among many people, thus reducing the amount available per person. Contrary to our findings,Jitta et al., found that under-weight and stunting among children was significantly affected by family size with bigger households (8 people or more) being more affected [6]. Children in bigger households not only compete for food but also for maternal care and other resources. CONCLUSION Malnutrition, especially stunting, in this cohort of children in peri-urban areas of KabaloreDistrict, was found to be very high. A range of factors including low education levels of mothers/caretakers, child illness and poor child feeding practices were identified as some of the key contributors to malnutrition of these children. Outreach programmes targeting teaching mothers/caregiver about the importance of good nutrition for proper child growth and development, should be carried out by appropriate sectors. ACKNOWLEDGEMENT Researchers wish to thank Lisa Warth and Angelika and family for their support. All children and mothers/caretakers who participated in this study are also appreciated. REFERENCES
© Copyright 2009 - Rural Outreach Program The following images related to this document are available:Photo images[nd09040f2.jpg] [nd09040f1.jpg] | |||||||||||||||||||||||||||||||||||||||||||||||||||||||||||||||||||||||||||||||||||||||||||||||||||||||||||||||||||||||||||||||||||||||||||||||||||||||||||||||||||||||||||||||||||||||||||||||||||||||||||||||||||||||||||||||||||||||||||||||||||||||||||||||||||||||||||||||||||||||||||||||||||||||||||||||||||||||||||||||||||||||||||||||||||||||||||||||||||||||||||||||||||||||||||||||||||||||||||||||||||||||||||||||||||||||||||||||||||||||||||||||||||||||||||||||||||||||||||||||||||||||||||||||||||||||||||||||||||||||||||||||
| |||||||||
