 |
| About Bioline | All Journals | Testimonials | Membership | News |
|
||||||
|
||||||
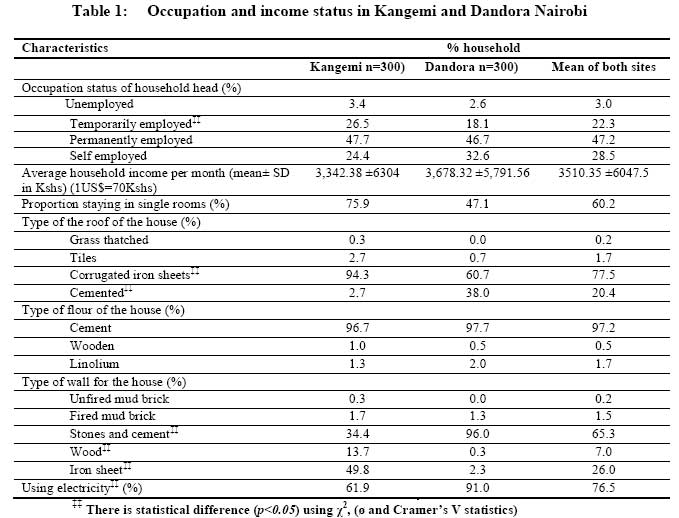
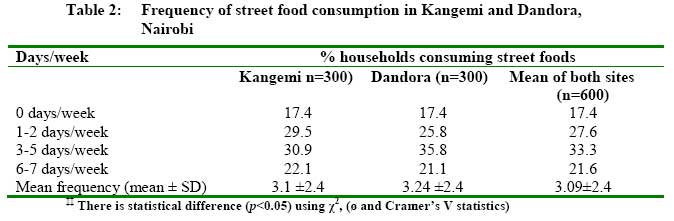
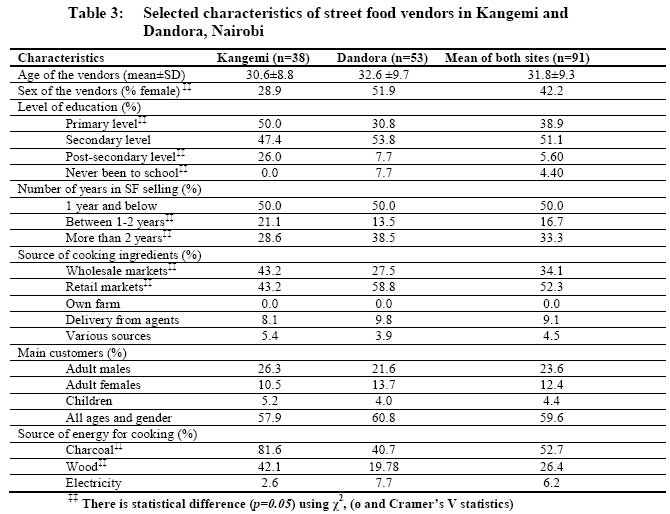
African Journal of Food Agriculture, Nutrition and Development, Vol. 9, No. 5, May, 2009, pp. 1129-1145 Article Potential role of street foods as micronutrients source among low income groups in Nairobi, Kenya Oyunga-Ogubi MA, Waudo NJ, Afullo A, Oiye SO KARI-National Potato Research Center, Tigoni, P.O Box 338, 00217, Limuru Correspondence Address:KARI-National Potato Research Center, Tigoni, P.O Box 338, 00217, Limuru ogubim2003@yahoo.com Code Number: nd09051 Abstract Although more than 40% of Nairobi's lower-income groups consume street foods, there is paucity of information available for urban policy makers and programmers on the potential contribution of street foods to micronutrient intake. A cross-sectional survey and a non-repetitive 24-hour dietary recall were employed to determine household intake of vitamin A, iron and zinc, and the proportion of the intakes from street foods in the selected Kangemi and Dandora estates in Nairobi, Kenya (low and middle-low income groups respectively). Results indicate that there was no significant statistical difference in the consumption pattern of street foods between the two sites. Absolute vitamin A, iron and zinc intake from street foods were comparatively lower among the low income groups as compared to middle-low income groups, these variations were not significant except for zinc. Street foods were less important vitamin A source in Kangemi (4.4% of total intake and 2.64% of the RDA) than in Dandora (26% of total intake and 9.46% of the RDA). The proportion of those who obtained at least 50% of total vitamin A from street foods was also significantly higher in Dandora. Iron intake contributed by street foods significantly differed with Dandora being higher (30%) than Kangemi (21%). Although not significantly different, those who obtained at least 50% iron from street foods was higher in Dandora than Kangemi. Iron intake from street foods in both sites (15mg/AE in Kangemi and 25mg/AE in Dandora) was sufficient to meet the RDA for iron for adults (5-28mg/AE). Zinc intake contributed by street foods was not significantly higher in Dandora (25.2%) than Kangemi (16.7%). The proportion of those who obtained at least 50% of their zinc intake from the street foods was also insignificantly higher in Dandora (12%) than Kangemi (7%). Overall, street foods are better contributors of iron (26% of total intake) and zinc (21%) than vitamin A (12%). Apparent factors that tend to potentially influence street foods contribution to micronutrient nutrition are economic status, availability and proximity to street foods, consumption pattern and the type of street foods sold. Street food trade deserves recognition by urban policy makers in order to improve the opportunities of vendors to support their livelihood and to ensure the availability of affordable, safe and nutritious food for low income consumers.Keywords: urban-poor, zinc, iron, vitamin A Introduction Street foods (SFs) have become an indispensable component of the socio-economic environment of many cities in developing countries. Their nutritional significance to urban populations is considerable [1] . In Nairobi, the vending of street foods increased substantially during the 1980s and 1990s, particularly in the low income and in the industrial areas [2] . More recently, due to the increase in urban populations, the number of street food vendors/hawkers has risen greatly in response to the need to feed larger populations. This has been heightened by the daily influx from residential areas to working places that has created need among many working people to eat outside the home more often [3] . Although more than 40% of households in Nairobi′s lower-income areas consume SFs, there is paucity of knowledge on the contribution or potential contribution of these foods to micronutrient intake [4] . A study by Mwaniki et al . [5] showed that sixty percent of pre-school children in Kenya are estimated to have iron deficiency anemia while seventy percent are estimated to be vitamin A deficient (VAD), one of the highest rates in sub-Saharan Africa. Further, the study found that 50.8% of children had low serum zinc (< 65µg/dl). Micronutrients function as co-factors that enable the body to produce enzymes, hormones and other substances essential for proper growth and development. Although only small amounts are required, the consequences of their absence are severe [6] . Diets poor in micronutrients are associated with increased risk of infection and are known to cause blindness, premature death, reduced productivity, and impaired mental development, particularly among women and children in developing countries [7] . Known as "hidden hunger," micronutrient malnutrition can exist even when poor people have enough to eat, but lack the resources to afford a complete diet of fruits, vegetables, meat, and other foods rich in vitamins and minerals [8] . Given the devastating and increasing malnutrition rates among Kenyan urban low-income populations [9],[10] , understanding the micronutrient accessibility through the major food systems of the poor is important [11] . Food fortification is often touted as the most promising short-to medium term strategy for combating micronutrient malnutrition. Despite its appealing characteristics, progress in fortification has been slow. For instance, in Kenya, fortification of foods is not yet an important source of most micronutrients especially for the poor [12] . It is apparent that SFs consumed by about 40% of the lower-income groups could be a potentially important source of micronutrients. The micronutrient composition of the SFs sold and consumed is not known although it has been noted by Mwangi et al. that these sources of micronutrients are inadequate [3] . Under these circumstances, the potential role of SFs in terms of micronutrient intake and scope for increasing micronutrient contribution needs to be explored and incorporated into Kenyan policy programs. These are policies that aim at eradicating poverty and inequality and improving physical and economic access by all, at all times, to sufficient, nutritionally adequate and safe food and its effective utilization. Because SFs vary so much in type from country to country, for specific country recommendations, it is impossible to draw any general conclusions from the few analyses that have been done in some countries [13] . In this regard, this study was undertaken and the results are expected to inform the various stakeholders including local authorities, Ministries of Health (Public Health officials), Agriculture (Bio-fortification programs), relevant local and international NGOs (such as FAO) and donors on potential role of street foods in alleviating micronutrient malnutrition in lower-income groups. It is hoped that the results here-in would accelerate the development of policy and programs that support and augment the SFs contribution to micro-nutrient nutrition in the cities. Materials and Methods Study sites selection Street foods selling and consumption is a common characteristic of large and small cities in Kenya, but Nairobi was selected for the virtue of being the capital city. It is a cosmopolitan city housing people from all ethnic groups and races in Kenya. Differences in history, use and types of SFs vending in Nairobi compared to other large (metropolitan) cities such as Mombasa, Nakuru and Kisumu were not expected to be significant. The study compared two different socio-economic sites, the low and middle-low income levels in Nairobi [14] . Nairobi was clustered into West and East taking the Central Business District as the reference point. To each side of Nairobi, the estates were categorized into 4 socio-economic levels outlined by the Government of Kenya [10] as: high, middle, middle-low and low income areas. On the west side, a list was made purposively of all settlement sites belonging to the middle-low and low-income areas only (where SFs are commonly sold and consumed). One area was randomly selected - Kangemi estate (low income area). To the East same procedure was repeated but excluding low-income estates since a site that falls into this category had already been selected on the West of Nairobi. Dandora estate a middle-low income site was randomly selected. Dandora is about 30km from Kangemi estate. Household selection and sample determination The selected study sites were stratified based on the different administrative systems used -villages for Kangemi and phases for Dandora. From each stratum, villages and phases were selected by the use of random numbers. The populations in Kangemi and Dandora are 19,298 and 36,691, respectively [14] . This formed the sampling frame from where the sample size was drawn. In obtaining a representative sample size, the Fisher et al. equation recommended by FAO, and Mugenda and Mugenda [15],[16],[17] , was used to compute the number of caregivers to be interviewed per area. From the selected villages/phases, households were selected by the use of random numbers (chits). A total of 600 households were selected with 300 households per area. It was ensured that from each village or phase, equal number of households was randomly considered. During the survey, if the selected household had no respondent, the survey proceeded to the next household until the sample size was obtained. For household dietary surveys, the respondent was usually the caregiver (95%) or alternate cases (5%) were adults or older children (>15years old). Data collection Socio-demographic, economic and 7-day food frequency data was collected from all sampled households. To estimate the quantities of ingredients used per pot, an interactive 24-hour dietary recall developed by Gibson et al. [18] was used to obtain the sample size. The calculations for sample size were repeated for each of the 3 micronutrients where the largest sample size was considered - worst case was applied. All values used for calculation of sample size are as reported by Mwangi et al. [3] . The respondent was usually the female involved in food preparation. Sixty households per site were surveyed. It was assumed that the ingredients used per pot were evenly distributed among the servings. Nutrients provided per serving from home prepared foods (HPFs) (VA and iron) were calculated using the Kenya Food Composition Tables and compared to the Recommended Daily Allowances (RDA) of an average Kenyan adult male referred to as Adult Equivalent (AE) ) [19] . Food and Agriculture Organization (FAO) data were used to calculate zinc values since these were absent in the Kenyan database [20] . The pro-vitamin A carotenoids were converted to µgRE (micrograms Retinol Equivalent) using the 6:1 ratio [19] and not the conversion ratio of 12:1 currently proposed by the Institute of Medicine [21] . Street foods vendor survey From initial visits and pre-testing, it was found that there were approximately 30-50 vendors/processors of SFs within each study site. They were all considered for the vendor/processor survey as long as they sold SFs as defined in this study. Street foods in this study have been defined as ′ready-to-eat′ foods and beverages, processed or fresh, which are sold on the streets as opposed to stores and licensed establishments, and which are sold at stationary locations or by mobile vendors and are not only restricted to snack like items [4] . Thus, 38 and 53 vendors were interviewed in Kangemi and Dandora, respectively. Data Analysis Data were analyzed using SPSS version 12 for windows. Frequencies were run to determine distributions. Proportions were compared using ÷2 as well as ø and Cramer′s V statistics. Student′s t-test was used to determine level of significance. The level of significance was set at p=0.05. Results Economic status of the respondents [Table - 1] depicts the economic status of the respondents. Most household heads (47.2%) in both sites were permanently employed with a very small proportion (3%) being unemployed. The occupation status was found to be comparable among the two sites except for temporarily employment. The average household income was higher in Dandora at Kshs 3,342.38 ± 6,304/month but was not significantly different from Kangemi with Kshs 3,678.32± 5791.56/month. The higher SDs were registered due to many respondents reporting zero income- 59% in Kangemi and 51.33 in Dandora (data not shown in the tables). It was noted that marked differences in socio-economic status of the two sites were more evident in the type of housing (building material used) and access to electricity than the occupation and household income of the dwellers. Dandora in this regard had better housing and other facilities than Kangemi and this can be confirmed with actual observations. Street foods consumption pattern The distribution and consumption pattern of SFs (7-day food frequency) were comparable in both sites. Slightly more than a third on average consumed SFs 3-5 days a week and about one-fifth consumed SFs on a daily basis as depicted in [Table - 2]. In both areas about 17.4% did not consume SFs throughout the year [Table - 2]. About half of Kangemi dwellers (49.8%) gave lack of sufficient time to cook as the reason for consuming SFs and this was different from Dandora where only 2.7% gave such a reason. Further, more people in Kangemi (24.7%) than Dandora (17.4%) gave lack of money as a reason for not relying on SFs. Street foods vending There were more female vendors in Dandora (51.9%) than in Kangemi (28.9%). Half of the vendors had only operated for 1 year or less at the time of the survey [Table - 3]. A majority of the vendors in both sites obtained cooking ingredients from retailers (52%) and wholesalers (34%). Charcoal was the main cooking fuel and was more important in Kangemi (81.6%) than in Dandora (40.7%). Wood was also an important source of energy and was used more by vendors in Kangemi than in Dandora. Electric power was the least used source of cooking fuel in both sites. Most vendors (57.9%) reported that consumers were of all ages and gender but a considerable proportion (23.6%) from both sites said that foods were mostly sold to adult males.
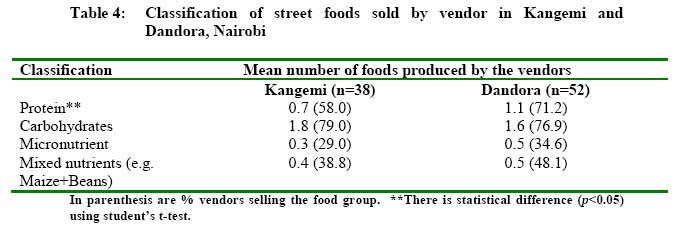
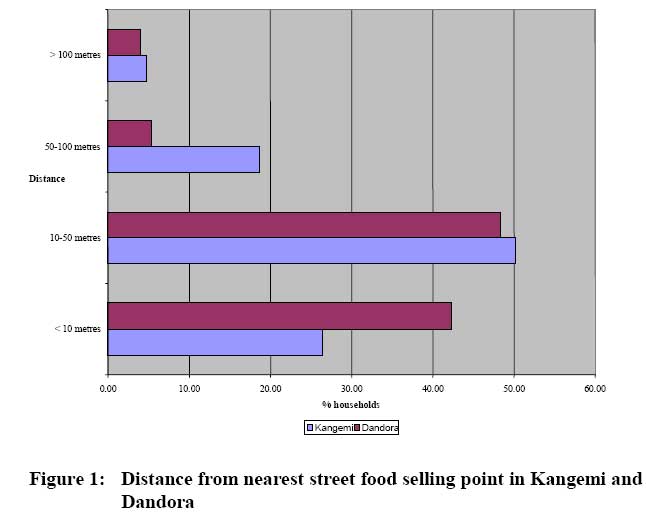
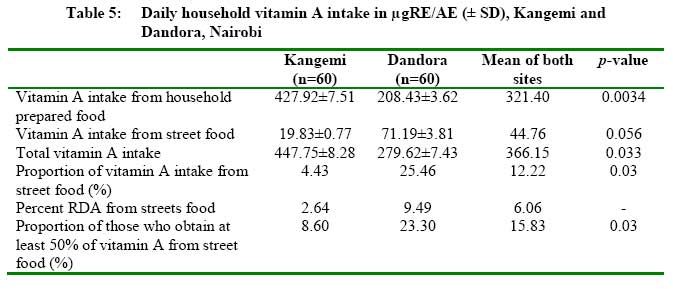
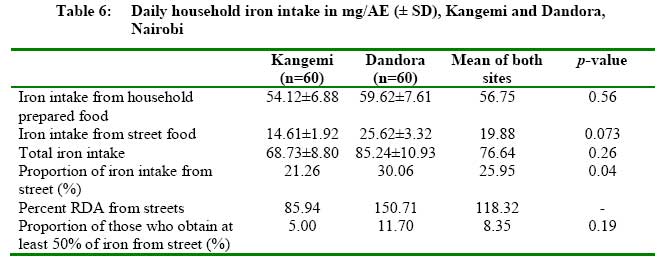
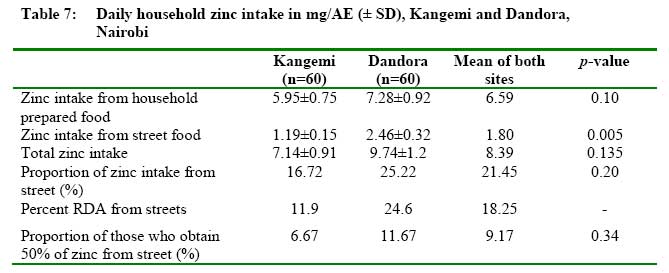
Street food vendors in both sites sell a wide range of foods but mostly those that are protein- and carbohydrate- rich as shown in [Table - 4]. When these foods were classified in the major food groups on average a vendor in Dandora prepared and sold at least one SF food rich in protein (animal and vegetable). This was higher when compared to Kangemi who supplied less than one SF (0.7) rich in protein. All vendors in the two sites prepared about two SFs rich in carbohydrates and were comparable (chapatti, ugali and mandazi ). The proportion of vendors selling carbohydrate foods was also the highest among the different food classes- 79% in Kangemi and 76.9% in Dandora. Street foods rich in micronutrients were least sold in the two sites; only 0.3 vendors sold these foods in Kangemi while 0.5 sold the same in Dandora (these were orange fleshed sweetpotato (OFSP), fruits, and vegetables). The proportion of vendors selling SFs rich in mixed nutrients ( githeri , mokimo and Kienyeji {irio}) was not as high as those selling SFs rich in protein and carbohydrates alone, which was 39% and 48% in Kangemi and Dandora, respectively. As depicted in [Table - 4], there were more households closer to the SFs vending points (< 10 meters) in Dandora (43%) than in Kangemi (27%) [Figure - 1]. It seemed that Kangemi dwellers were far much further from street food vendors than their counterparts in Dandora. Household intake of vitamin A, iron and zinc from street foods [Table - 5] summarizes VA intake from the two study sites. Vitamin A intake from household prepared foods (HPFs) was significantly higher in Kangemi (428µg RE/AE) than in Dandora (208µg RE/AE), while VA intake from SFs was insignificantly higher in Dandora (71µg RE/AE) than Kangemi (20µg RE/AE). In this regard total household VA intake was higher in Kangemi (447µg RE/AE) than in Dandora (279µg RE/AE). Street foods thus were a less important VA source in Kangemi (4.4% of total intake and 2.64 of the RDA) than in Dandora (25.4% of total intake and 9.46% of the RDA) and there was significant difference between the two sites with regard to the contribution to the daily household intake (p< 0.05). The proportion of those who obtained at least 50% VA from SFs was also significantly higher in Dandora (23%) than in Kangemi (8.6%). Although not consumed as much as the cereals and pulses, the major contributors to VA intake were orange-fleshed sweetpotato, African black nightshades, beef sausages, vegetable samosas , green grams, kales, animal offal, and beef. Iron intake from HPFs in the two study sites was comparable, averaging about 57mg/day [Table - 6]. Intake from SFs was, however, higher in Dandora (26mg/AE) than Kangemi (15mg/AE). Total iron intake was also higher in Dandora (85.24 mg/AE ) than in Kangemi (68.73 mg/AE). The proportion of iron intake contributed by SFs differed between the two sites, with the contribution in Dandora (30%) being significantly higher than Kangemi (21%). The proportion of those who obtained at least 50% of iron intake from the SFs was not significantly higher in Dandora (11.7%) than Kangemi (5%). Street foods play an important role as source of iron providing about a quarter of the daily intake but was more important in Dandora than in Kangemi. Iron from SFs alone was adequate to meet 85.94% of RDA in Kangemi and 150.71% of the RDA in Dandora. The intake was way above the RDA of 5-9mg for an adult male and 14-28mg for adult female [19] . Fried cabbages had the highest level of iron 17.9mg/100g dw with 50% bioavailability. Other sources high in iron bioavailability (72-97.5%) were beef sausages, animal offal, stewed beef, potato chips, mandazi (doughnut). Those low in iron bioavailability (0-48%) were African black nightshades, Kales, fried beans, githeri (boiled/fried maize and beans). Zinc intake from HPFs, SFs and consequently total intake was higher in Dandora than in Kangemi. In Dandora zinc intake from SFs were 2.5mg/AE while in Kangemi it was only 1.2mg/AE. The RDA for zinc was assumed to be 10mg/AE per day as reported by [22] . In this regard, zinc intake from SFs accounted for only 11.9% of RDA in Kangemi and 24.6% in Dandora [Table - 7]. The proportion of zinc intake contributed by SFs although not significant was higher in Dandora (25.2%) than in Kangemi (16.2%). Those who obtained at least 50% of zinc intake from the SFs were higher in Dandora (12%) than in Kangemi (7%) but this difference was not significant . Fried cabbages had the highest level of zinc with 63.5% bioavailability. Other sources high in zinc bioavailability (55-90%) were beef sausages, animal offal, stewed beef, potato chips, mandazi , githeri , fried beans and kale. Those low in zinc bioavailability (0-46%) were, fried African black nightshades, samosa , stewed green grams, OFSP and tea. Discussion The study has shown that SFs are significant micronutrient sources in Kangemi (low income group) and Dandora (middle-low income groups). This contradicts earlier findings by van′t Riet which found that SF consumption in the low-income area was higher than in the low-middle-income of Dandora [4] . Income levels and general socio-economic status are major determinants of the degree of an urban population′s access to food and of the nature of their choice of foods [23] . Comparable income and socio-economic indicators explained lack of great disparity in SFs access and micronutrient intake between the two groups. It was revealed that more female vendors in Dandora than in Kangemi. Female vendors have been found to be better at preparing quality foods especially where the consumers are willing to pay. Mwangi et al. [2] in Nairobi found that carbohydrate-rich foods were associated with male vendors while mixed nutrient (irio) foods and foods rich in micronutrients were associated with female vendors. This may explains why Dandora had more food varieties and, therefore, more micronutrient nutrient intake as compared to Kangemi where most vendors were male. Retail and wholesale markets are the main sources of cooking ingredients, which means that vendors have no control over nutrient quality of what they purchase. A report by FAO indicates that one of the difficulties in the control of SFs quality is that vendors often operate according to informal rules with their suppliers and clients [1] . Most of the vendors had been in operation for one year or less. This is because they operate in a permanent state of uncertainty, with little or no recourse to justice [4] . This is linked to the lack of official recognition and the absence of any form of policy governing the SFs sector [24] . Although a majority of vendors had attained both primary (39%) and secondary (51%) education, this did not determine the quality of foods made. This confirms findings by FAO that SFs vending does not require specific training other than the domestic experience of preparing food [1] . Given that increasing employment is one of the major strategies of the Kenyan government to boost economic develop-ment, the contribution of the informal sector has been found to be significant, and any effort to eliminate SFs vendors may be retrogressive [4] . Vendors particularly those in Dandora chose their selling points carefully, concentrating in a variety of strategic spots, which contrary to expectation, were not in exclusively commercial areas. There were more households closer to the SFs vending points (< 10 meters) in Dandora compared to Kangemi. This implies more accessibility of SFs in Dandora. From observations Kangemi appeared more crowded and vendors had to seek out- spots that were far from households unlike Dandora where the community was more organized in terms of buildings and access to basic services, thus availing more space for vendors to get close to households. Furthermore Dandora had a larger population (36,691) than Kangemi (19,298) [10] . This supports the suggestion by Tinker that there is a direct association between the number of SF enterprises and increases in city sizes [25] . Although there are a variety of food groups in both sites, the most common food group produced is carbohydrates. This is consistent with findings by Mwangi and van′t Riet [2],[4] , where they found that although the SF sector in Nairobi offered products from all food groups, most vendors are one-food group sellers with cereals as the predominant group. There is a higher consumption of protein, especially meat in Dandora, which favor consumers in Dandora since the consumption of protein especially meat improves the absorption of most micronutrients in the meal [26] . None of the total household VA intakes of the two areas was close to the recommended adult RDA of 750µg RE as reported by Sehmi [19] . The amount of VA from SFs did not meet the RDA in both sites and this confirms the observation by Mwangi et al. [3] that SFs in low income groups lack in variety for quality diet [3] . Fruits which are the major plant sources of VA are considered expensive, contain a lot of water, are not stomach filling and hence not in the interest of the urban poor [2] . Since the pro-vitamin A carotenoids were converted to Retinol Equivalent (RE) using the 6:1 ratio [19] and not the conversion ratio of 12:1 currently proposed by IOM [21] , a larger amount of provitamin A carotenoids, may be needed to meet VA requirement in the two sites. This also means that the conversion of VA from pro-vitamin A carotenoids using Kenyan data base has been overestimated. Intake of iron in the two areas was far above the RDA of 5-9 mg for an adult male and 14-28 mg for adult female [19] . These findings are consistent with those of Mwangi et al. that SFs in Nairobi are able to provide adequate dietary iron and even far in excess of the RDA, irrespective of the type of the main meal [2] . Although the amount of iron taken in both study sites is adequate, the problem of iron deficiency anemia still persists. This supports the suggestion that nutritional anemia needs to be effectively prevented and controlled by a combination of both vitamins and minerals in the diet [27] . Further, the common practice (>80% of consumers) of consuming tea alongside most meals has the effect of reducing the absorption of non-heme iron from plant sources. Fruits such as oranges and lemons were hardly consumed during meals. Vitamin C from these fruits enhances non-heme iron absorption in the presence of all known inhibitors of iron absorption including phytates (cereals and legumes), and polyphenols (tea, coffee, cocoa, certain vegetables and grains) [26] . The differences in quantities of iron intake could be partly attributed to the consumption pattern since the consumption of some iron-rich foods was different in the two sites. These foods are meat, githeri and French fries, which were found to be high in iron. Zinc intake in the two sites performed very poorly. These findings are in agreement with those of Okoth that the most commonly consumed staples in Kenya can hardly meet the RDA of adults for zinc [28] . None of the vendors fermented, soaked, or germinated the cooking ingredients used in SF preparation. These practices are known to improve the bioavailability of minerals including zinc [29] . Conclusion and Reccomendations The study revealed that although absolute vitamin A, iron and zinc intake from street foods are lower among the low income groups as compared to middle-low income groups, these variations were not significant except for zinc. Street foods are better contributors of iron (26% of total intake) and zinc (21%) than vitamin A (12%). The contribution of street foods to micronutrient intake is also significantly higher in middle-low income groups than low income groups except for zinc. Apparently, factors that tend to potentially influence street foods contribution to micronutrient nutrition are economic status, availability and proximity to street foods, consumption pattern and the type of street foods sold. Street food trade deserves recognition by urban policy makers in order to improve the opportunities of vendors to support their livelihood and to ensure the availability of affordable, safe and nutritious food for low income consumers. Acknowledgment Special thanks to Urban Harvest and International Potato Center, Nairobi for funding part of this study. Additional funds from World Bank through the Kenya Agricultural Productivity Project, Clive West Micronutrient Grant of the University of Wageningen and Food Science and Nutrition Network for Africa are highly appreciated. References
Copyright 2009 - African Journal of Food Agriculture, Nutrition and Development The following images related to this document are available:Photo images[nd09051t7.jpg] [nd09051t2.jpg] [nd09051f1.jpg] [nd09051t3.jpg] [nd09051t4.jpg] [nd09051t1.jpg] [nd09051t6.jpg] [nd09051t5.jpg] |
| |||||||||
